Preface: Explaining our market timing models
We maintain several market timing models, each with differing time horizons. The “Ultimate Market Timing Model” is a long-term market timing model based on the research outlined in our post, Building the ultimate market timing model. This model tends to generate only a handful of signals each decade.
The Trend Asset Allocation Model is an asset allocation model which applies trend following principles based on the inputs of global stock and commodity price. This model has a shorter time horizon and tends to turn over about 4-6 times a year. In essence, it seeks to answer the question, “Is the trend in the global economy expansion (bullish) or contraction (bearish)?”
My inner trader uses a trading model, which is a blend of price momentum (is the Trend Model becoming more bullish, or bearish?) and overbought/oversold extremes (don’t buy if the trend is overbought, and vice versa). Subscribers receive real-time alerts of model changes, and a hypothetical trading record of the those email alerts are updated weekly here. The hypothetical trading record of the trading model of the real-time alerts that began in March 2016 is shown below.

The latest signals of each model are as follows:
- Ultimate market timing model: Sell equities
- Trend Model signal: Neutral
- Trading model: Bearish
Update schedule: I generally update model readings on my site on weekends and tweet mid-week observations at @humblestudent. Subscribers receive real-time alerts of trading model changes, and a hypothetical trading record of the those email alerts is shown here.
Subscribers can access the latest signal in real-time here.
Just a flesh wound?
Was the market’s -5.9% one-day swoon last Thursday the start of a major correction, or just a flesh wound?

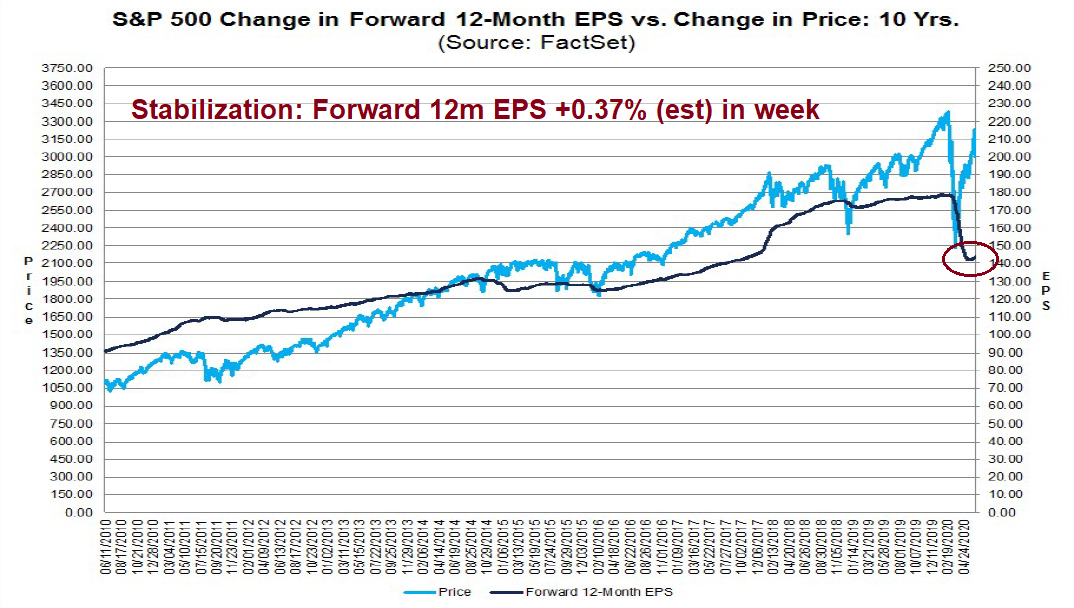
The S&P 500 exhibited an island reversal last week while violating a key rising trend line that went back to the March bottom, which are bearish. On the other hand, it successfully tested its 200 day moving average (dma), and the VIX Index (bottom panel) recycled from above its upper Bollinger Band (BB), which is an oversold reading, to below, which are constructive signs for the bull case.

What’s next? The market had been rising steadily so long that it’s difficult to ascertain the short or intermediate term trend. The strength of an uptrend is not known until it is tested in a pullback.
The bull case
Here is the bull case. Risk appetite indicators are still intact. The price relative performance of high yield, or junk, bonds and municipal bonds to their duration-equality are holding up well.

EM risk appetite, as measured by EM currencies and the relative price performance of EM bonds to their UST duration-equivalents, have been holding up well.

Equity risk appetite, as measured by the ratio of high beta to low volatility stocks, is still in a relative uptrend. So are the different versions of the Advance-Decline Lines. More importantly, the NYSE A-D Line made a fresh all-time high last week, which is bullish.

The market is exhibiting a recovery in fundamental momentum, and strong breadth and price momentum. Fundamental momentum can be measured by estimate revisions, which has bottomed and starting to rise.
The percentage of stocks above their 50 dma recently rose above the 90% level. Such episodes have tended to be bullish in the past. Of the 10 signals seen in the last 19 years, seven have resolved bullishly, one was neutral, and two were bearish.

That’s bullish, right?
The bear case
Not so fast! A dated but useful analysis from OddStats for 1923-2018 shows that, on average, the market rises 60% of the time on a one-month horizon and 63% of the time one a three-month horizon. A success rate of 70% for the percentage above 50 dma signal (n=10) is encouraging, but cannot said to be a wildly predictive.

Here are my other concerns. I have been monitoring the NYSE McClellan Summation Index (NYSI) for several weeks. In the past, whenever the NYSI has become oversold enough to fall below the -1000 level, its weekly slow stochastic had always rebounded from an oversold to an overbought reading. The stochastic has now reached its upside objective, indicating limited upside potential. Moreover, two of the last three rebound episodes were bear market rallies where the final lows of the bear markets were not in yet.

The most worrisome aspect of the intermediate term outlook is excessively bullish sentiment. Mark Hulbert attributed the market’s air pocket to a simple case of too many bulls. He pointed out that his Hulbert Stock Newsletter Sentiment Index (HSNSI) recently rose to a high of 62.5%, which was at the 91st percentile of the distribution of daily HSNSI readings since 2000.

Once HSNSI starts to drop from these crowded long levels, it doesn’t stop until it becomes oversold and fear creeps in.
The typical pattern is that, once the HSNSI rises into this zone of extreme bullishness, it drops significantly. It often falls back to the 10th percentile or lower. The threshold for that zone of extreme bearishness is minus 2.7%, a reading that would indicate that the average timer is allocating 2.7% of his short-term equity trading portfolio to going short.
We’re far from that now. In the wake of Thursday’s plunge, the HSNSI dropped back just to 53.6%, which is still at the 77th percentile of the historical distribution.
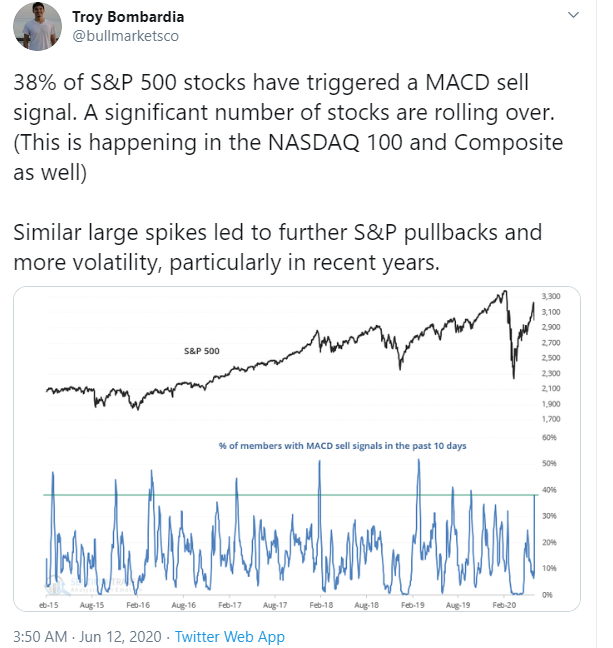
Troy Bombardia concurred with Hulbert’s observation about bearish momentum by pointing out that the recent bullish momentum evidenced by the numerous recent breadth thrusts have been negated by bearish momentum. Market breadth is rolling over, which has historically been bearish, and this development has the potential to negate the bullish effects of the recent breadth thrusts.
John Authers of Bloomberg offered another explanation for Thursday’s pullback, namely the perceived declining fortunes of the Republicans in November. The PredictIt odds of Trump winning the White House, and Republican control of the Senate have been falling rapidly.

These are not market friendly outcomes for equity investors. I wrote last week (see What would a Biden Presidency look like?) that investors should pencil in about a $10 drop to S&P 500 2021 earnings from the unwinding of the 2017 corporate tax cuts. Goldman Sachs produced further analysis indicating that the secondary effects a Democrat win, such as rising minimum wages, the imposition of a minimum corporate tax, and so on, has the potential to add another $10 cut to 2021 earnings.

None of these developments are intermediate term equity bullish.
Bearish tripwires
Where does that leave us? The weight of the evidence suggests that this is the start of a deeper correction, and not just a hiccup in an uptrend. From a trader’s perspective, however, I am inclined to give the bull case the benefit of the doubt until most of the following bearish tripwires are triggered.
- Violation of 200 dma support.
- Violation of the rising trend lines formed by the different A-D Lines, and the high beta to low volatility ratio.
- Weakness in the relative performance of high yield bonds.
- The 10-year yield violating support at 0.6%, and an upside breakout by the USD Index through the falling trend line.

Despite Friday’s relief rally, short-term breadth is very oversold. The stock market could rally further early in the week, though there are no guarantees that an oversold market cannot become even more oversold.

My inner investor is neutrally positioned, though he is leaning towards a bearish intermediate term outcome. Subscribers received an email alert on Friday indicating that my inner trader had initiated a short position in the market. While he believes that the intermediate term path of least resistance is down, he is open to all possibilities in the short run, and he is waiting for the triggers of the bearish tripwires before becoming more aggressive on the short side.
Disclosure: Long SPXU
I believe Cam’s associative arrows in the HB/LV chart are not correct. A bump on the HB/LV corresponds with a rise-bump on the S&P. The confounding point is the low of the HB/LV that is earlier than the low of the S&P. However, bear in mind that the same applied to the VIX, which started retreating before the low, and in fact very close to the low on the HB/LV. The arrows should be straight up.
Another comment is that Friday’s action resembles a dead cat bounce after the rate and extent of the fall. If so, we will be left in no doubt tomorrow.
The graph you are referring to has been published several times before. The arrows should point to same point in time, that do not do so. The graph would look different if the arrows refer to same point in time between HB and LV (the arrows will be perpendicular to the x axis, if this was redrawn).
Perhaps Cam will redo these lines. Thanks.
I apologize. I had saved the chart on stockcharts but the positions of the arrows changed when they re-scaled the chart. Arrow positions will be corrected the next time the chart is published.
Thanks.
If there’s one thing we’ve learned about the 2020 market – it’s to expect the unexpected.
I have a question to the members of this platform:
Since year 2000, the US Federal Reserve has engaged in profligate money printing. Are there historic precedents to this, or are we seeing a new paradigm?
Historically, massive money printing took place during Third Reich, in Germany. That said, what happened then is not a good analogy to what we are seeing now (you all know why the analogies do not hold true). The aftermath of such money printing by Germany is well known, but again, war time Germany is completely dissimilar to today’s events.
I do not now of other such episodes of money printing.
Yes, history is full of it, according to Ray Dalio. Link provided on this forum a few weeks ago. Here is another: https://www.linkedin.com/pulse/big-cycles-over-last-500-years-ray-dalio/
1. So, how much money was printed by the Dutch (as an objective measure, say % of GDP)?
2. Did the British print money? It appears that the British were impoverished by WW2 and loss of colonial revenue that led to profligate borrowing, sale of British gold reserves and devaluation of the Pound. But how much did they print?
Ray Dalio writes a good history of currency but is light on actual numeric detail. All what he has written points to gold as the ultimate standard bearer.
D.V., I think QE during the Obama years was a new phenomena from the Fed. It was implemented (in my opinion) to prevent another economic downturn because of the wrong headed economic policy of the time. It was phased out a year or two before Trump took the helm and the Fed then started raising (normalizing) rates, but apparently too fast as it slowed the economy when Trump went to work on China trade. And then along came Covid and here we are back in QE (by another name) and Congressional stimulus on an even grander scale.
Wally, there is an ever increasing QE (or budgetary deficit), starting from Y2K. Check out how much debt the US has racked up. I have rhetorically drawn a line in the sand at 50T. We are under 10 T, so far.
The numbers will stop making sense at some point in time. I used to refer to 1 T as a line in the sand. Today, I will use 10 T as the land in the sand.
With every 10T, we buy less GDP growth globally. The goal is to restore a “normal risk cycle”. A normal risk cycle indicates profits without help of the central banks. Without central bank stimulus, we will have guaranteed negative GDP growth, and a 1929 style depression at the least. Like a stupid fool I believed that QE would work. It has not, in the last decade. We are now in a second decade, with expanded QE.
So, at some point in time, fiat currencies will lose their appeal and hard assets will hold value (gold, real estate and stocks). Read the book When currencies die that describes what happened at the time of the Weimar republic, if you want to gain a better insight into these ideas.
Ray Dalio’s missive posted today about the same idea how empires die and currencies collapse. I have mentioned on this forum that stocks should be a small part of ones net worth (the rest in bonds, gold, cash and income producing real estate). Download the free book by Meb Faber titled Global asset allocation and be convinced about what I am saying and then we can discuss.
https://www.amazon.com/dp/B0042JSRU0/ref=dp-kindle-redirect?_encoding=UTF8&btkr=1
I called my financial adviser in year 2000 on the day when gold was 266 $ per oz. This person dissuaded me from buying gold! I shall let you do the rest of the research on this. Gold is around 1730 $ per oz, today, give or take. No, I am not a gold bull!
I am not trying to convince anyone to follow what I do. I can only refer to the readers of these forum to resources that make sense to me. That said, I have shared on this platform, what I have found has worked for me!
I find Cam to be an excellent analyst when it comes to stocks and that is why I read his posts very carefully. That said, I am very careful about how much of my net worth is in stocks (ones personal house is not an investment asset BTW).
We are witnessing a speculative bubble of historic proportions that is reaching a peak. Here is the statistic that is so revealing.
Sentimentrader.com reports that 21.4 million more call options than put options we opened last week. One call option equals 100 shares of stock so that equals over two billion shares. If we guess at a average $50 stock price (many indexes that are popular are over $100) that means they went net long ONE TRILLION DOLLARS in underlying shares last week.
That is the NET number so the long only call position is higher.
This was double the pre-Covid high which is much higher in 2020 than previous years. This is reaching absurd peaks.
There are internet ads out there about how you can make big bucks trading options. Seems that traders have found it so easy to profit in shares in this big rally from the March 23 low that they are now going to the easy gravy train of option trading. That’s like going from grass to crack.
Even scarier is the area of ‘naked put trading’. Go to Youtube and do a ‘naked put’ search and see the aggressive tutorials. Naked put trading has unlimited loss potential and when your stock falls, margin calls will eat up your money fast. This causes forced margin selling.
I know a fellow who was doing naked put strategies going into 2008 GFC for family and friends. He made 20% a year easily and predictably until the crash and then literally wiped out everyone’s savings. His mother and father-in-laws lost their retirement fund. Selling a one month $35 put option for 50 cents on a $50 stock seems a safe bet but a one in a hundred year trading statistical anomaly that option models are based on, keep happening every ten years and the stock falls to $30 and you get wiped out. Game over.
Many people thought the Robinhood small gambler traders couldn’t push around the markets but the switch to option trading amps up their impact hugely. It also means they will be history sooner than later.
There will be books written about this.
What is the probability that you think, your above conjecture is going to be true?
I am not being critical nor rhetorical, but just humbly asking this question.
The probability of these day traders losing their money and giving up is about 99%. One percent of them will succeed being either lucky or become legendary pro traders with a lasting career.
As they lose their money, their impact will fade and daily swings will moderate. Traders are usually a positive influence on stock prices because they buy rather than short more often. If they’ve pushed markets higher than they should be, then as their trading capital is lost, markets will go back to where they should have been (or even lower if they overshoot as is typical)
I hope that answers your question. Thanks for asking.
Your reply makes your perspective more meaningful and clear. Thanks.
Ken- IMO, you should preface statements like ‘we are witnessing a speculative bubble of historic proportions that is reaching a peak’ by saying it’s your opinion. Perhaps it’s an expert opinion, although I have no way of qualifying the use of that adjective.
No one is able to forecast market moves with any precision. That’s the nature of the beast. The market is highly unpredictable. In fact, the general consensus of market analysts who have been around a long time seems to be ‘the older I get [and the more I learn about the markets], the more I realize how little we really know/ understand.’ That quote is true for just about everything in life. We’re all humbled by how little we really understand, and how often we’re wrong when trying to make predictions.
As recently cited, John Hussman spent years fighting a bull market by proclaiming asset values were inflated. Perhaps they were, and perhaps even more so today.
Will there be books written about the Robinhood phenomenon? Sure – very likely. An enterprising author has probably already started one. Completely unpredictable, however, are the contents of the 90% of chapters yet to be written.
We don’t know the outcome of this story. No one does.
There were books written about the dot-com crash, about the GFC, and the housing crisis. They were all written after the fact. It’s premature to draft endings ahead of time.
Big unbalanced put-call options positioning always results in dealer flipping to opposite direction. The reason is very simple. Collectively dealers have finite resources and their delta and gamma hedging will reach risk parity point and they need to protect and profit themselves. There is no way they are willing to lose money all the time.
Last Thursday is a good example. Overnight gap down killed bunch of call options at open, and then the hunting down throughout whole day triggered all sorts of stop orders and margin calls. Simple as that. I don’t buy media explanation at all. Nonsense most of the time. When there is big money involved close to option expiration, we need to sit up and pay attention. Watch money flow is more important than anything you read for free. It is useless because it is free.
Finally put selling strategy is the lowest risk you can find, and the second is strangle selling. If you plan it right and stick to it you will enjoy 90%+ win rate. People failed at this because they don’t do their math right or they forget the risk control. Why these two strategies are so attractive? Because you will ride the coattail of the dealers and you become part of the house. House always wins. When you buy options you are fighting against dealers. They have all the tricks to kill you. If I can buy a life insurance policy on you, I will make sure you cease to exist. If I bought a CDS contract on Lehman Bros from AIG, I will do everything to kill Lehman Bros and make AIG survive. This is how brutal the Market is. Do anything you can to align with dealers, with prevailing trends, and with secular changes.
Ingjiunn
Thanks for the tip. So how does a retail trader align with the house? Thanks.
Ingjiunn, Great comment. I know another fella who has build a trading system based on ticker tape and order flow. How do you get data on the order flow? Do you know who shares trading strategies based on order flow?
I assume that the money flow you refer to is the same as the order flow.
I guess the best way for a retail investor to align with the house is to write options.
or futures.
or futures. Yes, already made money in the futures market, today.
Nice!
I thought of Writing options as Ingjiunn made reference to individual businesses. Probably, the easiest way to align with the house is to write options on specific tickers.
https://www.collaborativefund.com/blog/why-were-blind-to-probability/
It is time to define the idea of a pull back or a rally in terms of “probabilities” and not in term of binary outcomes.
So, when a person say, I expect that the S&P 500 is going to drop by 10%, and one should short the market, that person needs to define that probability. Most “experts” do not do so.
This is one of the biggest follies of Wall Street.
So, can we define that there is a 100% probability of 7% return in S&P 500 in the next 2-3 decades?
Or, can we restate the above statement by saying the S&P 500 will produce 2-3% real yield in next 2-3 decades, with 100% certainty?
I hear you. We’ve all watched personalities on CNBC make calls along the same lines – ‘We’re targeting SPX 3000 for the end of this year.’ ‘We see 15% to 20% downside over the next few months.’
Where do the numbers come from? Many of them may have research teams running computational algorithms that arrive at probability distributions that these guys distill into single numbers during live interviews – but I suspect it many cases it’s comes down to little more than pulling numbers out of a hat. They all know the historical averages, of course. But to predict performance this summer or next year? It’s unreal (and they know it).
Why don’t they just say ‘I don’t know’ and leave it at that? Well, then they wouldn’t be quoted in the media or appear on TV.
Have you ever seen Jim Simons or Ken Griffin on these types of programs? Now that Dalio is everywhere you know his funds are not doing well. Ditto Buffet. People doing well consistently do not need to do a thing and people will study them. People on financial TVs are either making money by talking nonsense (these people are not managing money) or their funds are not doing well if they are managing money. Why waste your precious time watching these shows?
Please send some links. Thanks.
Haha – I agree that the quiet guy in the back is usually the one who does best! I don’t spend a great deal of time watching CNBC or reading Marketwatch opinion pieces, but I try to do at least some b/c it helps me discern/ understand crowd psychology.
Dalbar does a deep dive every year into investor results holding mutual funds and has found a very consistent underperformance of investors of almost 5% per year. This is behavioral. People buy too much at the peaks of market cycle and sell or buy less at the bottoms.
Here’s an interesting stat. If you analyze the top ten year mutual fund performer, you will find that the average owner has lost money. It goes like this. A fund starts small and gets a great track record. Investors pile in near to top and then the fund goes down. So a fund that has done 30% on average over ten years including a correction of 25% in the last year makes the average holder a loser.
All this to say, if the raw S&P 500 gain in the next twenty years is 7%, the average investor will not keep up to inflation.
BTW, some of the most intelligent investment management firms are calling for flat US equity returns over the next ten years. That means a big negative return for most folks as their biases lead them astray.
Therefore to make a decent return, we have to asset allocate successfully by overcoming our natural biases not falling victim.
The probability of average investors falling victim to their behavioral biases is 100%.
Our brains were not built for stock markets.
That’s exactly why the vast majority of investors should stick with low-cost index funds and refrain from trying to beat the market.
Not only do actively-managed funds fail to outperform – they charge higher fees which immediately takes a bite out of an investor’s annual returns.
Ken
Based on Professor Robert Shiller’s ideas on Behavioral Economics, what you are saying is correct.
That said, I remain unsure whether we get a 50% pull back in the S&P 500 going forward, and if so in what time frame and the probability that something like this would happen.
So, is there a 100, 80 or 60% probability of a 50% pull back in the S&P 500? If I put an infinite time on this previous statement, there would be 100% probability that a 50% pull back would happen. That is why it it important to put a “time frame” with a probability of loss (or gain). Tough to answer.
Ken
I quote you
“All this to say, if the raw S&P 500 gain in the next twenty years is 7%, the average investor will not keep up to inflation”.
Please read my second statement. I shall repost my second statement for you;
“Or, can we restate the above statement by saying the S&P 500 will produce 2-3% real yield in next 2-3 decades, with 100% certainty”?
My second statement takes care of inflation (this answers your question). My second statement puts a probability metric and also puts a time frame.
Putting a time frame and a probability metric is hard. Again, Wall Street does a poor job of this (to RxChen’s point).
D.V.- The only two ways I can think of to beat inflation via the markets are:
(a) Invest in the stock market (which has been shown to beat inflation – often by a great deal – over extended time periods).
(b) TIPS.
‘beat or MATCH inflation.’
Rxchen2, please do not believe TIPs will give you inflation protection. Why?
TIPS is a US government indexed product and the US government has under measured inflation for a long time. I will let you do the research on this idea instead of trying to convince you about this idea (it is not my job to convince you of anything).
There is a lot of research on this idea what I am alluding to. There are better ways to protect against inflation (like stocks, gold, farmland, art work, income producing real estate that protect against inflation).
TIPs follow a government define benchmark (CPI/PPI/Core CPI). Give me a break. See my comments on gold above and run the numbers.
Hey- thanks for the info. I’ve never really looked into TIPS, and just kind of assumed the product was designed to keep up with inflation. Perhaps someday they’ll design a TIPS+ designed to provide true inflation protection?
This sounds like a number of investment in mutual funds that I invested in the past.
Which validates somewhat the thesis that investing in boutique start-up fund manager in its early years (who were behind the stellar performance of some well-known larger funds) have a much better chance of meaningful out performance.
True. Buying funds that have had a huge runup can be too late. Plus the size of the fund gets too large. Early on a nimble manager has great returns with small money. Big money is harder. Witness Berkshire.
I think any certified financial planner worth his salt would provide more or less the same advice to Boomers.
1. Have three years of living expenses in cash/ CDs.
2. Pay off your mortgage.
3. Set aside $250k per spouse for future medical expenses.
4. Consider long-term care insurance. Alternatively, set aside $250-500k per spouse for future LTC expenses.
5. Diversify your retirement accounts using low-cost index funds and/or bond funds. Don’t attempt to time the markets.
6. Have an estate plan in place.
If you want to play the markets – set aside 10% to 15% of your retirement accounts and have some fun.
Cam- You do a great job with your balanced approach. I appreciate hearing both the bull case and the bear case with each post, and also the fact that you arrive at a decision each time – even if it’s to remain on the sidelines.
100% agree.
https://www.yahoo.com/news/fauci-says-us-might-not-143928343.html
Interesting statement from Dr. Fauci who is a true expert in this field. If this were to happen (i.e. no Covid second wave), what happens to the stock market?
https://www.barrons.com/articles/the-u-s-is-headed-for-a-messy-china-divorce-without-a-plan-51591807403?siteid=yhoof2&yptr=yahoo
Now this, as though an unforeseen pandemic was not enough. This is a grey swan, with the potential to become a black swan IMHO. Reimposition of higher tariffs is what may be the first salvo in this new war against China.
D.V. – Personally, I think tensions between the US and China will persist for many years, if not many decades. The cultural and political differences are so great that it will take more than a generation to fully recognize/ appreciate what they are, let alone begin bridging the gaps.
However, friendly relations free of animosity is acheivable. It’s been almost 50 years since Nixon’s diplomatic overture (one of his truly great accomplishments), and things have come a long way. Just don’t think it happens in my lifetime.
There is political rhetoric behind the anti China rhetoric. I just do not know how much is rhetorical and political and how much is truth.
Should SPX fail to hold 2985 it will probably test the 2913 breakout. Came pretty close via the ES_F ~2923.75.
Beautiful opening selloff. It needs to be convincing in order to shake people out.
Traders are sophisticated. If declines are not truly convincing, who would sell? I think the volatility continues for at least another week to grind out the diehards. It almost requires a buy-and-hold mentality to ride things out.
Cam – My family loves Vancouver so much that we’ve visited every other June since 2002. This year of course it won’t be possible. We had originally planned to fly up today!
One of the world’s great destinations. We love the Anthropology Museum at UBC, the vast array of ethnic restaurants, the Sea to Sky up to Whistler. Probably the only place I would consider living outside the Bay Area.
Take the ferry over to Victoria Island some time you are there.
Did you mean to Victoria on Vancouver Island? 🙂
LOL Probably. It was a long time ago!
Thanks, Wally. Yes, beautiful.
Watch out for Bigfoot though. The woods are thick and deep. LOL
Good Chinese food too. Also cheap sushi.
You’re the king of one-liners, Cam!
Try finding good Chinese food here in Texas. It’s next to impossible.
Love Vancouver. Went there to take an Alaska cruise last year. Found some flavorful, fresh foods that are hard to come by in the US.
Trading isn’t all fun and games. I’ve personally seen these situations occur myself.
https://www.marketwatch.com/story/finance-isnt-worth-losing-your-life-over-the-heartbreaking-story-of-a-rookie-trader-who-racked-up-700000-in-debt-2020-06-14
Back in the Nineties Schwab was the go-to broker for day traders. Electronic transfer of funds wasn’t yet a thing, and every month or so I would go in to deposit funds into a trading account. I’m an early bird, and invariably there would be a guy in line waiting for the doors to open – bedraggled and unshaven. There’s a fine line between day trading and gambling – and gaming addicts have been around for centuries.
Gambling is an addiction. But I’ve seen people who aren’t gamblers blow up over 10 times their account size. Believe me, that is very ugly and difficult to handle.
You’d have to convince me they aren’t gamblers.
I’ll tell you a story. In the Eighties, I got it into my head that Wall Street might be an exciting career. I went back to school and earned an MBA in Finance from Michigan. I really got into the whole Modern Portfolio Theory and the Capital Asset Pricing Model thing. I spent evenings at the local bars with classmates intent on becoming ‘arbs’ at GS. I spent a summer immersed in the culture. You know what? I decided it wasn’t my kind of culture – and the post ’87 depression on the Street kind of validated my concerns. What it comes down to in many cases is this – gambling with OPM (other people’s money). Many classmates went on to very successful careers, of course and we stay in touch. Not once have I regretted walking away.
That would be difficult as nearly every trader has a certain amount of “gambler” in him/her. Several decades ago, one account I was handling for a friend on vacation (a futures account) blew up when the customer got himself locked limit against him for several days. The regional commodities manager for the firm (I wouldn’t touch handling this) said the traders would let him swap out of the current month so he could liquidate but the manager would have to execute on the phone with two exchanges to make the trade. The manager cost the customer an extra $100,000 as the market moved as he made the trade. The customer only had a $25,000 account. Wound up costing him north of $300,000. He had expensive services to tell him what to trade, had a Bloomberg terminal, RT quote charting services, etc. I hear that was his last foray into the futures market.
Wow. Yes, you Texans go big on everything 🙂
Cam, should I still expecting a measurable new low or is the probability of that all over now and I should now go long and learn to live with the volatility (very stomach churning) – given that I am not really interested in trading as rx seems to be?
Good to have you back, Joyce.
Aside from being in your dog house, I hope you’re holding up well 🙂
If you’re not interested in trading, then I think Cam’s Trend Asset Allocation Model is appropriate. Yes, I enjoy trading – but I’m currently out of trading (tactical) mode because the 2020 market is teaching us the game is different this year – as Walter Deemer recently put it, we are watching a precedent unfold in real time. At least for me, that’s too hard to trade. In addition, I’m not interested in being sidelined in cash – the upside risk is too high.
I trust Cam’s judgment. He acknowledges not having all the answers, he’s not afraid to pull the trigger one way or the other under uncertain conditions, and he admits when he’s wrong.
I distrust the vast majority of market commentators, for one or more of the following reasons:
(a) They have no skin in the game – but love to give opinions on TV. A subset would be prominent economists, finance professors, or Wall Street media types with strong credentials in their respective fields – but no trading experience!
(b) They manage other people’s money for a living. ‘Nuff said.
(c) They sell fear. Let’s face it – fear sells! Basically financial salesmen out to scare you into letting them manage your money.
I should add re (a), (b), and (c) – a few like Druckenmiller have enough self-confidence/ humility to admit when they’re wrong. Most of them simply let their wrong calls fade into the sunset and (correctly) assume that viewers/ readers will eventually forget about it.
This is a game where we will often be wrong. There are no expert forecasters – it helps to open each trade (as Paul Tudor Jones likes to say) assuming you’ll be wrong. Then you’ll have a good exit plan.
I’m not really back – I am seriuosly thinking of leaving permanently. The calls have bee so off the mark. Completely missed the 35% to 40% upside move from mid to late March. A few tepid short calls which should have been long calls.
I have followed Ciovacco for years and he presents significant evidence to support his calls, and every body was gob smacked when he spun from bearish to bullish in early to mid April. But he stuck to it and has bee right.
So why haven’t / don’t I follow his advice? Because I respect Cam’s advice as a counterweight and the world does seem crazy, so I sit on the sidelines – dabble a bit (and mostly lose), revert to cash and worry.
Not having any fun at the moment. :(.
Being honest with yourself is an xlnt starting point. You’re probably already ahead of 80% of market participants.
1. You haven’t missed anything. So what if you missed the retracement rally? As I recall, you bypassed most of the downside as well, based on Cam’s call.
2. Try a portfolio approach. Spice it up a little using Cam’s trend model. Here’s an old article by someone else I trust – Paul Merriman:
https://www.marketwatch.com/story/why-market-timing-doesnt-work-2013-10-23
3. When the ES hit 2923 overnight, it was essentially a -10% pullback from the recent high of 3233. Personally, I think that’s enough to launch an attempt at a higher high. JMO. If you open positions here, you’re probably opening/ reopening below where you last exited? May be worth a shot.
4. If the SPX hits let’s say 3600 later this year or next – will you care that you encountered a little volatility in the summer of 2020?
As a reminder – the reason I prefer to be ~fully-invested during an uptrend (and it still appears to be an uptrend – and even if it isn’t someone recently pointed out markets go up 85% of the time/ and odds improve with longer time frames):
(a) Most of the moves occur overnight.
(b) Most of the gains are captured over a very few number of days each calendar year.
Basically, being an optimist pays off over most time frames.
Re Merriman’s article – despite not recommending that the average investor attempt to time the markets, note that he uses market timing himself (limiting it to 50% of his own portfolio, which he [rightfully] claims gives him peace of mind!). So hedge your bets. Put 50% into straight buy-and-hold, and let the other 50% swing with Cam’s calls. That might make you happier, if not altogether happy 🙂
Last comment. Here’s an article written by Ritholtz’ market strategist back in February. IMO just brilliant
theirrelevantinvestor.com/2020/03/18/when-is-the-right-time-to-buy-stocks/
Excerpt:
‘Looking through this, one thing is crystal clear to me. It doesn’t matter when you buy, only THAT you buy.
‘If you’ve been sitting in cash and want to buy but are worried that stocks will go lower, then break up your purchases. The math behind lump sum over dollar-cost averaging has been settled, but this is a time where emotions matter more than spreadsheets.
‘What’s critical is that you don’t just make mental plans to get back in, you have to write them down. For example, “I will break up my purchases into four tranches, the first Wednesday of every month for the next four months.” Whatever it is, it doesn’t have to be rocket science, it just has to exist. It’s also worth saying the obvious, which is that you don’t have to have 100% of your portfolio invested in stocks.
‘One last chart I want to leave you with is a long-term look at the Dow. Bear markets all have one thing in common, they end.’
I hear you Joyce. I’m a terrible trader or an incredibly unlucky trader if I’m trading my own money. I was daytrading about 20 years ago and couldn’t buy a winning trade. I would stop every few days and re-analyse what I was doing but it seemed no matter what I did, every trade was a loser. This went on with a very small account trading the ES, it was much much smaller back then with less than $2,000 initial margin, until I had donated over $30K to the market Gods. I then just stopped cold. I haven’t traded money in my name alone since.
Cam is the only guru I trust. I trust his methodology even though it’s having some trouble right now but that’s happening to everyone I’ve read about lately.
I’ve watched a few of Ciovacco’s videos. They bore me to death and at the end I say to myself, what did he say? Most gurus have awful track records if you really look at them. If you look at their winners/losers/drawdowns you could never follow them for long. If you can’t find someone your style is compatible with you should just buy low fee index funds and find a weekly hedging/rebalancing strategy stop playing the game. Most players are losers in the end.
“They bore me to death and at the end I say to myself, what did he say”?
Lol.
Joyce –
Thank you for your kind words.
To be fair to Chris Ciovacco , his main tool is a trend following model, which are late both at tops and bottoms by design. Trend followers will never spot the top or bottom – that’s a feature and not a bug.
It is therefore not surprising that Ciovacco has not performed well in these kinds of choppy markets that turn on a dime.
Joyce, if you’re frustrated with what you’re doing, then perhaps it’s time for you to try out a new approach. What I wrote about here is certainly not for everybody, but it works for me:
https://seekingalpha.com/instablog/831554-martin-schwoerer/5429240-corona-resistant-strategies-might-well-be-profitable-for-rest-of-2020
As I said before, we don’t know the strength of an uptrend until it gets tested in a pullback. We are now undergoing that test, and the S&P 500 has successfully held the 200 dma – for now.
The next test for the bulls is whether it can come back and fill the island reversal gap.
https://www.cnbc.com/2020/06/15/the-fed-says-it-is-going-to-start-buying-individual-corporate-bonds.html
Don’t fight the Fed?
Yep!
I had asked Cam the question what is the Fed allowed to buy and he told me scrips that are underwritten by US and State governments.
Now, the Fed is buying individual bonds. When would it buy stocks? Would it buy non-US stocks? So, is IBM an “American” company?
I read an article that the Fed is using proxies to buy securities they are prohibited from buying. I don’t know if this is true but the stock market sure seems to have a floor when they step into their bond buying operations.
Very interesting Wally. I wonder if “proxies” have leverage associated with it. I wonder if the Fed is eventually moving to buy stocks via “proxies”. This development needs to be watched carefully as it could, just could propel stocks even higher.
Very interesting Wally. I wonder if “proxies” have leverage associated with it. Furthermore, I wonder if the Fed is eventually moving to buy stocks via “proxies”. This development needs to be watched carefully as it could, just could, propel stocks even higher.
Didn’t the government take equity stakes in the Big 3 auto manufacturers during GFC, and don’t they now have warrants to buy stock in airline companies?
The Fed did not increase the size of its facility; it is still at $750B. So, the impact on the asset prices should be marginal, if any at all.
They are just reallocating between the ETFs and individual bonds. I assume the ETF facility wasn’t working well or wasn’t achieving the Fed’s goal.
I don’t know if the word “still” is as appropriate as the word “approaching”, Sanjay.
https://fred.stlouisfed.org/series/WALCL
Sanjay
I see what you are saying. I was myself wondering how many more Trillions are now going to be printed to buy individual bonds, but based on what you have written, guess no more additional money printing.
https://www.marketwatch.com/story/the-surge-in-coronavirus-cases-in-some-states-isnt-part-of-a-second-wave-2020-06-15?siteid=bnbh
There’s an alternative viewpoint/ interpretation for just about any set of data.