This is a market that defines professional career and business risk. Should investors adopt a momentum approach, or maintain caution in the face of valuation and macro risk?
The stock market has recovered from the COVID-19 crash. The NASDAQ has made a fresh all-time high, and the SPX was briefly positive for 2020. Price momentum has been strong, and broad. Analysis from Topdown Charts shows that 74% of countries are now in bull markets.

On the other hand, the macro outlook and valuations are stretched. The market is trading at a forward P/E ratio of over 21. Even with headline CPI at -0.1%, the Rule of 20 is flashing a warning for the stock market.

The current market environment raises the level of career and business risk for investment managers. Traditional investing approaches would call for prudence in the face of elevated valuation and heightened macro risk. On the other hand, if the strong market breadth were to continue, it would mean an investment environment reminiscent of the go-go days of the dot-com bubble, and the Nifty Fifty era. A defensive posture in the face of an investment bubble risks the loss of clients and career damage. Adopting a price momentum approach to investing while ignoring valuation also risks the perception of recklessness that can forever stain a career.
What should an investment professional do in the face of such career risk volatility? There are no easy answers.
During these unusual periods of severe bifurcation between valuation and macro risk and price momentum, the investment professional is forced to make a decision based on what he believes the dominant investment regime will be in order to minimize career and business risk. This amounts to the classic Keynesian investing beauty contest, where investors do not try to determine the winner based on some investment criteria, but based on what he believes other investors think will be the winner.
My base-case scenario calls see a period of “revenge consumption” euphoria, followed by further signs of stagnant recovery. Investors will also have to face the risk of a second wave of infection in the fall, which will result in either another partial or full lockdown that slows economic growth and raises financial stress. Even if the authorities opt to forego a lockdown for political reasons, there may be a sufficient number of individuals who choose to stay home for precautionary reasons, which will have the same effect as a partial lockdown.
Let’s consider how two well-known investors have approached the problem.
The quick bull
One example of a quickly adapting investor is Stanley Druckenmiller, who said on CNBC that he was “humbled” by the market comeback. He initially voiced his cautious view in a May 12 speech to the Economic Club of New York.
He said worries over the corporate debt bubble was what led him to tell the Economic Club of New York in mid-May that the stock market was overvalued.
“The risk-reward for equity is maybe as bad as I’ve seen it in my career,” Druckemiller said on May 12. “The wild card here is the Fed can always step up their (asset) purchases.”
Druckenmiller made an about-face in reaction to the market comeback.
“I would say since that time, a couple things have happened technically. I would also say I underestimated how many red lines, and how far, the Fed would go,” he said.
That Fed stimulus, combined with investor excitement about the gradual reopening of U.S. business, is leading to broad outperformance among those stocks hit the hardest in March, he said. He added that the technical momentum the market has right now, what he called “breadth thrust,” could carry equities even higher.
“What is clearly happening is the excitement of reopening is allowing a lot of these companies that have been casualties of Covid to come back and come back in force. With a combination of the Fed money and, in particular, a vaccine where the news has been very, very good,” Druckenmiller said.
The cautious value investor
At the other end of the spectrum is GMO, which is known as a cautious value investment firm. Its Q2 2020 investment letter declared that it had “reduced [its] net equity exposure in [its] Benchmark-Free Allocation Strategy from around 55% to about 25%.”
Jeremy Grantham explained the firm’s cautious view in terms of past investment bubbles. In the past three major bubbles, they were overly early in two, which created a high degree of business risk.
There are no certainties here. At GMO we dealt with three major events prior to this crisis, and rightly or wrongly, we felt “nearly certain” that sooner or later we would be right. We exited Japan 100% in 1987 at 45x and watched it go to 65x (for a second, bigger than the U.S.) before a downward readjustment of 30 years and counting. In early 1998 we fought the Tech bubble from 21x (equal to the previous record high in 1929) to 35x before a 50% decline, losing many clients and then regaining even more on the round trip. In 2007 we led our clients relatively painlessly through the housing bust. In all three we felt we were nearly certain to be right. Japan, the Tech bubbles, and 1929, which sadly I missed, were not new types of events. They were merely extreme cases akin to South Sea Bubble investor euphoria and madness.
GMO’s cautiousness is justified by the combination of excessive valuation and poor macro outlook.
Everyone can see and feel that this is different and can sense the bizarre nature of the market response: we are in the top 10% of historical price earnings ratio for the S&P on prior earnings and simultaneously are in the worst 10% of economic situations, arguably even the worst 1%!
The firm recognizes that it can be early in its defensiveness, and it is prepared to lose clients and assets because of its investment convictions. Are other investment managers prepared to take the same risk?
The Keynesian beauty contest
The key difference between Druckenmiller and Grantham is time horizon. Stan Druckenmiller is a hedge fund manager who is prepared to pivot on a dime. Grantham positions himself as a long-term investor, and he is prepared to ride out short and medium term bumps in the market.
Both involve high levels of career and business risk in the current environment of heightened uncertainty and volatility. What should you do as an investor?
During these unusual periods of severe bifurcation between valuation and macro risk and price momentum, the investment professional is forced to make a decision based on what he believes the dominant investment regime will be in order to minimize career and business risk. This amounts to the classic Keynesian investing beauty contest, where investors do not try to determine the winner based on some investment criteria, but based on what he believes other investors think will be the winner.
Here is the key short run question that you have to answer. Over the next few months, as we progress into Q2 earnings season, will the market narrative and focus be healing, re-hiring, increased capital expenditures, and low cost of capital, or an unexpected layer of costs to reopen, lower capacity and reduced demand, and continuing uncertainty?
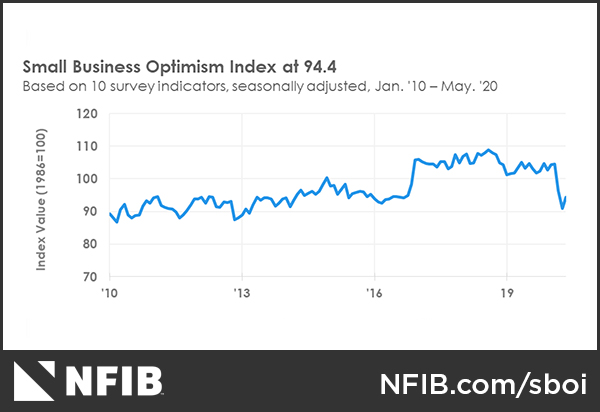
Here is the bull case. The NFIB small business survey is a useful indicator, because small businesses have little bargaining power and their views are a sensitive barometer of the economy. Small business confidence staged a small rebound in May. As well, sales expectations have bottomed and begun to rise from the lowest level in the survey’s 46 year history.
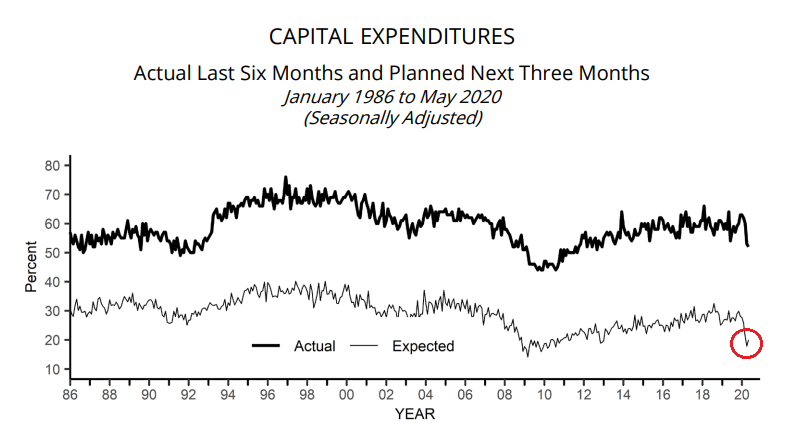
Capital expenditure plans have bottomed and they are edging up.
Hiring plans have also rebounded.

Renaissance Macro pointed out that high propensity business applications, defined as businesses likely to result in a payroll, rose 3.9% year-over-year in May.

A study by economists at the St. Louis Fed of real-time signals from the job market found continued healing in June.
We then repeated the same exercise for the week ending on June 5 to get the most up-to-date reading of the labor market. We predict that the recovery has continued at a healthy pace and employment is now down 8.75% relative to January.

The case for caution
Here are some reasons for caution. In contrast to the healing tone of the NFIB survey, Evercore ISI’s CFO survey (conducted 5/17-6/7) of capex plans for 52 companies is tanking. Capex plans for this year are the worst in their history. CFOs are focused mainly on increasing liquidity, not capex.

The key risk is whether the consensus expectation of a V-shaped recovery in earnings is realistic.

Sure, we are seeing signs of healing and labor market recovery. Investors have to distinguish between the first phase of the recovery, which brings back the workers who are temporarily laid off, and the second phase of the recovery, which will be much slower and could see the economic aftershocks of the crisis. As an example, even if the unemployment rate were to fall by year-end to the range between the Fed’s 9.3% projection and the Congressional Budget Office’s 11.7% projection, the economic pain would still be considerable compared to the recessions of the post-War era.

Joe Wiesenthal of Bloomberg proposed an alternative but stylized framework of flattening the curve, employment style. Investors should distinguish between the gains in employment that return from the mandated lockdown, and the losses in employment from the recession caused by the lockdown.

Recessionary unemployment could be considerable. A University of Chicago Becker Friedman Institute paper estimates that “42 percent of recent layoffs will result in permanent job loss”. A similar study by Bloomberg Economics decomposed job losses into demand and supply shocks, search, and reallocation shocks. It found that roughly 30% of losses are attributable to reallocation, meaning that those jobs won’t return quickly and inflict long-term damage to the employment market.

All of these models are based on the assumption that there is no second wave of infection necessitating either a partial or full lockdown of the economy. Already, case counts are rising in a number of states, such as Arizona, Arkansas, California, Florida, Georgia, Kentucky, Nevada, New Mexico, North and South Carolina, Texas, and Utah, just to name a few. The situation in Houston has deteriorated so much that officials are close to reimposing stay-at-home orders again.

The FIFO China model
How can we resolve these competing narratives? One useful template is to see how China’s economy evolved as it emerged from lockdown. While circumstances are not the same, China’s growth trajectory after its COVID-19 crisis can serve as a useful model of how growth may evolve based on a first-in-first-out principle.
Chinese statistics reveal a bifurcated economy. Industrial production has snapped back quickly.

By contrast, the retail sales recovery has not been as strong.

China is trying to boost its economy through stimulating the industrial sector, mainly through exports. But the global economy is weak, and demand anemic. Reuters reported that May exports were down, and imports were the worst in four years.
Overseas shipments in May fell 3.3% from a year earlier, after a surprising 3.5% gain in April, customs data showed on Sunday. That compared with a 7% drop forecast in a Reuters poll.
While exports fared slightly better than expected, imports tumbled 16.7% compared with a year earlier, worsening from a 14.2% decline the previous month and marking the sharpest decline since January 2016.
It had been expected to fall 9.7% in May.
“Exports benefited from the ASEAN (Association of Southeast Asian Nations) market and exchange rate depreciation, while imports were affected by insufficient domestic demand and commodity price declines,” said Wang Jun, chief economist of Zhongyuan Bank.
While China watcher and Beijing resident Michael Pettis reported some anecdotal evidence of post-lockdown “revenge consumption”, Chinese consumer demand is still weak. If Chinese consumer pattern is representative of what will happen in the US, we are just seeing reports of “revenge consumption” stage, which will be followed by flattening sales growth.

Unlike China, American manufacturers are not going to bail out the economy. A recent Barron’s article reported that exports are weak, and so is the trade balance.

Unless the global economy can recover, exporters will suffer from a lack of demand. Until COVID-19 is defeated, it is difficult to see how demand can recover. The latest fatality growth shows most of the growth is coming from EM countries and south of the equator, indicating a possible seasonal and temperature effect. This suggests that a second wave of infection will hit the northern hemisphere in the fall, which will necessitate either full or partial stay-at-home edicts until a vaccine becomes widely available.

In conclusion, the decision between an investment approach based on price momentum versus valuation and macro risk assessment depends on how the market narrative will develop over the next few months. As we progress into Q2 earnings season, will the market narrative and focus be healing, re-hiring, increased capital expenditures, and low cost of capital, or an unexpected layer of costs to reopen, lower capacity and reduced demand, and continuing uncertainty?
My base case scenario calls see a period of “revenge consumption” euphoria, followed by further signs of stagnant recovery. Investors will also have to face the risk of a second wave of infection in the fall, which will result in either another partial or full lockdown that slows economic growth, and raises financial stress. Even if the authorities opt to forego a lockdown for political reasons, there may be sufficient number of individuals who choose to stay home for precautionary reasons, which will have the same effect as a partial lockdown.
Excellent essay on the choice ahead Cam.
If we don’t want to be dogmatic about the market, how should we position ourselves in this market?
The choices we make at this juncture in the market are absolutely dependent on who we are as individuals – the innumerable factors that define our current needs and goals in life. Cam will make his own decisions – and I’m here to discover what he decides to do, and how he arrived at his outlook/ odds/ risk management. Then I’ll make my own (difficult) decisions.
(a) I think there’s a great deal to worry about.
(b) On the other hand, markets do a great job of climbing the wall of worry.
Perhaps it comes down to gauging the relative impact of each. You’ll find bulls and bears everywhere you look at any point in time. Cam always tries to summarize both points of view.
Investors must ask themselves if they are either ‘relative return’ or ‘absolute return’ investors (don’t lose money priority) either by their personalities or circumstance (age, wealth, health, incomes, dependents).
In twenty years we have had three massive drawdowns (2001, 2008, 2020). Investors that have lived through that roller-coaster ride and stayed invested may be switching to ‘absolute return’. They are older and wiser. I see and hear that among my clients. But I also hear that investment advisors in general are not shifting from buy-and-hold conventional portfolio strategies. This could be why investors are shifting to self-management through ETFs and away from advisory.
After the 2008 GFC Crash, I expected a shift from buy-and-hold but it didn’t happen. Investor who stuck it out had their stocks recover. Will this Covid Crash change investor habits especially now that folks are twelve years older? If they do start tactically selling when stocks are expensive and buying when there are bargains, markets swings will be less. The current rally could be capped.
There is a good chance that investors will abandon stocks if there is another big downswing soon. Japan up to 1990 was a hotbed of stock speculation as markets went to bubble heights. The Japanese mutual fund industry was larger than America’s. As stocks fell in a secular decline, people turned their backs on stocks and deposited their savings in the postal bank at virtually zero interest rates. Their mutual fund industry became minuscule compared to America’s. Their market fell 80%.
People are people and the Japanese investor reaction reflected continual disappointment and not culture. Let’s hope that if we have poor markets over the next year or two that we don’t start down a similar negative momentum path of discouraged investors.
Ken-
Why characterize investors who basically did the right thing by staying the course through three massive drawdowns as now ‘older and wiser’ and ready to switch to ‘absolute return?’ Are you saying the ‘wiser’ move during the past twenty years was to have been tactical? And if so, how many tactical traders actually outperformed their benchmarks over that period?
Wiser would mean that they saw signs of overvaluation and high investor optimism in the past but didn’t shift out of stocks. They instead held on and toughed it out. This time knowing this, they may take evasive action and wait for bargains (or wait for Buffett to act!).
The Boomers are now retiring and they are the biggest stock holders and may be more risk averse.
1. Are we certain that the nadir for bargains didn’t in fact occur on March 23?
2. Signs of overvaluation in certain sectors perhaps – what about worldwide stocks ex-US? Or energy/ financials/ industrials within the US?
3. Signs of overvaluation – yet the 20-year annualized rate of return for the SPX was recently only 3.49%. Hardly a ‘bad time’ to be in the market given a long-term horizon. Not everyone has a short-term horizon.
4. ‘Shift out of stocks/ take evasive action.’ The implication being they will know when to buy back in. Not everyone is (or wishes to be) a market timer.
5. Boomers may be the ‘biggest stock holders.’ They also hold the highest percentage of non-market assets. Real estate. In may cases, defined-benefit pension plans – be they traditional or ‘virtual rollover’ plans. Treasurys and/or high-grade corporate debt. Private equity. Probably three years of living expenses in CDs/ cash. Long-term care insurance. In other words, they are in fact risk-averse, and have diversified appropriately with respect to their stock/ mutual fund holdings.
I should say ‘with respect to their total net worth-‘ ie, they may be fully invested in terms of their market holdings, but they certainly don’t have all of their eggs in that basket.
“This time knowing this, they may take evasive action and wait for bargains (or wait for Buffett to act!)”.
Your above statement indicates an anchoring bias. You have very elegantly written earlier how the average Joe (or Jane) six pack falls for the anchoring bias.
So far the average Joe did not sell out, despite extreme volatility? Does such behavior suggest that the average mom and pop investor would fall for anchoring bias”?
“This time knowing this, they may take evasive action and wait for bargains (or wait for Buffett to act!)”.
Your above statement indicates an anchoring bias. You have very elegantly written earlier how the average Joe (or Jane) six pack falls for the anchoring bias.
So far the average Joe did not sell out, despite extreme volatility? Does such behavior suggest that the average mom and pop investor would fall for anchoring bias” and sell out now, after a countertrend rally?
I’m talking about investors who over the years get more knowledgeable about valuation by reading about markets and expert opinions. Eventually they might come to trust experts that warn of high market risk. Later when markets are low, they might trust expert commentary when they say bargains abound. This isn’t anchoring to prices of indexes.
1. ‘Trust the experts.’ The three most dangerous words in finance?
2. How does one define a financial expert?
3. How many financial experts get it right?
4. Consistently get it right over long periods of time? In other words- how many ‘experts’ have consistently outperformed their benchmarks over long periods of time?
4. *Consistently* get it right over long periods of time? In other words- how many ‘experts’ have consistently outperformed their benchmarks over long periods of time?
5. Investors have indeed become more knowledgeable over the years. I for one am in the camp that would say that ‘opinions’ abound, but ‘experts’ do not. Those who study the markets generally concede it’s all but impossible to beat the market. Real experts also agree they get it wrong much of the time. Would you agree?
With due respect, there is an Ocean of difference in Japan and the US.
If the US stopped innovating, sure, we could see a Japan style, multi decade, persistent bear market.
The US imports smart immigrants, and puts them to work in American Universities with research $s. If that virtuous cycle were to stop, I would bet against the US.
Thirdly, Cam pointed out a few months ago that demographics play a key role. The US is a far younger society than Japan. Sure, boomers are likely to cash out, and sell to the younger people coming behind them. There is no such generation in Japan. With innovation lagging, population in Japan at a zero or negative growth rate, it remains a vastly different society than the US.
When my son was five, we enrolled him in AYSO soccer. I have vivid memories of one practice session several weeks into the season. He bombed two consecutive place kicks so badly the team broke out in laughter. He ran to the sidelines devastated and grabbed onto a chain-link fence so tightly that I had to pry him away. The little guy was in tears and determined to stay on the sidelines! It kind of broke my heart to do it, but I was equally determined that he return to the field, suck it up, and play through the embarassment – knowing there was really no other way out of the situation.
Fast-forward to age ten, and he had developed into an outstanding striker. More than once a ref would come up to us while walking off the field with comments like ‘Hey 22! Great game. You’ve got what it takes.’ Well, that was far from obvious five years earlier. He ultimately went on to play club soccer year-round, and the summer before high school led his team to regional tournament play at StubHub. Kind of broke my heart again when he decided to quit soccer a year later.
What does this have to do with trading?
Nothing. Well, that’s Level I thinking.
Level II says ‘Everything.’
What is trading anyway, and what do we bring with us to the playing field? I think it comes down to 20% research/numbers/indicators and 80% ‘everything else’ (ie, life experience, trading experience, emotions, confidence, reading people/ crowds, pattern recognition, position sizing, risk management, handling setbacks, you name it).
I find inspiration and/or insight just about anywhere. It’s often one comment or one tweet from someone I follow that provides the confirmation I need to pull the trigger, to size up or down, to reverse my decision. It happens all the time. The island reversal at SPX 2500? Many, if not most, of the people I follow missed it. One guy spotted it early enough that I was able to second-guess my take and turn bullish. ‘Gems of insight’ are literally everywhere, and they will have different levels of value at different points in time depending on the needs and goals of each individual trader and the trades they have on. I wouldn’t even rule out off-topic statements or yes – even films and books. Any story, fiction or non-fiction, has the ability to broaden our perspectives, sharpen our understanding of human behavior (including our own!), and inform our trading.
That’s the value of interaction. I enjoy hearing about and learning from the life/ trading experiences of others. I have no doubt that finance professionals will have more knowledge and skills than the ‘rest of us’ with regard to the ‘20%’ (and I recognize that’s an arbitrary percentage that’s based on my personal viewpoint). What makes trading accessible to just about everyone are the highly variable experiences and skillsets that players possess with regard to the other ‘80%.’ When my son gets around to trading, he’ll bring life experiences re earlier setbacks and successes on the playing field with him to the table.
Ciovacco Capital out with another great video today. One takeaway that sticks with me – given the recent breadth thrusts, it’s no surprise that over the past forty years, the NYSE Breadth Momentum Oscillator has only been this extended seven times since 1981>> 1982. 1984. 1991. 2003. 2009. 2012. 2016. 2019. All good entry points. Of course, it would be nice to overlay valuation and sentiment readings over the data for a more nuanced picture.
“Of course, it would be nice to overlay valuation and sentiment readings over the data for a more nuanced picture”.
Your above statement sums it all.
A fair question to ask-> Was Thursday + Friday a retest of the breakout/ uptrend that began in mid-late May? I think the answer is ‘Yes,’ and thus far prices have mostly held and in some cases reversed. Definitely open to being wrong. We’ll begin to find out next week.
Interesting chart from a technical analyst who has been bullish for months now… https://twitter.com/the_chart_life/status/1271834660167958530
Right. The ‘bookends’ scenario occurred to me as well – just seems too cute. I would lean towards ‘head fake.’
Ellen, a bearish outlook on the US dollar:
https://www.bloomberg.com/opinion/articles/2020-06-13/u-s-dollar-s-exorbitant-privilege-is-about-to-end
Stephen Roach has been bearish as long as I have read his missives. What makes him right this time?
Demise of the USD has been talked about for a while now. So far, none of those predictions have been right, none, nada, zip. Why?
Because, there is simply no alternative to the USD.
In the 1980’s US was over 20% of world GDP. We are now less than 15% and dropping. US is only 5% of world population.
https://www.statista.com/statistics/270267/united-states-share-of-global-gross-domestic-product-gdp/
While that may be so, has the USD lost its world dominance? No other currency has the scale or depth as the USD, at least not yet. China is trying FWIW.
Why the US Dollar Is the Global Currency
“Around 90% of forex trading involves the U.S. dollar. ”
“Almost 40% of the world’s debt is issued in dollars.”
https://www.thebalance.com/world-currency-3305931
“As of 2018, the U.S. had $1,671 billion in circulation. As much as half that value is estimated to be in circulation abroad.”
60.89% of the official foreign exchange reserves are still held in USD.
Euro is at 20.54% and Yen at 5.70%.
https://en.wikipedia.org/wiki/Reserve_currency
http://scottgrannis.blogspot.com/2020/06/how-bad-is-national-debt.html
The national debt is approaching 12% of GDP. Usually when it exceeds 5%, the $ falls in value. So far, $ has been stable (probably because all other currencies are weak and the $ remains the one eyed king in the kingdom of the blind).
Thanks for the article.
@jyl087 thanks!
Cam pointed out in an earlier post that before 9/11 the US economy was already in a recession. There was a pull back after 9/11 and a reflex rally after 9/11 and then the final major low in March 2003. The current situation seems somewhat analogous. Going into Covid, market was expensive (economy was not in a recession), but did have a -30% slide. Since then, there is a snap back rally and now we are not sure what happens, whether the economy snaps back, stalls or has a deep slump.
The “revenge consumption” idea makes sense to me.
If no second lock down takes place, the “revenge consumption” continues, with a long “wick” or “tail”.
If the market hangs in here, say at no more than 10-15% below where we are, we may see some effects akin to a “wealth effect”. This may manifest with increasing truck sales or a stable building/housing market or Americans resuming trips to Disney, ball games opening (with increasing ad spending). Ball games may have significant 4K or 8K transmission boosting sales of these TVs, demand for higher band width services, and increasing advertisements on these programs.
Recently, I saw that a RV maker is converting their RVs to home offices (the remote or work from home move may save on costs to US employers through cost shifting to RV “offices”). Just a thought. Autos and Housing are large parts of the economy.
We will need confirmatory evidence that unemployment is slowly coming down.
All of the above may carry us 1-2 quarters. If that were to happen, the game starts to hinge on November 2020 US elections. If Republicans make a come back, there is a fair chance of further tax cuts. Such change in Fiscal policy could well set the course for the next near term post November 2020 stock market.
Yes, there are a lot of unknowns I have listed. Unemployment, discretionary sales and spending, wealth effect and the elections. For now, steady as she goes (the US economy, Lol).
So far as professionals losing their reputation or job or clients, that is not new. FWIW, Jermey Grantham believes in seven year forecasts. Last I checked, a few years ago, GMO was predicting low US returns and very high non-US returns. I have been reading their missives for awhile now (about two decades; time for me sometimes is measured in decades, Lol). I stopped reading their missives, in the past five years. The US stock market has done the opposite of their predictions, so far, since I read their last missive.
The US investment industry has done a very very good job of educating the general public of “staying the course”. Charles Schwab, Mr. John Bogle all are on record supporting this adage. Only time will tell whether these mom and pop investors are the real winners or not (usually they are the losers). Fabled investor Mr. Stan Druckenmiller has admitted to his failure to read the tea leaves. In all fairness, this is one of the hardest markets to judge. Why?
Because of the unprecedented Fed actions that have been unpredictable. Fed action have been unpredictable based on history, however, they are now fairly predictable. The Fed did, and does and will do whatever it takes to keep the bubble from bursting, even if it means printing 50 Trillion $s and taking Fed funds rates into the negative. The US Fed has also talked about “managing the yield curve”. What I think it means is that the US Fed will ensure that the control of the yield curve is taken away from the hands of the bond market (at the present time, the Fed controls the short end, for the most part, but for the most part does not interfere much with the longer term rates; Cam may correct me on that). Here is what I think it means: The 30 year bond may trade today say at 3%, but the Fed may bring the yield down to 2.00% if it wants. In such a case, they may have Fed funds down to -0.5%, so the difference between the two is =2.5%). Had the Fed not interfered in this manner, the difference could have been much higher.
The 50T is just a rhetorical number out of my hat, but you get the point. If “don’t fight the Fed is the be all and end all, then perhaps, we should stop fighting the Fed.
There are two data points I have not checked recently. The amount of money on the sidelines in brokerage accounts (Cam usually does a good job reporting this from Ameritrade, AAII data) The other data that I have not checked recently is the margin credit (NYSE publishes this I think, tough there is one month lag, when published).
There should be plenty of liquidity on the sidelines at present (Cam has shown a steep uptick in cash in savings accounts which usually is seen at market bottoms). The latter may not be a proxy for a “market bottom” but still an indicator that such cash on the sidelines may support the market in the future.
Here is some data on liquidity that Ciovacco included in his latest presentation:
https://twitter.com/crossbordercap/status/1270625594724712449
Will the financial asset prices follow the liquidity as they have in the past?
Other topic:
Joe Rogan Experience #1309 – Naval Ravikant
https://www.youtube.com/watch?v=3qHkcs3kG44
This podcast has 3.39M views, 75K Likes and 8,936 comments. I still have to listen. This has been recommended by a few different folks.
All said and done, next Friday is Triple/Quadruple witch. This is usually accompanied with (downside) volatility, in particular the week that follows.
Cam nailed his short call.
Swing Traders: Pivot Points
The following is based on an SFO article in December 2004 by John Seekinger, titled, “Take a two-dimensional approach.” He offers these tips.
S2 S1 Pivot R1 R2
S&P500 (^GSPC):
Daily 2,934 2,988 3,038 3,092 3,142
Weekly 2,838 2,939 3,086 3,188 3,335
Monthly 2,547 2,794 3,014 3,261 3,480
See the Pivot point of the Daily, Weekly and Monthly numbers, all in the 3K range. This is the failure point I am watching (based on Tip # 2 below).
Here is how to interpret the above:
S = support
R = Resistance
Seekinger doesn’t look at the range of S2 to R2 as support and resistance levels. Rather, he considers them oversold (S) and overbought (R) areas.
S2 to R2 range of values across daily, weekly, and monthly periods: If two values are close together then they lend more significance to the area.
If the market trends on day 1, the odds rise tremendously that the market will be range bound between daily S1 and daily R1 the next day.
In a quiet market when traders are waiting for an important earnings announcement or economic report, look for daily R1 and S1 levels to hold and for the market to return to the daily pivot.
A move outside of daily R1 or S1 usually does not mean a breakout.
The odds suggest that the entire week’s price action will remain between weekly R2 and S2.
Avoid going long when the market moves above weekly R2 (it’s overbought) and avoid going short when price moves below weekly S2 (oversold).
Consider going short at weekly R1 or long at weekly S1 with a profit objective of the weekly pivot.
Consider going long at weekly S2 or short at weekly R2 with a profit objective of weekly S1 or R1, respectively.
http://thepatternsite.com/Blog.html#P15
A few other observations suggesting continued frothy sentiment:
https://twitter.com/MacroCharts/status/1271789418534313985?s=20
https://twitter.com/sentimentrader/status/1271783626737401857?s=20
I’m not sure I buy this counterargument, but presenting it here anyway:
https://twitter.com/McClellanOsc/status/1271555833785024513?s=20