Preface: Explaining our market timing models
We maintain several market timing models, each with differing time horizons. The “Ultimate Market Timing Model” is a long-term market timing model based on the research outlined in our post, Building the ultimate market timing model. This model tends to generate only a handful of signals each decade.
The Trend Asset Allocation Model is an asset allocation model which applies trend following principles based on the inputs of global stock and commodity price. This model has a shorter time horizon and tends to turn over about 4-6 times a year. In essence, it seeks to answer the question, “Is the trend in the global economy expansion (bullish) or contraction (bearish)?”
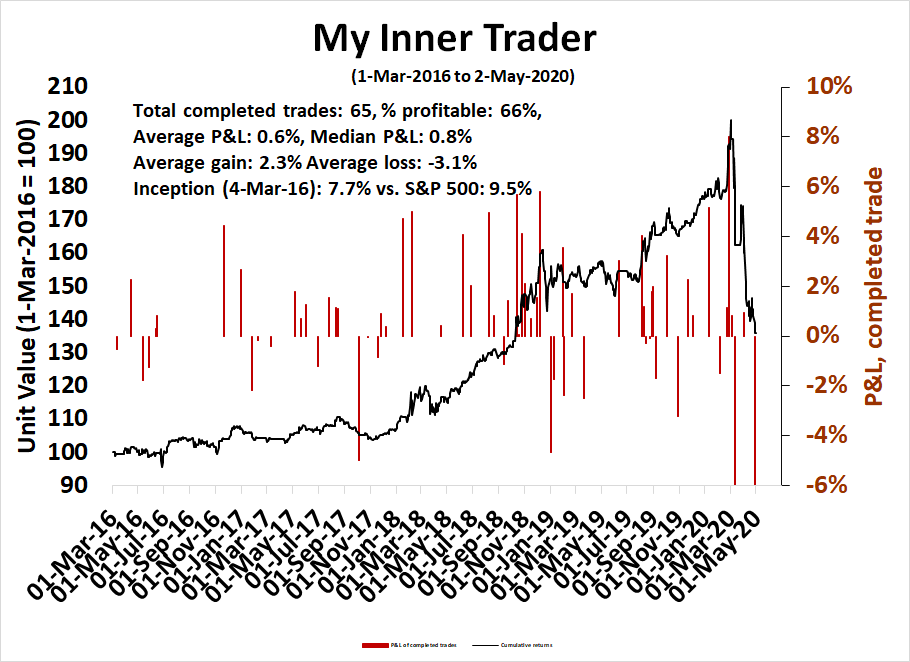
My inner trader uses a trading model, which is a blend of price momentum (is the Trend Model becoming more bullish, or bearish?) and overbought/oversold extremes (don’t buy if the trend is overbought, and vice versa). Subscribers receive real-time alerts of model changes, and a hypothetical trading record of the those email alerts are updated weekly here. The hypothetical trading record of the trading model of the real-time alerts that began in March 2016 is shown below.
The latest signals of each model are as follows:
- Ultimate market timing model: Sell equities
- Trend Model signal: Bearish
- Trading model: Neutral
Update schedule: I generally update model readings on my site on weekends and tweet mid-week observations at @humblestudent. Subscribers receive real-time alerts of trading model changes, and a hypothetical trading record of the those email alerts is shown here.
Buy or sell?
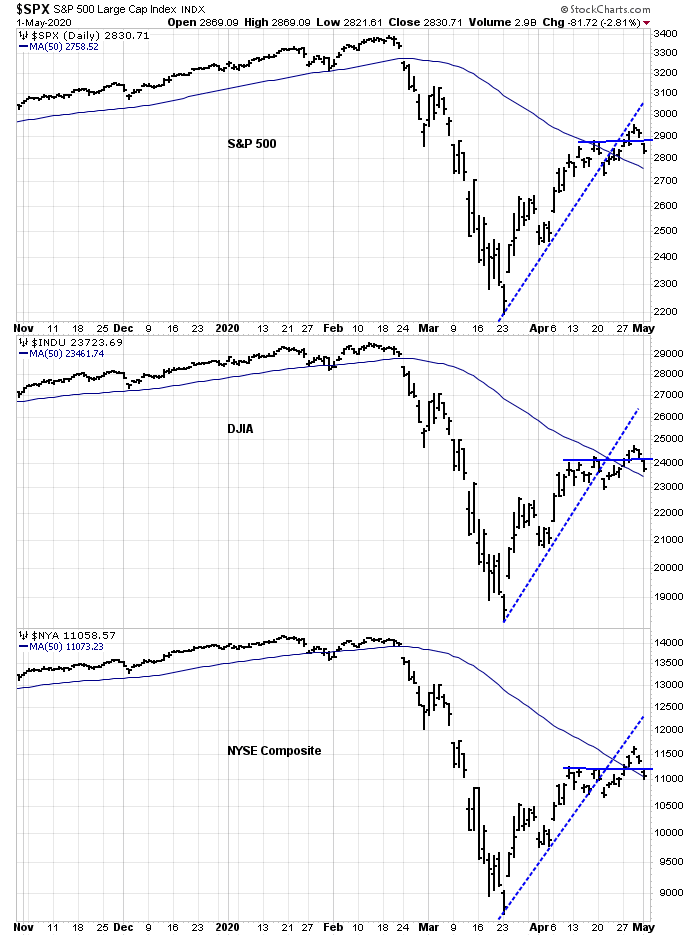
Looking to the week ahead, the recent market action presents a mixed picture. The SPX, DJIA, and NYSE Composite all broke above their 50 day moving averages (dma), which are positives. But they remain under the broken rising trend lines, which are signs that the bulls have lost control of the tape.
Should traders be buying the dips, or selling the rips? Here are the bull and bear cases.
Bull case
Let’s start with the bull case. In the last 20 years, the NYSE McClellan Summation Index (NYSI) has never recovered from an oversold condition without bouncing back to an overbought reading (warning, n=2).

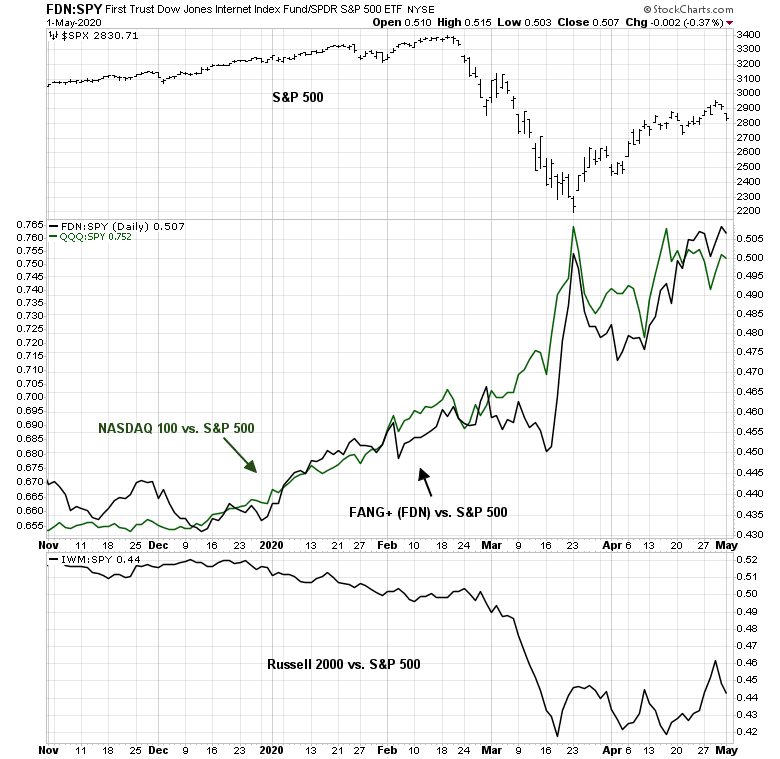
I wrote about the risks of narrow leadership last week (see Factor review: Narrow leadership and its implications). The leadership of the FANG+ stocks have begun to pause, and other groups, such as small cap stocks are starting to turn up on a relative basis. This could be interpreted as a healthy rotation in an uptrend.
The bear case
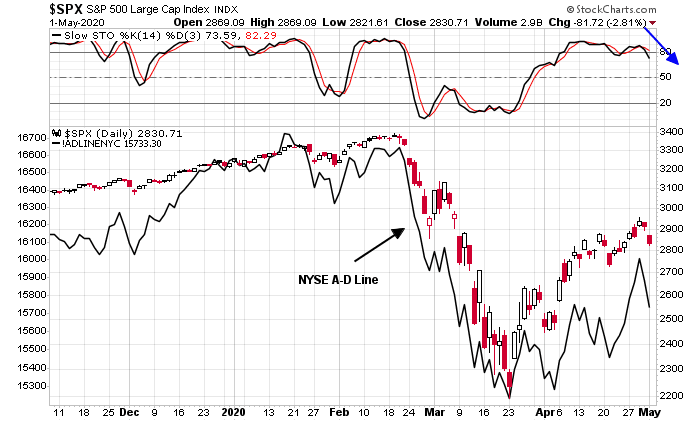
Here is the bear case. The market is exhibiting signs of bullish exhaustion, as evidenced by a possible stochastic recycle from overbought to neutral territory, which is a sell signal. As well, the NYSE Advance-Decline Line has been lagging the market, which is a negative divergence.
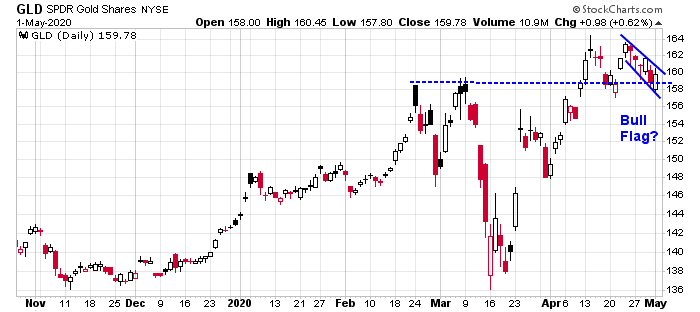
Inter-market, or cross-asset, analysis shows that gold, which has acted as a bear market hedge, is holding its upside breakout. Moreover, it is tracing out a bull flag, which is a bullish continuation pattern.
Bond prices, which are also hedges against equity declines, staged an upside breakout about a week ago. They pulled back and they are holding below their breakout level.
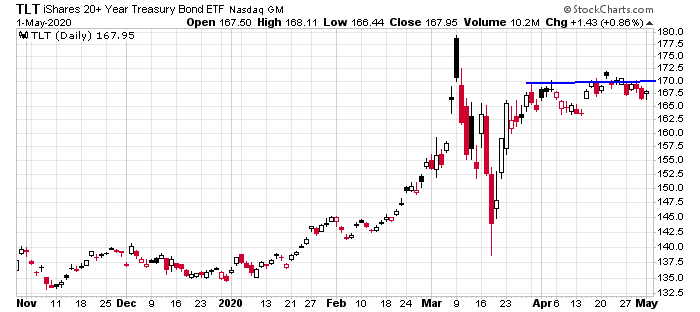
Keep an on on gold and bonds. Bullish breakouts by these assets will represent bearish tripwires for stock prices.
Waiting for clarity
My inner trader covered his short positions last week for risk control reasons. He must have displeased the market gods, because stock prices fell sooner afterwards. Despite the late week market weakness, he is still waiting for signs of clarity on short-term market direction.
Short-term breadth, as measured by % of stocks above their 5 dma, is oversold. Looking over a 1-3 day time horizon, the market is due for a bounce.

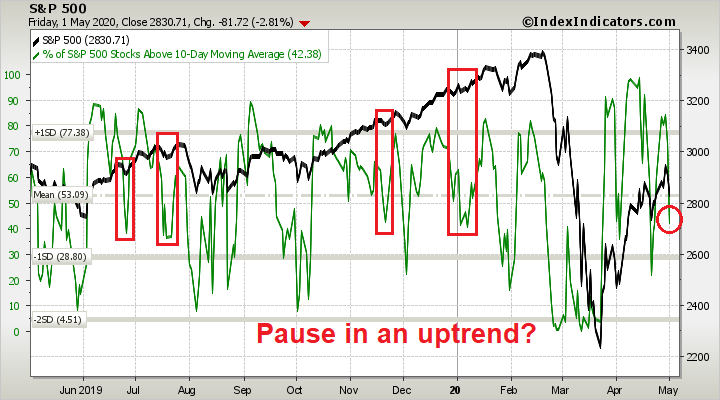
Looking out slightly longer term to the % of stocks above their 10 dma, however, the market is not oversold, and readings are in neutral territory. If the market were to stage a relief rally early in the week, recent episodes of turnarounds with this indicator at similar levels have resolved themselves with further market advances. The weakness late last week could be just a pause within an uptrend.
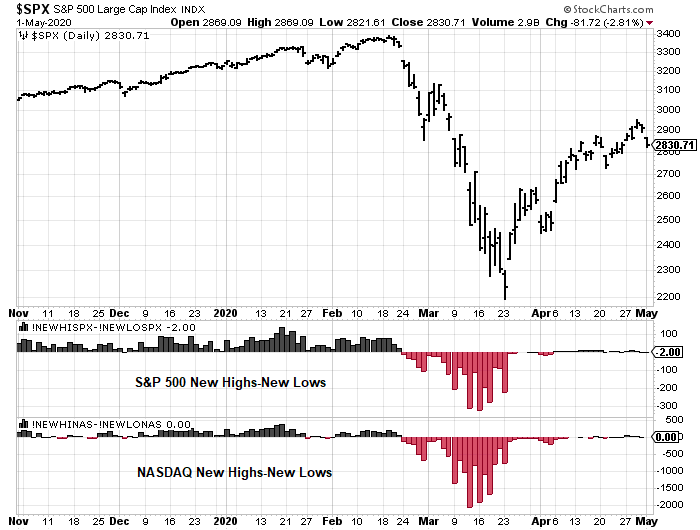
As well, new highs – new lows readings are dead neutral, indicating little momentum.
Sentiment readings, such as NAAIM, are normalizing after falling below its lower Bollinger Band, which has been a reasonable buy signal in the past.

My inner investor remains cautiously positioned. As I pointed out yesterday (see The recovery scenario), turning bullish at these levels requires too many courageous assumptions about how the global economy is likely to develop.
My inner trader remains on the sidelines in cash, waiting for greater clarity from the tape behavior next week. The risk/reward ratio is unfavorable for taking a directional bet at this stage, especially in light of the high level of uncertainty in today’s volatile environment.
Sum Ting Wong in Michigan. Covid-19 death rate at 9.13%.
https://wwmt.com/news/coronavirus/michigan-has-the-nations-highest-covid-19-death-rate
its inevitable without complete test coverage for the infection. Relaxing restrictions will result in more infections.
So let’s look at the initial info that led to the early predictions of mortality rates of 3-4% for this disease. I know the latest calculations as referenced in the Post article are suggesting it MAY be less than 1% but it is important to understand the basis for the initial statistics to appreciate how they have been both inflated and perverted. Mortality is calculated by the fraction that starts with the number of people who have died from the disease as the numerator and the number of people who have contracted the disease as the denominator. For sake of comparison, the typical flu runs around 0.1%.
However, in the initial, and even some of the current calculations, the numbers used for Covid-19 (hereinafter called C19) were done differently than the flu. Let’s start with the numerator, the number of people who have died. With the flu, it is left to the on sight doctor to decide whether a death was due to the flu directly, or caused by some underlying condition. Typically these underlying conditions are the same as what are being called co-morbidities for C19. These are things like heart disease, diabetes, lung disease from smoking, high blood pressure and compromised immune systems among others. As an aside, the one common denominator that frequently leads to multiple co-morbidities is obesity. So even people who do not have consistent access to health care can have some idea of their condition. If they qualify as obese, in the absence of different information from a doctor they should consider themselves as in the co-morbidity category.
Returning to the data, when someone died with the flu, the cause of death was not always recorded as the flu. It was recorded as whatever the attending physician thought was the primary cause, i.e. the various co-morbidities. For C19, from the very beginning, doctors were told that for any case where the patient had C19 the cause of death would be C19. There is no real way to tell how much this increased the numerator relative to the way the flu is calculated but it unquestionably artificially made C19 look worse! This is now common knowledge, yet no one in the media seems to want to ask the medical powers that be, WHY it was done. This artificial inflation of deaths relative to the flu still continues in the latest numbers.
The denominator is even more interesting (if fractions can be interesting!). When calculating flu mortalities, the method for the denominator is to start with the number of people known to have the flu, i.e. people who have gone to doctors and been diagnosed. However, because it is recognized that many people contract the flu with minimal symptoms while others do not seek medical attention or diagnosis, the statisticians inflate the denominator by multiplying the number of people diagnosed by a factor of 3-5 to account for the undiagnosed group. For C19 no such multiplier was used. The denominator was only the people who had shown up in hospitals with serious symptoms. So again, a comparison with the flu mortality would be greatly overstated.
I understand that this virus was new and there was much uncertainty but it is still hard to comprehend how intelligent people could not know that the methods and data they were using would grossly overstate the problem. I will leave it to you to consider who might gain from this.
So how do we correct for these poor and misleading statistics. Starting with the numerator there are currently no good data for separating the deaths between C19 and other causes as is done for the flu. Best would be a guess but from talking to an admittedly few doctors a number like a 20% reduction is probably minimal. Don’t need to argue this as other data on the denominator have far more implications.
The argument for why no effort was made to identify how many people actually had the virus for the denominator was initially that the C19 was not the flu and they did not have sufficient information to determine what the multiplying factor should be. Seems reasonable at least at the outset? Not really! If you remember at the very beginning before any lockdowns the cruise ship that docked in Japan with C19 on board. Before they would let anyone off the ship, they tested everyone so they could isolate the infected. The numbers they got showed a significant number of passengers beyond those with symptoms had the virus. It was not a valid sample for reasons of size and makeup to make it definitive as to the amount. But for any reasonable person it should have been a warning that using the current denominator for mortality for C19 was going to be grossly overstated. Yet the press merrily repeated those initial numbers while various segments of the medical community happily used them to underly their models as to how many would ultimately die. That’s where the we got the death rates in millions that scared the daylights out of the citizenry. Fear that has kept many needing treatment out of hospitals and fear that may well cause many to stay in lock down well after it ends to the serious detriment of the economy.
Now as time has passed, there have been numerous attempts made by various entities to try to identify how much of the population actually has or has had the virus. Among them have been Stanford University, USC, the states of Florida, Washington, and New York as well as a number of foreign entities. The Stanford study estimated that as much as 50 to 85 times as many people may have had the virus than were showing up in the original tests. These studies were all done by taking samples of populations and testing everyone. The key to any conclusions was the quality of the sample and it definitely varied. But virtually all were in the range of the Stanford study. So if we start with the initial estimates of 3-4% mortality for C19 that was the range of most of the initial estimates and then increase the denominator by 50 ( the low end of Stanford) that would reduce the range to 0.6% to 0.8% If we reduce the numerator by 20% to compensate for the over counting of the deaths actually caused by C19 the numbers become 0.48% to 0.72%. If you use the high end of Stanford and do both correcting calculations, the numbers become 0.28% to 0.37%. Again the flu runs around 0.1%.
However, we are not done. First deaths are not equally distributed among the population. We know older people have higher mortality rates than the young. But even more importantly we know that people with co-morbidities have almost a 10 times higher likelihood of dying if infected. I actually think that when the statistics are adjusted to reflect how much of the older population had the co-morbidities we will find out that the age per se is not really the issue. It is just that aging tends to lead to more of the co-morbidities. In other words, even if you are over sixty-five but have no significant co-morbidities, your morbidity rate compared to an equally healthy younger person is probably only marginally higher. So what then is the mortality rate for someone without co-morbidities? It would be between around 0.03% to 0.07%, again compared to 0.1% for the flu. So a third to two-thirds LOWER than the flu. So why are we all in lockdown??
Ahhh, to quote Mark Twain:
“There are three kinds of lies: lies, damned lies, and statistics.”
All I can relate to is the problems that occurred in Wuhan, then (in no particular order) Italy, Spain, New York, etc., I don’t think the flu seasons bring such ravages even allowing for other “underlying” causes. Also, it seems to me, the propensity for the disease to be so contagious is more unusual than the “normal” diseases like colds and flus. Without the lockdowns, I think it may have been – potentially will be – much worse.
Even the amazing Sweden isn’t doing that well – 6th in death rates. Cases per million of the population is massively unreliable due to testing failures by everyone, deaths per million, not so bad but still erroneous.
Hospital usage has been much higher than normal, I think. Worldometer has some stats by age group:
https://www.worldometers.info/coronavirus/coronavirus-age-sex-demographics/
Provides quite different numbers, but supports the general thesis of JD’s analysis
A few states are testing the hypothesis that the virus isn’t as deadly as first believed, such as (GA, TX, SC, FL, etc.).
Incubation period for the virus is between 0 and 33 days – with the vast majority of infections showing symptoms between 2-14 days. Asymptomatic carrier rates vary wildly depending on the study referenced. There’s general consensus that asymptomatic carriers can spread the disease.
Initial effects of easing restrictions should be revisited in about 2 weeks. Data on severity within the end of the month or beginning of June.
“It would be between around 0.03% to 0.07%, again compared to 0.1% for the flu. So a third to two-thirds LOWER than the flu.” this isn’t substantiated by any of the research out. NYC had 1 in 500 of its residents die and even with that probably is only at 15-20% immunity, would have to repeat that 3x to achieve it. Be careful with wishful thinking. Mortality rate likely 0.5-1% in low risk, 3-9% in older/ vulnerable based on most available data. PS the Stanford study is not peer reviewed.
JD, how do your many words account for the many additional deaths as displayed here? “Death rates have climbed far above historical averages”
https://www.ft.com/coronavirus-latest
The Flu doesn’t do that. The mortality of Covid-19 is apparently under-counted in the statistics.
Anyway, what is your investible thesis? That virologists and statisticians all over the world are pulling a fast one on us, and that we should therefore be all-in the stock market?
I wouldn’t be surprised if above average death rates are due to the fact that people aren’t going to the hospital to get treated for serious issues like heart attacks, etc. For the investible thesis, much will depend on how the world reacts as more is learned about covid. My view is that if we continue on the current path it will be a very long road back and the market may well drift down over 6-12 months to Cam’s range in the 1800’s as the focus shifts to worldwide economic ruin. As such i’m currently in 40% cash and planning to buy on the way down.
JD – I have thought about the stats too, and what we would do differently if it suddenly became apparently that the fatality rate was actually as low as the flu. That said, I do not subscribe to the idea that a lockdown is unnecessary. and that is because we KNOW hospitals are being overwhelmed (at least in the worst-hit cities). Is that not enough evidence to tell us we had to do something?
@Mark – I think the initial approach of a total lockdown was understandable given the lack of data at the time. I also agree that a continued lockdown is necessary, but not a total lockdown. Only a lockdown of at-risk groups (those with diabetes, obesity, hypertension, etc). If done properly this should not overwhelm the healthcare system.
@Ellen – 1 in 500 is scary and tragic. But we shouldn’t confuse fatality with level of contagiousness. I’m not saying covid is not far more contagious than the flu. We just need to differentiate between the approaches we take to prevent the at-risk groups from contracting it. Trying to prevent everyone (including those at no risk) via indefinite lockdown is neither feasible nor reasonable given how easily it is transmitted.
@JD I think Ellen is saying that 0.2% (1 in 500 isn’t the fatality rate) of New York City’s population died. Fatality rate would be much higher than flu in that case. And it’s hard to segregate the weak and the strong if that means we have to segregate family members from one another.
This week’s version of Bob Wachter’s Grand Rounds is linked here:
https://www.youtube.com/watch?v=z_ZsrlGtqfk
Just a few interesting points in no particular order.
(a) An early study done at a nursing home in Seattle found that of the patients who initially
tested positive but were asymptomatic->89% went on to develop clinical disease. Thus we may begin to see the term ‘presymptomatic’ being used.
(b) Although remdesivir has thus far not been shown to decrease mortality at a statistically significant level – the actual numbers from an ongoing randomized clinical trial were 8% with remdesivir versus 11.6% with placebo. As the study progresses, at some point the difference may (or may not) become statistically significant.
(c) One ‘remdesivir versus control’ study has been closed, in favor of moving on to a ‘remdesivir versus remdesivir + baricitinib’ study. I think the implication being remdesivir has shown enough promise to move on to more useful studies.
(d) Re the recent report of large-vessel strokes in relatively young patients – sample size was just 5, but likely passed editorial review as part of the balancing act between waiting for more rigourous data versus the importance of publishing pertinent information.
(e) Ideal testing frequency once a simple and easy test becomes available. Every 2-3 days would probably catch 100%, but from a practicality standpoint every 3-7 days would be a reasonable goal.
Cam- Is it possible to add an ‘edit’ option to our replies? (The best way for me to catch a typo is to hit the Enter key and then reread what I just sent!)
Unfortunately the system we have doesn’t allow an edit button. Sorry.
Thanks rx!
I’m not sure what kind of news coverage tomorrow’s legal ruling in Germany’s courts on the ECB asset purchases is getting where you are located, but I suspect that investors should be prepared for whatever judgement we will get tomorrow. If ECB asset purchases are to be ruled illegal in any way that could cause some panic among investors.
https://www.ft.com/content/e0ac5f7a-8b85-11ea-9dcb-fe6871f4145a
I recognize that the German court ruling is a concern, and an unfavourable ruling could cause a minor earthquake in the markets.
However, this is Europe, and much of what happens in the EU is European theatre. As we have seen in past crises, there will be the usual horse trading in the backrooms and a deal in the end, as long as everyone involved are pro-Europe.
I watched an interesting documentary yesterday on the Black Plague in Europe. It was actually the Bubonic Plague caused by rat fleas. It then got into people’s lungs and became the Pneumonic Plague which could be transmitted from person to person. It was over in only 9 months but it killed 60% of London’s population.
We have so far flattened the curve, but have we avoided any deaths, other than those speculative ones associated with crowded hospitals ?
What we have done is educate a population to the extent that it avoids emergency rooms for real emergencies rather than risk catching CV-19. Will this population embrace a reopened economy ? I doubt it.
https://www.statnews.com/2020/05/04/collateral-damage-occurs-when-doctors-and-patients-wear-covid-19-blinders/
Dr. Fauci wishing he had a pandemic to fight!
https://www.youtube.com/watch?=75&v=Wf1CB_OWTgQ&feature=emb_logo
Trump Admin expects 3,000 deaths per day by June?
https://www.msn.com/en-us/news/politics/coronavirus-live-updates-trump-administration-models-predict-near-doubling-of-daily-death-toll-by-june/ar-BB13zfhE
JMO, but it still feels like a strong tape, and a -4% pullback feels like reasonable consolidation. SPX futures held above 2775 overnight – sometimes that’s all it takes. Is SPX 3000 still on the table? Odds are noticeably lower, but far greater than zero – 25% maybe.
Incorporating a few of Cam’s ideas re small-caps + ex-US, a better play here might be VT (global index). Not sure what happened to VTWSX (the Vanguard mutual fund equivalent), but it can be replicated using a combination of VTSAX (total US) and VTIAX (total ex-US).