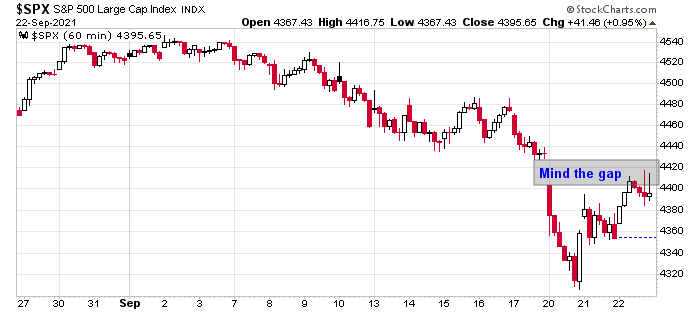
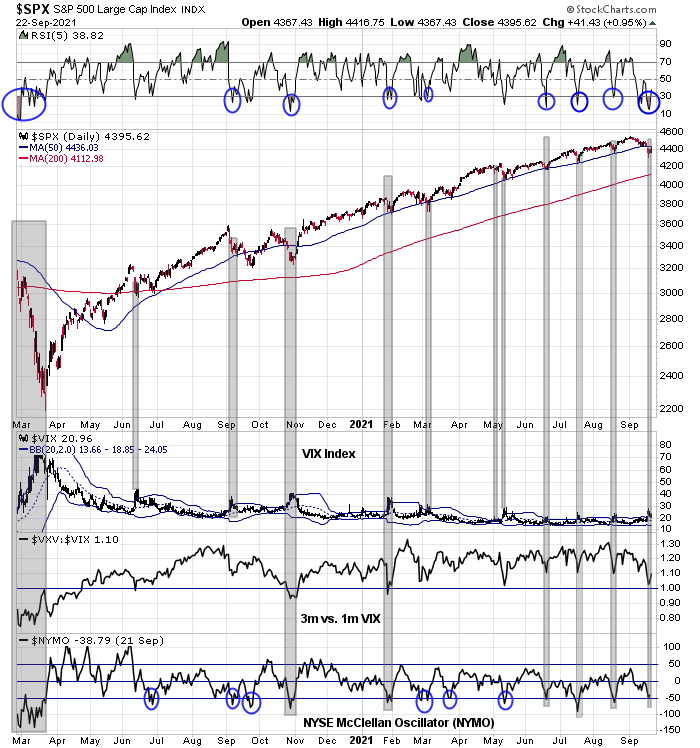
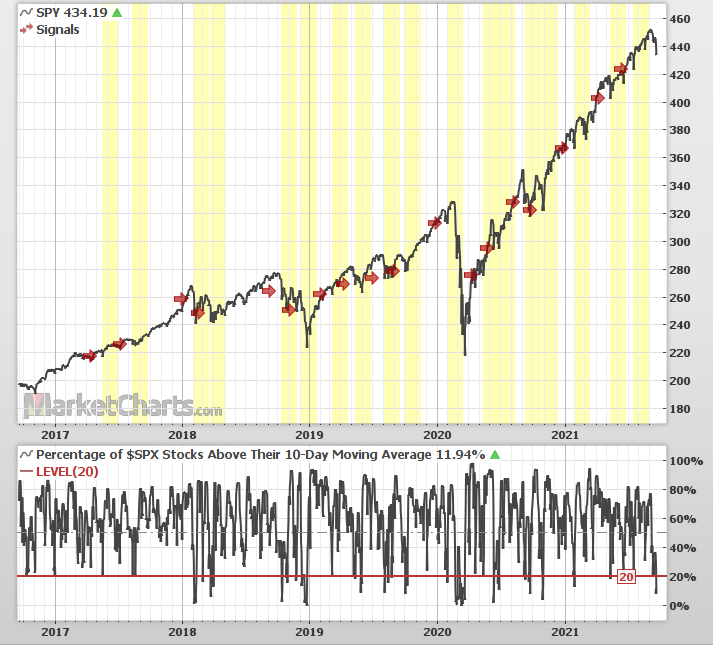
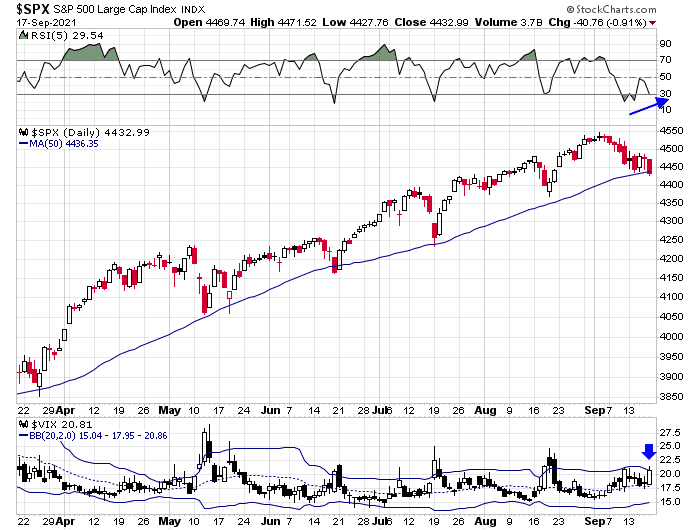
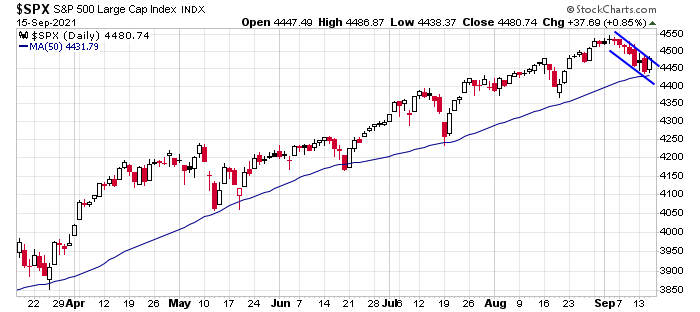
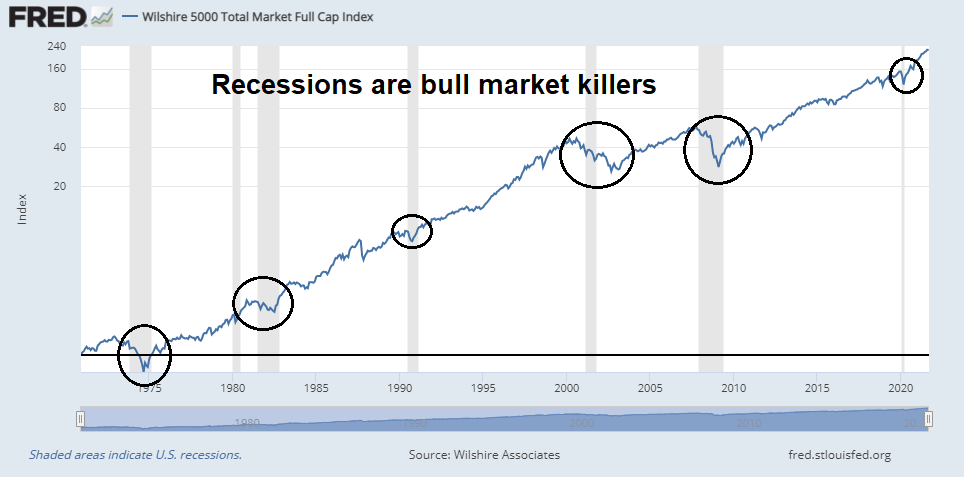
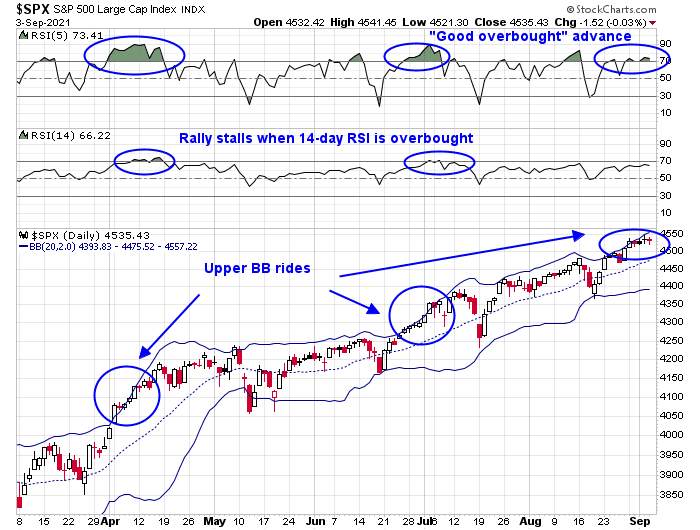
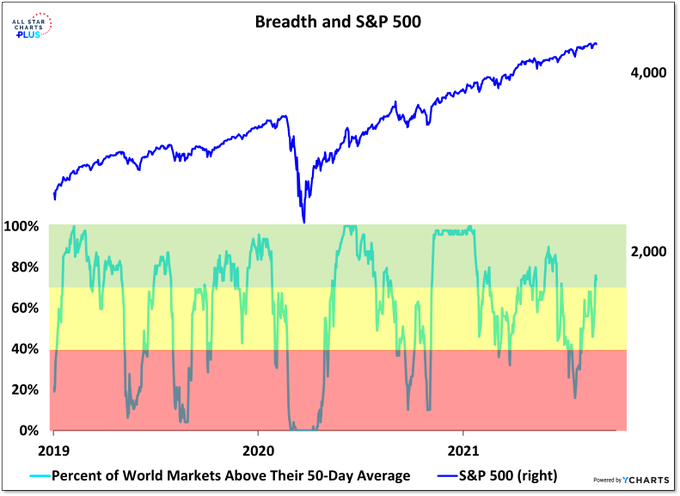
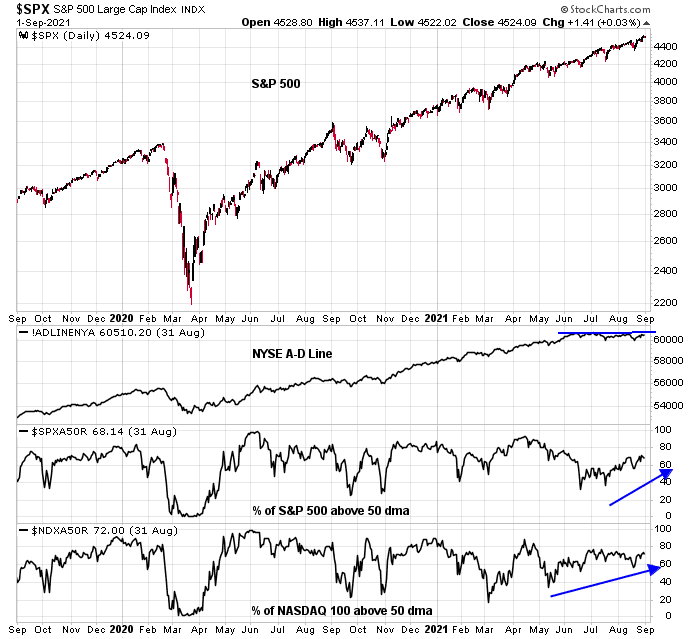
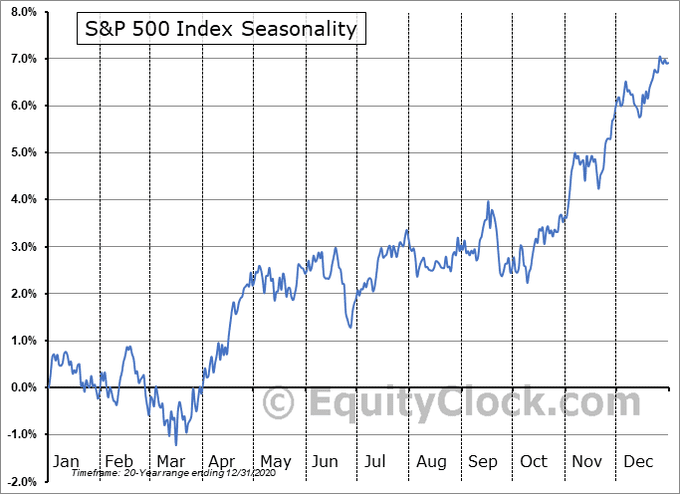
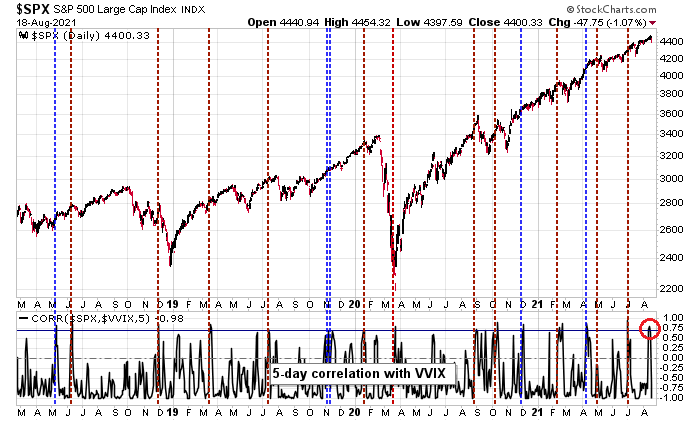
The S&P 500 fell as much -4% from its all-time high in Evergrande panic pullback last week. Is the recent weakness just typical seasonal weakness or something more serious? The intermediate-term breadth looks disconcerting. The percentage of S&P 500 stocks above their 200-day moving average (dma) had been at the 90% level which indicates a “good overbought” sustained advance. This indicator has retreated below the 75% level. There have been four similar episodes in the last 20 years. Three of the four occasions resolved themselves with substantial drawdowns while the remaining one saw the market trade sideways in a choppy way.
The odds don’t look good. The market may be setting itself for a mid-cycle swoon.
A history lesson
For some clues of what the future holds, let’s walk through the history of each of the four episodes. First, we can observe that the market didn’t really bottom out until the percentage of S&P 500 stocks fall to at least 20% (bottom panel). Based on the current reading, it’s not over yet.
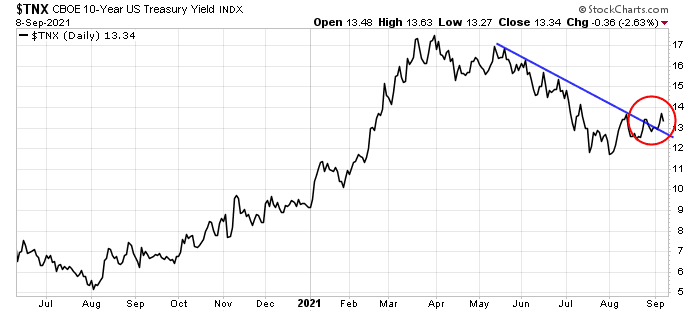
The above chart also shows macro and risk appetite signals in the form of the cyclically sensitive copper/gold ratio and the relative performance of the consumer discretionary to consumer staple stocks. These indicators were important drivers of stock market performance on those occasions. I have also included the 2s10s yield curve as another frame of reference. In all four of the past instances, the yield curve was flattening and conveys no additional information for this analysis.
Consider the 2004 period. The stock market had recovered strongly after a prolonged recession. There were no signs of softness from the copper/gold ratio and the equity risk appetite indicator of discretionary to staple stocks. The market consolidated sideways to digest its gains and went on to rise further.
The 2010 episode was similar to 2004 inasmuch as they were both rallies off recessionary bottoms. The key difference in 2010 was the weakness shown by the copper/gold ratio and equity risk appetite. Simply put, the stock market pulled back because of a growth scare.
The 2011 period was marked by the dual challenges of a Greek Crisis as the eurozone faced an existential crisis. Recall the endless European summits and the crisis was not fixed until the ECB stepped in with its LTRO program. Across the Atlantic, Washington was embroiled in a budget dispute marked by the S&P downgrade of Treasury debt from AAA to AA. Is it any wonder why stock prices skidded?
The 2014 episode was unusual as the macro and risk appetite signals were similar to 2004. Both the copper/gold and equity risk appetite indicators were moving sideways and showing few signs of stress, but stock prices experienced a sudden downdraft. At the time, the market had become increasingly concerned over the umbrella protests in Hong Kong and an Ebola outbreak in Africa. The moral of this story is normal market pullbacks can happen at any time and the 2014 correction can be considered a part of normal equity risk.
The Evergrande fallout
Fast forward to 2021. History doesn’t repeat itself but rhymes. What is the outlook and the challenges for the months ahead? The issues facing investors can be categorized as:
- The implications of the China Evergrande meltdown;
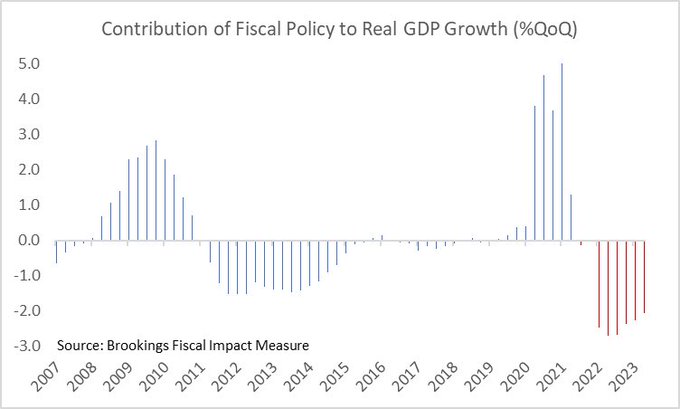
- Possible economic weakness in 2022; and
- Political uncertainties surrounding the impasse over the budget ceiling, as well as Biden’s $3.5 trillion budget proposal.
There have been many calls by analysts dismissing the equivalence of the Evergrande crisis to China’s Lehman Moment. The Lehman Crisis was an institutional bank run, sparked by institutional distrust of one another. They couldn’t be certain that any short-term loans to any financial institution would be paid back. The China Evergrande situation is entirely different. The crisis was manufactured by the government in its efforts to rein in credit growth and to tame real estate speculation. Any crisis of financial confidence could be addressed by Beijing by ordering the banks, which are government-owned, to lend. Even though the Evergrande meltdown won’t result in a disorderly unwind, the economy will nevertheless suffer some fallout.
The well-respected China watcher
Michael Pettis recently explained how Beijing is pivoting from the build infrastructure growth model to a focus on high-quality growth and what that means.
This high-quality growth (to use Beijing’s usual terminology) consists mainly of consumption (driven by increases in household income rather than rising household debt), exports, and business investment. By my estimates, high-quality growth has probably accounted for barely half of China’s GDP growth rate in recent years.
But for China to achieve the required GDP growth rates, it needs another source of economic activity, which I will refer to as residual growth. This growth, for the most part, has consisted mainly of malinvestment by the property sector and by local governments building excessive amounts of infrastructure. Whenever high-quality growth declines, as it did last year when China’s growth rate was actually negative, Beijing steps up residual growth to make up for this decline, but whenever the pace of high-quality growth picks up again, Chinese leaders quickly put downward pressure on residual growth, as it seems to be doing this year.
The fact that Beijing regularly tries to constrain residual growth to the minimum amount needed to achieve the GDP growth target suggests that China places little value on this kind of growth. More importantly, China’s debt history provides a concrete reason for recognizing that much recent investment has been malinvested.

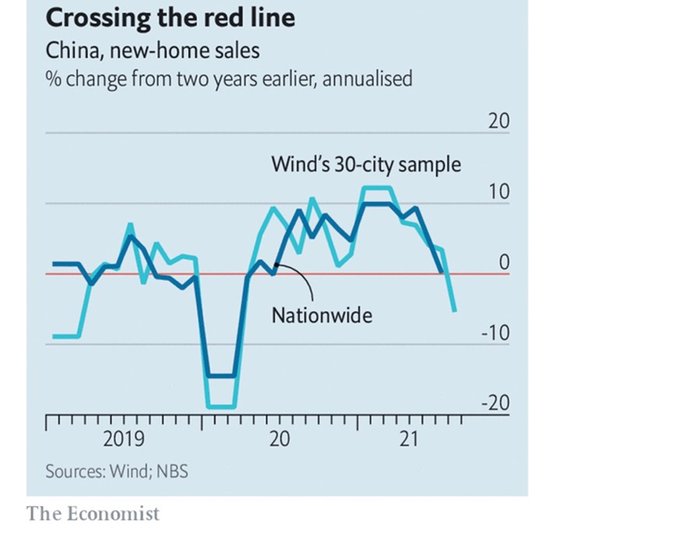
Enough is enough. The latest PBoC clampdown on China Evergrande and other property developers is an important signal that Beijing is pivoting to high-quality growth at the expense of headline GDP growth. Don’t expect Chinese real estate prices to continue to advance strongly over the next few years.
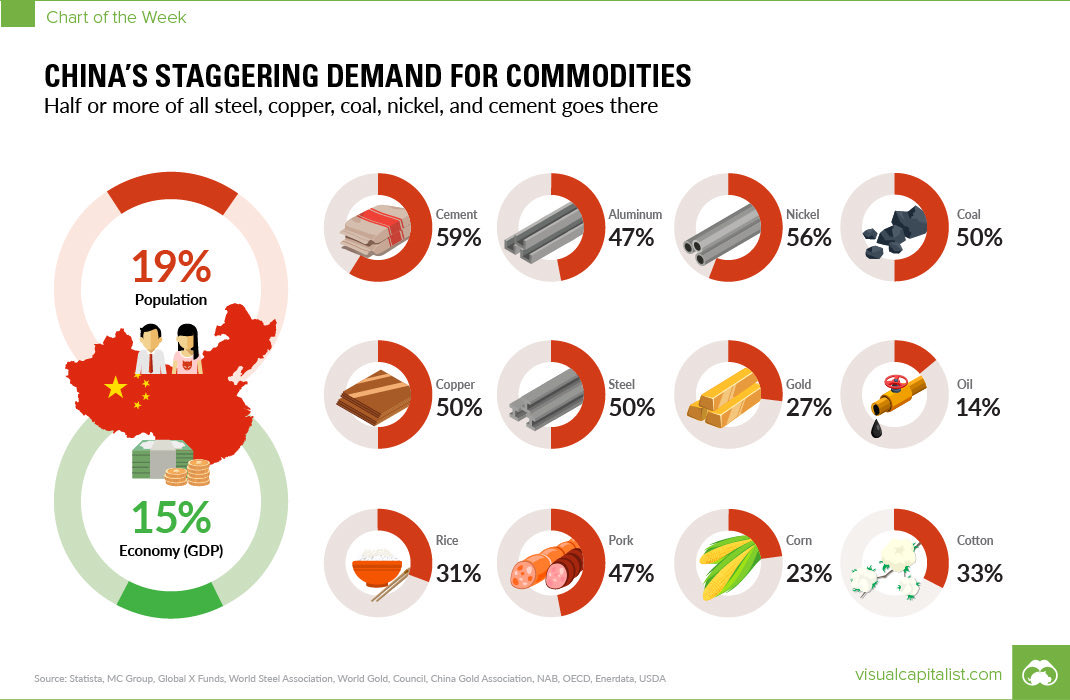
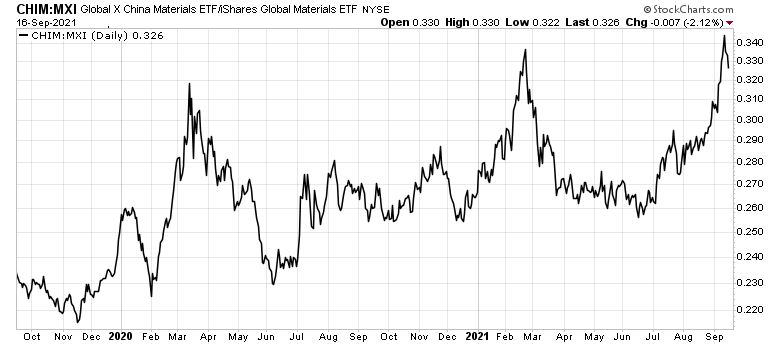
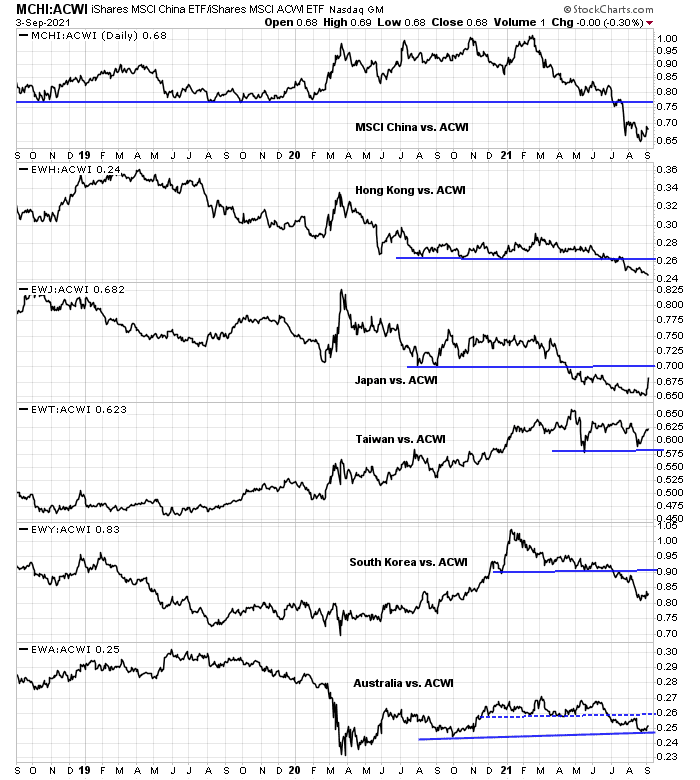
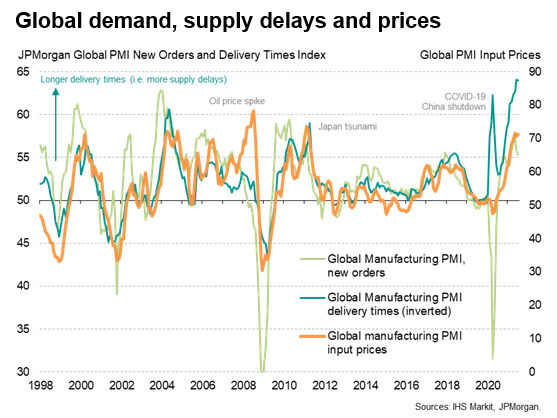
This policy pivot presents a problem for the rest of the world. China is a significant source of demand for many commodities relative to its share of the global population. Any shift away from infrastructure spending will put downward pressure on commodity prices.
Does this put the global cyclical recovery at risk? At a minimum, is the narrative of a bullish commodity supercycle coming to a screeching halt?
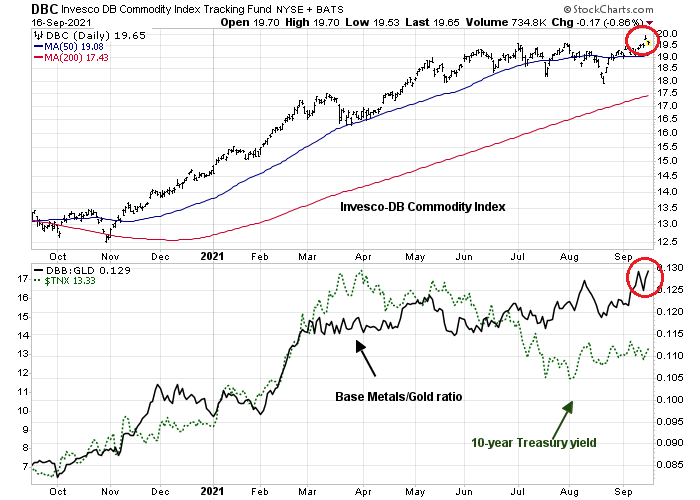
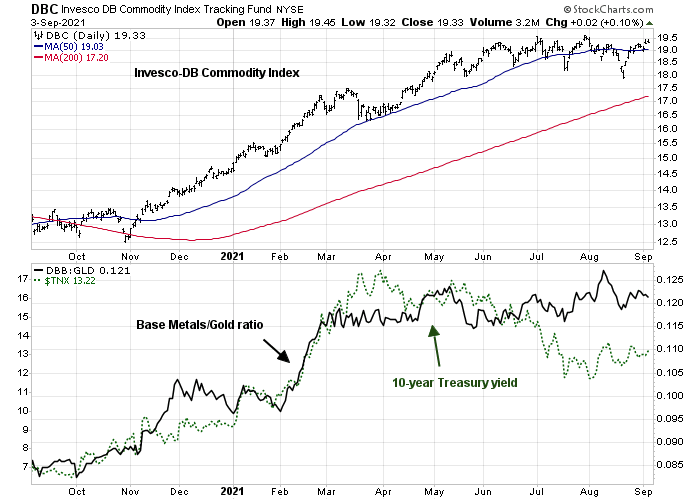
Not so fast! While selected commodities such as iron ore are tanking, the CRB Index is holding above its 50 and 200 dmas. As well, the cyclically sensitive base metals/gold ratio is holding up well and it is not signaling a downturn.
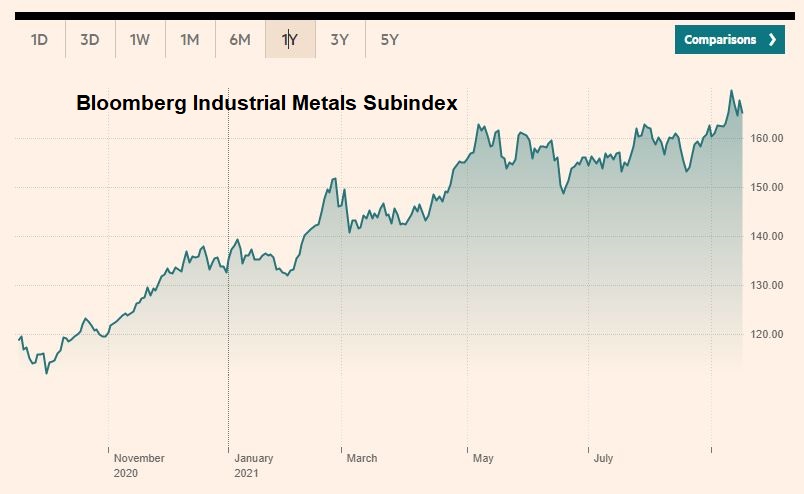
Similarly, industrial metal prices are also not showing any signs of weakness.
To be sure, it’s possible that China is slowing to a more sustainable “quality high-growth” level and commodity demand is falling off. Broad market signals are not indicating a global slowdown. I interpret these conditions as rising recovery demand from the rest of the world is offsetting China’s deceleration.
A potential slowdown
Another challenge for equity investors is the risk of economic weakness. I have highlighted New Deal democrat’s useful economic forecasting framework of coincident, short-leading, and long-leading indicators. His
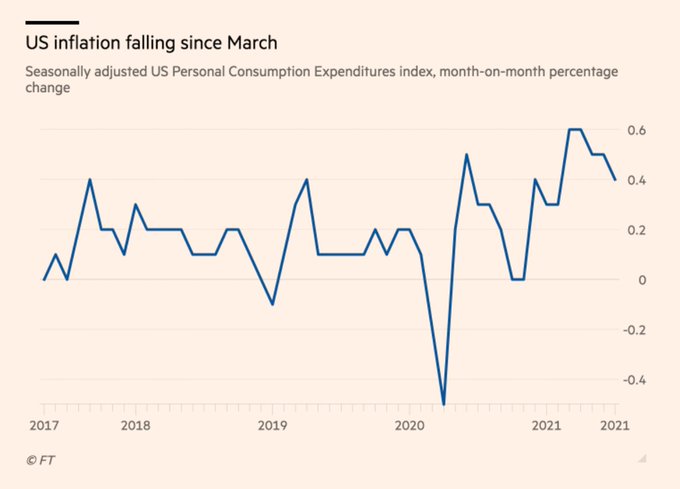
latest snapshot indicates strength in the shorter term indicators but some weakness by mid-2022, though he is not forecasting a recession.
RecessionALERT came to a similar conclusion and his chart is illustrative of NDD’s conclusion. The leading economic data is indicating some softness, but readings are not in worrisome territory.
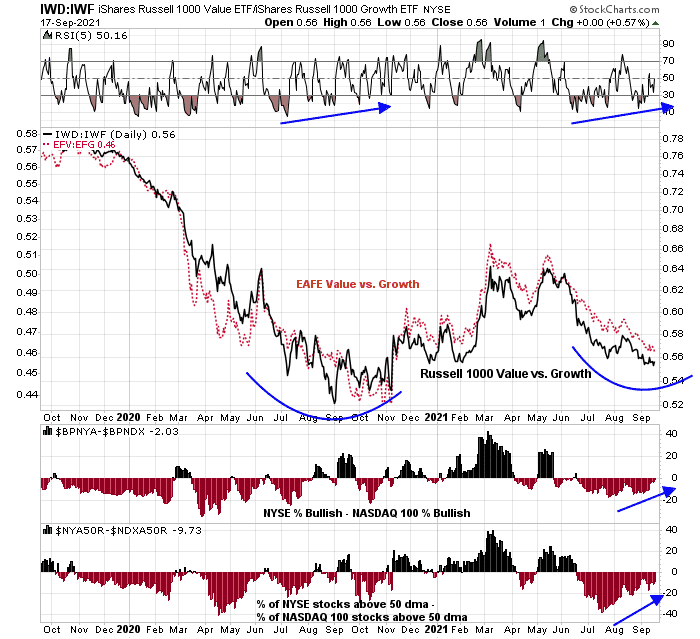
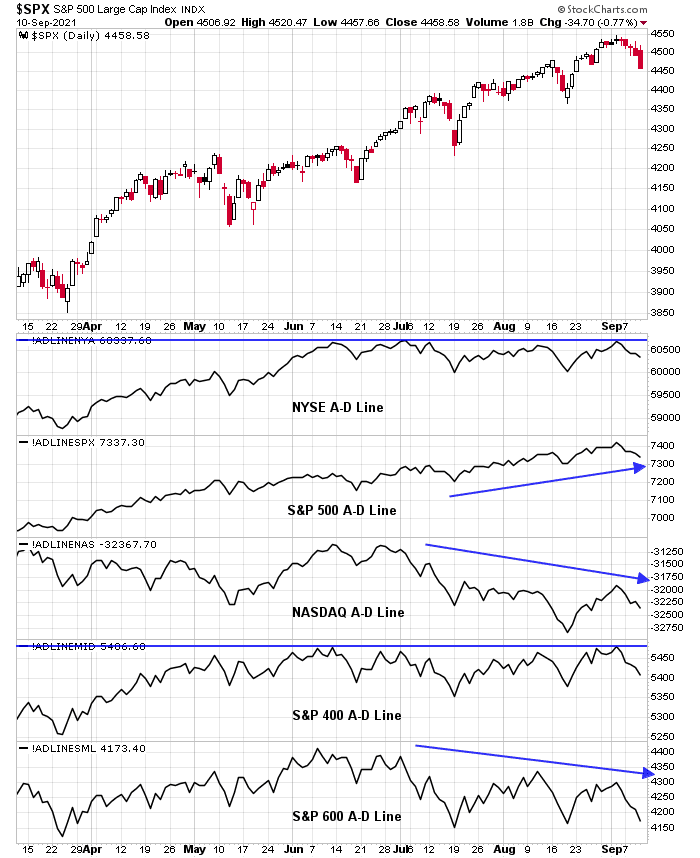
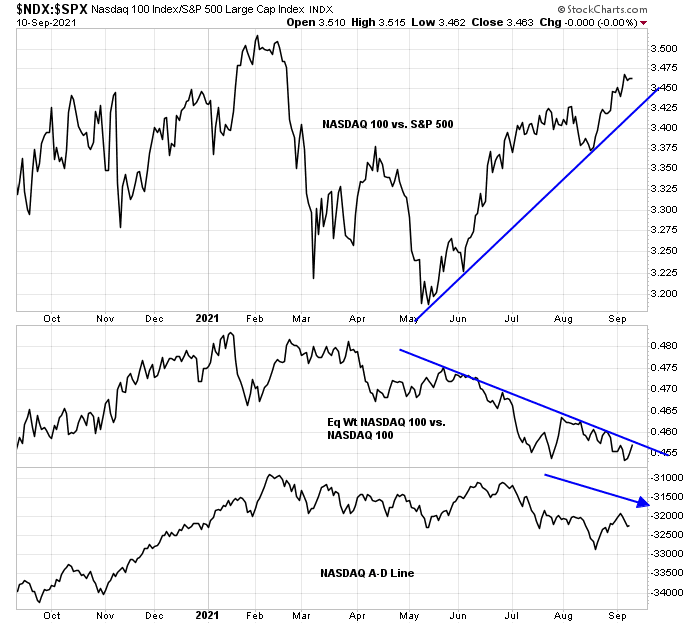
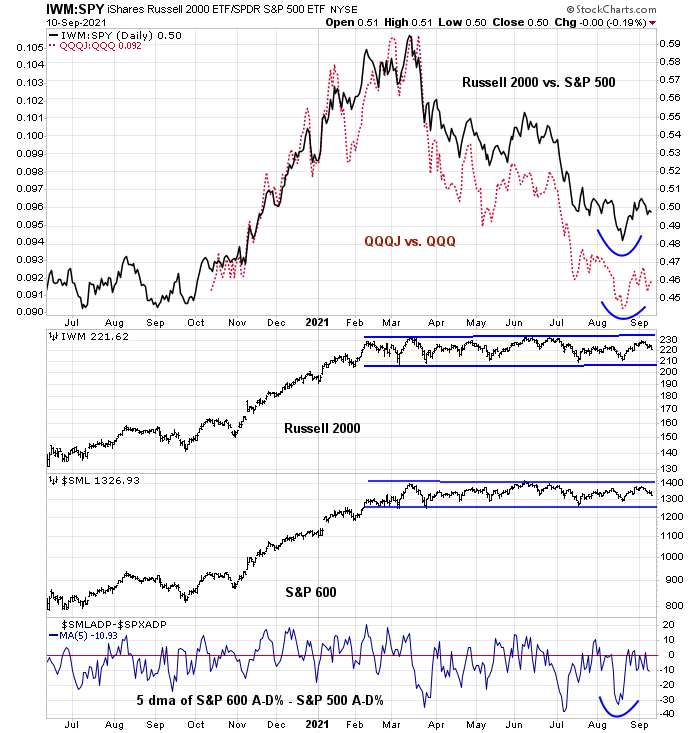
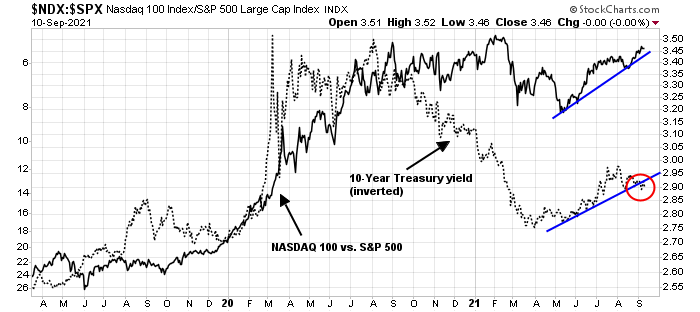
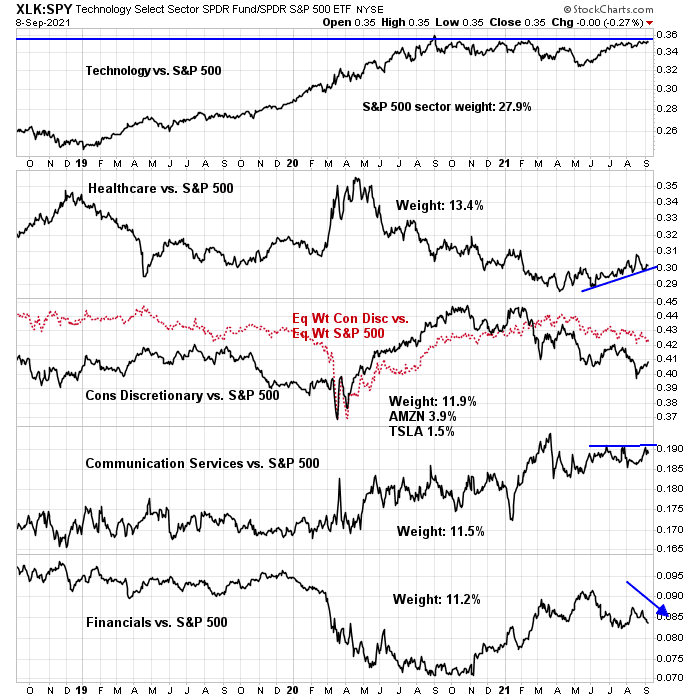
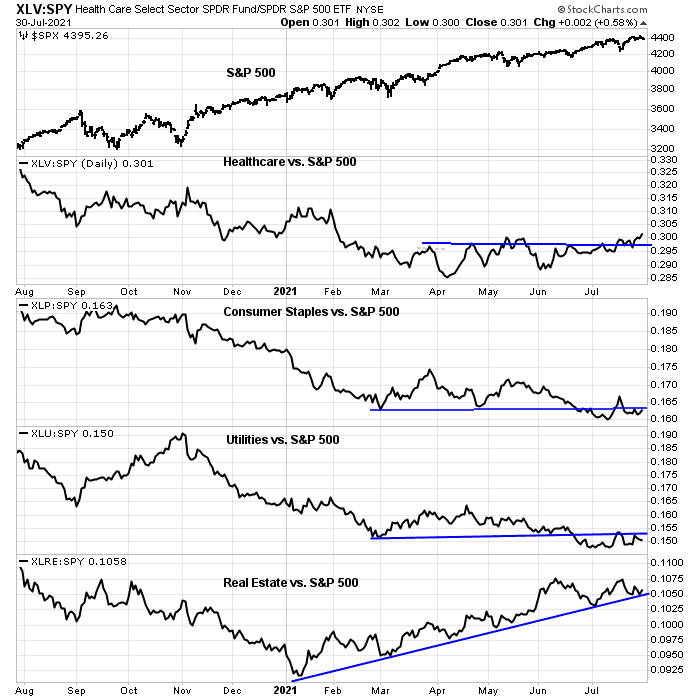
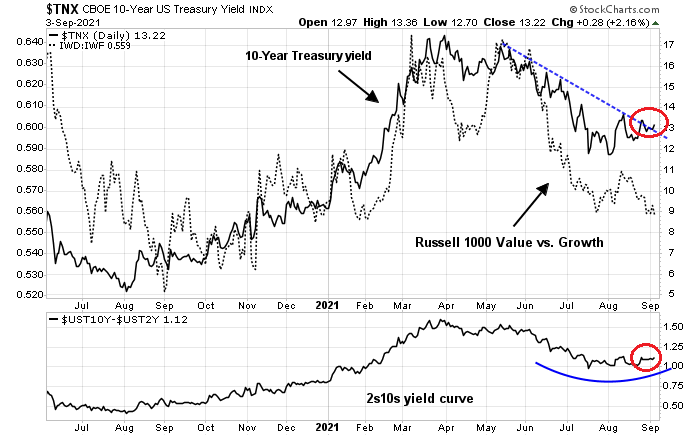
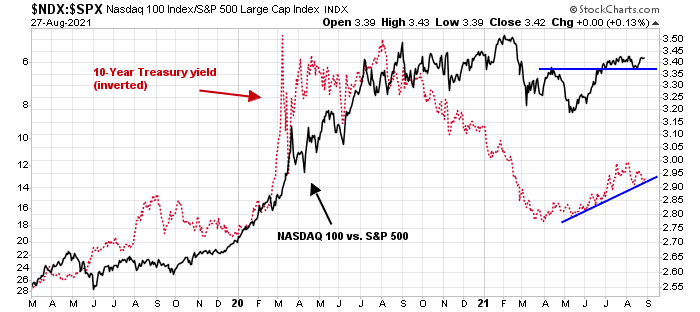
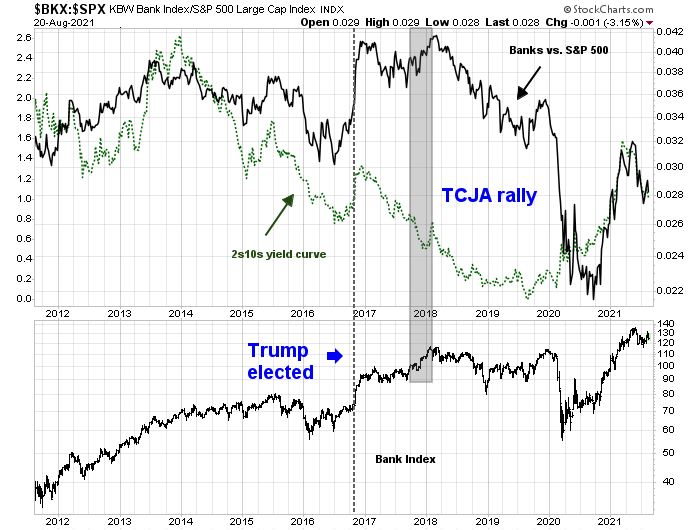
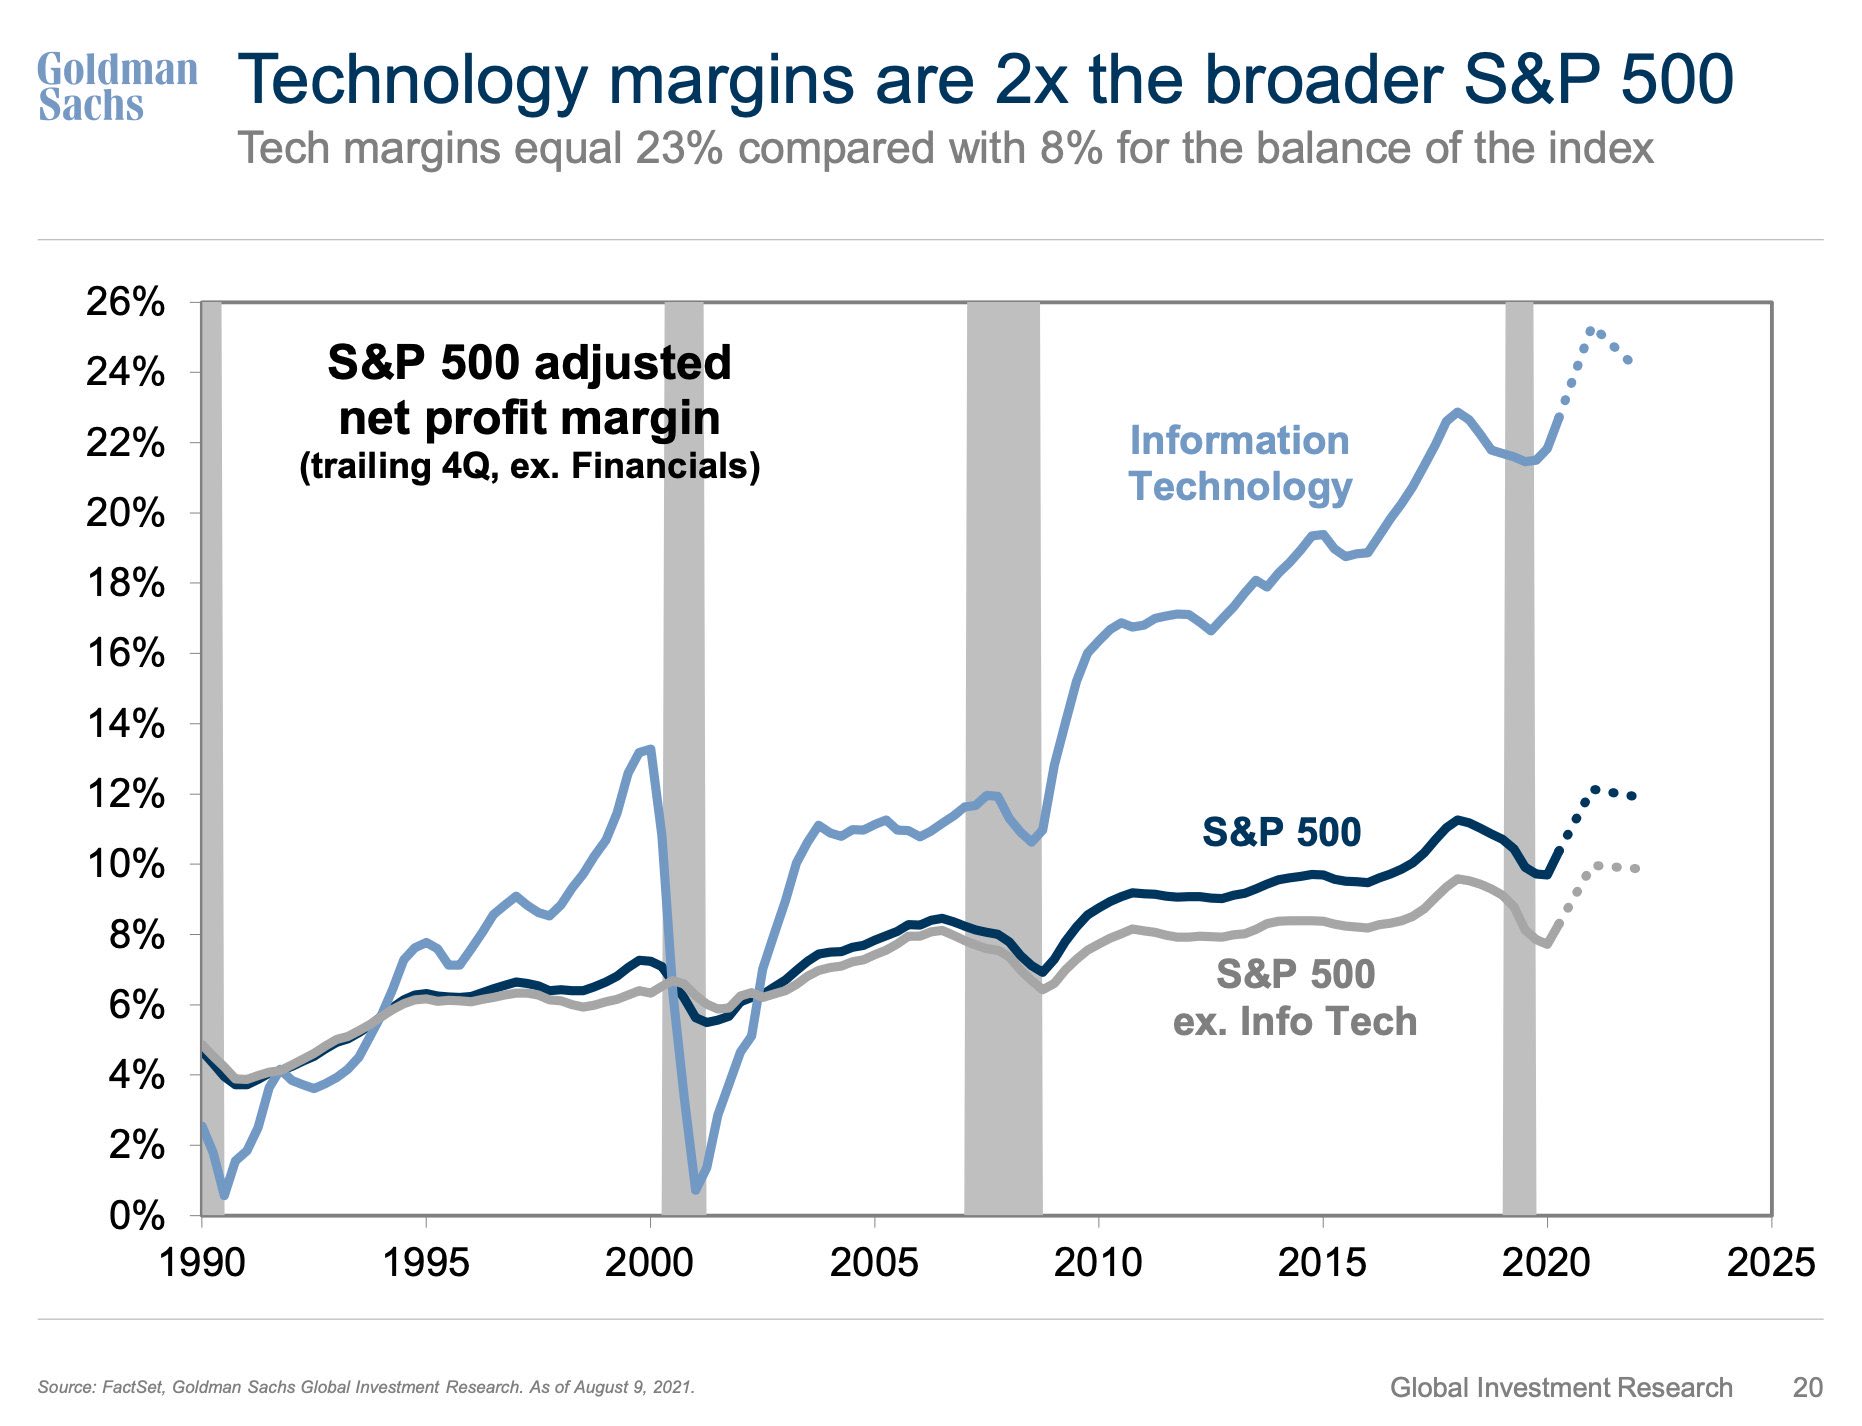
Stock prices are known to be leading indicators and the stock market usually looks ahead 6-12 months. It is therefore not surprising that the percentage of S&P 500 above their 200 dma has weakened. A more detailed analysis of the S&P 500 reveals a bifurcated market beneath the surface. As the 2s10s yield curve flattened, indicating expectations of slowing growth, investors rotated into growth stocks as growth became more valuable in a growth-starved environment. At the same time, value stocks, which also have highly cyclical characteristics, traded sideways.

In many ways, the 2021 backdrop is similar to 2004 and unlike 2010 and 2011. There are no signs of cyclical weakness as measured by the copper/gold ratio and equity risk appetite is holding up well. This should resolve in a period of sideways consolidation in the coming months. There is, however, one key difference. The bifurcated nature of today’s market shows that cyclical and value stocks have been trading sideways since May. Arguably, the market may have already undergone much of its consolidation.
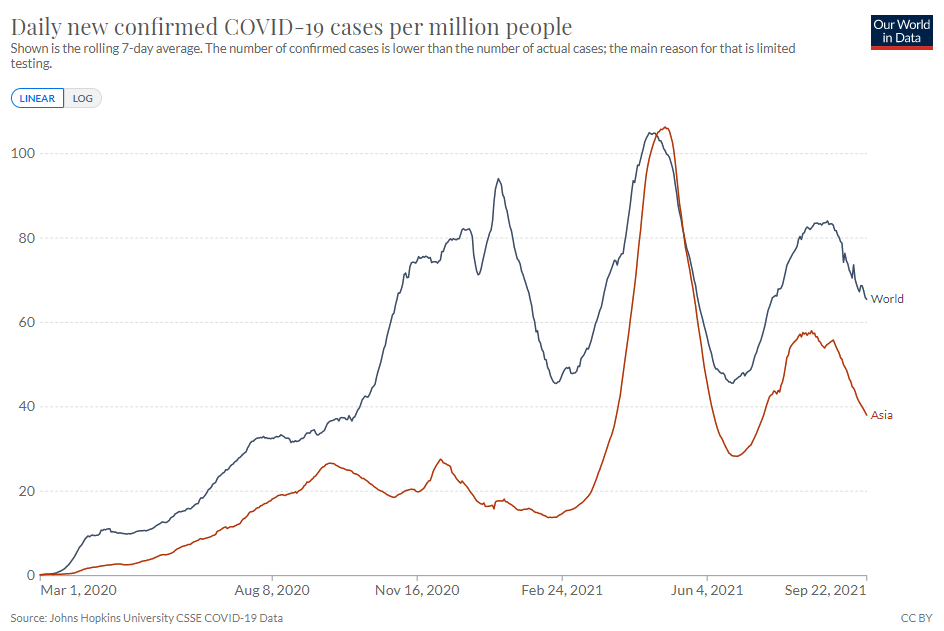
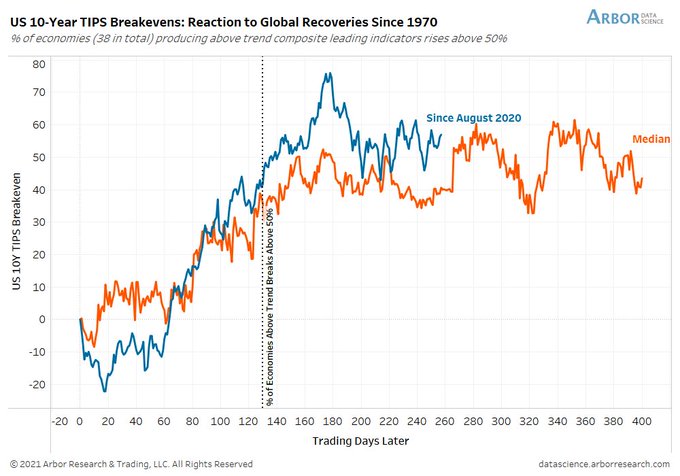
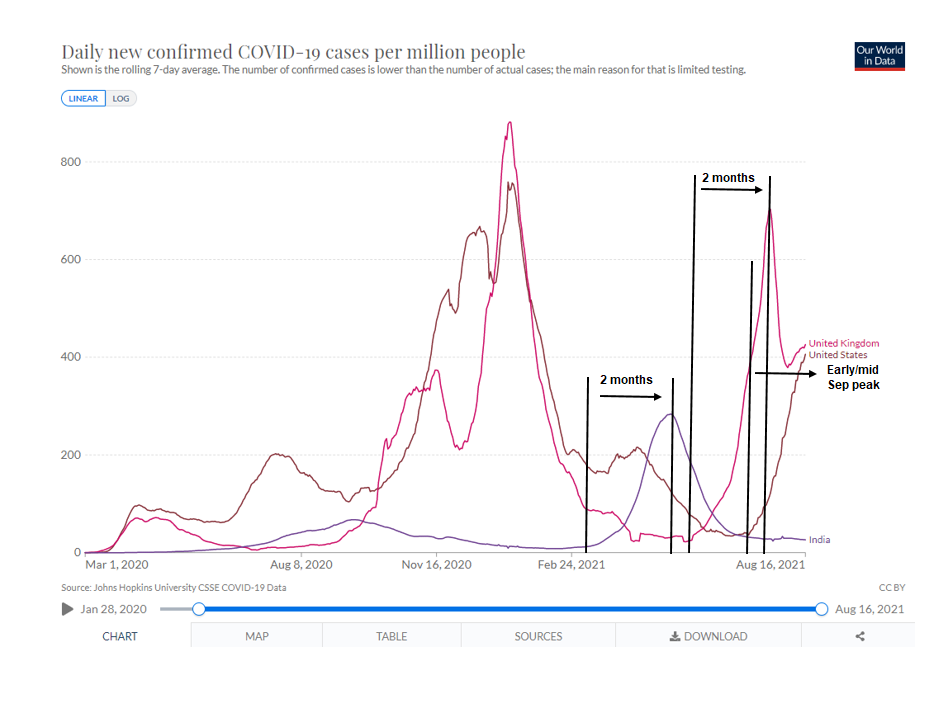
There may be some hopeful signs that the economy is about to turn up. The global recovery has struggled with COVID-19 and several waves of infection. The latest readings indicate case rates have topped. In particular, Asian case counts, which have been one of the key global trouble spots, are rolling over.
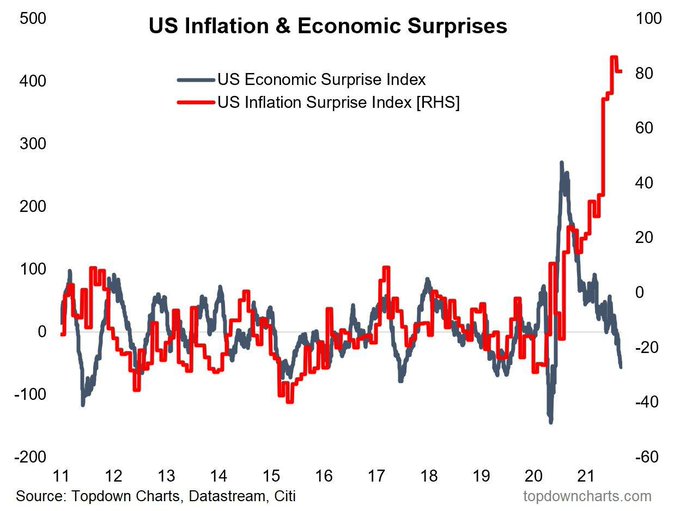
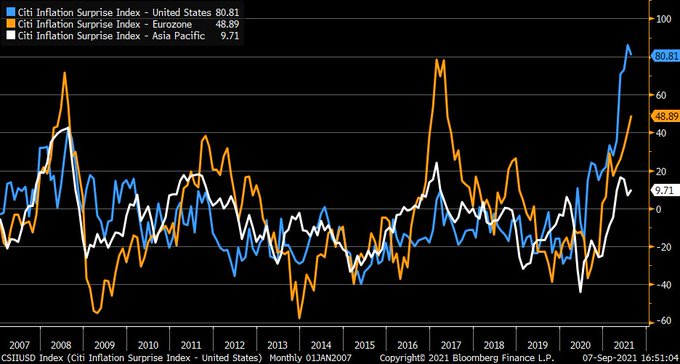
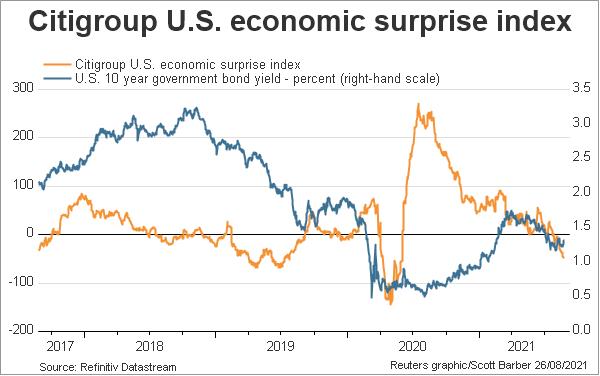
In addition, the US Economic Surprise Index, which measures whether economic statistics are beating or missing expectations, had been falling and the decline may be a signal of economic weakness in mid-2022. While it’s too early to break out the bubbly, the latest readings show an uptick and an improvement in the macro outlook.
Moreover, analysis from The Economist shows that American economic dynamism is still strong. New business applications have surged despite the onset of the pandemic.
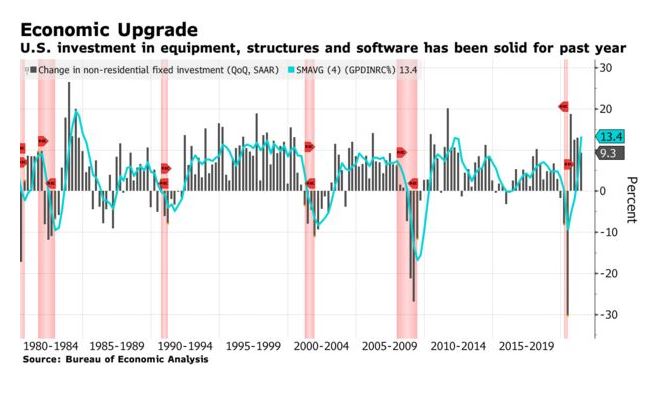
Private non-residential investment is surging indicating the start of a strong capex cycle. In particular, the combination of China’s decoupling initiatives to free its semiconductor supply chain from the West and the West’s desire to open semiconductor manufacturing capacity in friendly countries is sparking an enormous capex revival.
Don’t count America out.
Biden’s challenges
In the short run, the Biden White House faces two key challenges that could unsettle risk appetite. The first is the looming debt ceiling. While lawmakers have always come to a last-hour agreement in the past, the
Washington Post reported that a default or even a prolonged fight could have catastrophic consequences.
Mark Zandi, chief economist at Moody’s Analytics, found that a prolonged impasse over the debt ceiling would cost the U.S. economy up to 6 million jobs, wipe out as much as $15 trillion in household wealth, and send the unemployment rate surging to roughly 9 percent from around 5 percent.
The
Bipartisan Policy Center estimates that the government will run out of funds some time between October 15 and November 4. Over at
PredictIt, the odds of raising the debt ceiling by October 15 is fading fast.
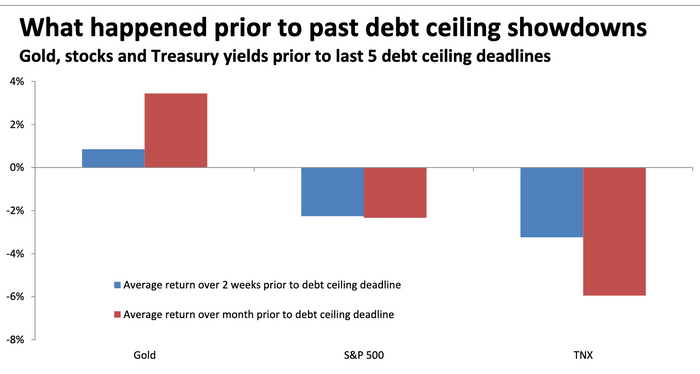
The chances of a government shutdown is rising. Historically, the anticipation is worse than the actual pain. On one hand, the stock market hasn’t performed well leading up to debt ceiling showdowns.
On the other hand, the length of government shutdowns has risen but the stock market has performed well during those events. Sell the rumor, buy the news?

In addition, the Democrats are embroiled in an internal battle between the centrist wing and the progressive wing over the passage of the $3.5 trillion spending bill. There are two components of the bill of interest to investors. The first is the infrastructure and spending package. The
IMF has estimated the jobs multiplier effect of government spending on different economies.
In advanced economies, $1 million of spending can generate an average of 3 jobs in schools and hospitals and over 6 jobs in the energy sector, assuming intermediate labor mobility and labor intensity levels. In low-income developing countries, the estimates are much larger and range from 16 jobs in roads to 30 jobs in water and sanitation. Put differently, each unit of public infrastructure investment creates more direct jobs in electricity in high-income countries and more jobs in water and sanitation in low-income countries.

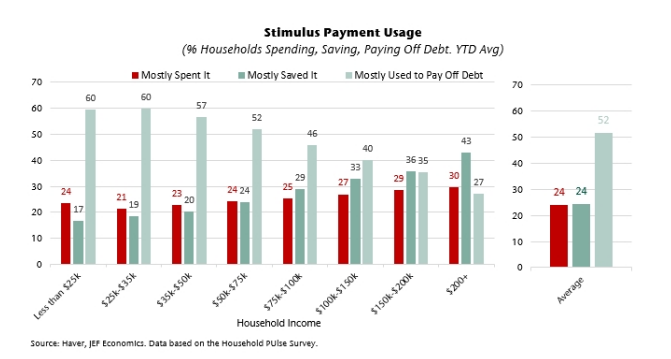
The economic effects of the proposed social spending programs is difficult to project. However, some clues can be found in the last stimulus program, which was highly progressive, on differing households. A survey shows that spending was flat to slight up as household incomes categories rose, but the most striking effect is that lower-income households used the funds to pay off debt and strengthen their balance sheets. Unlike past recessions, loan delinquency rates fell instead of rising and poor households didn’t lose their houses and cars as they did in past recessions. If we were to extrapolate those effects, another fiscal impulse in the form of inequality programs such as daycare and tuition subsidies is likely to further strengthen lower-income household balance sheets and encourage more consumption.
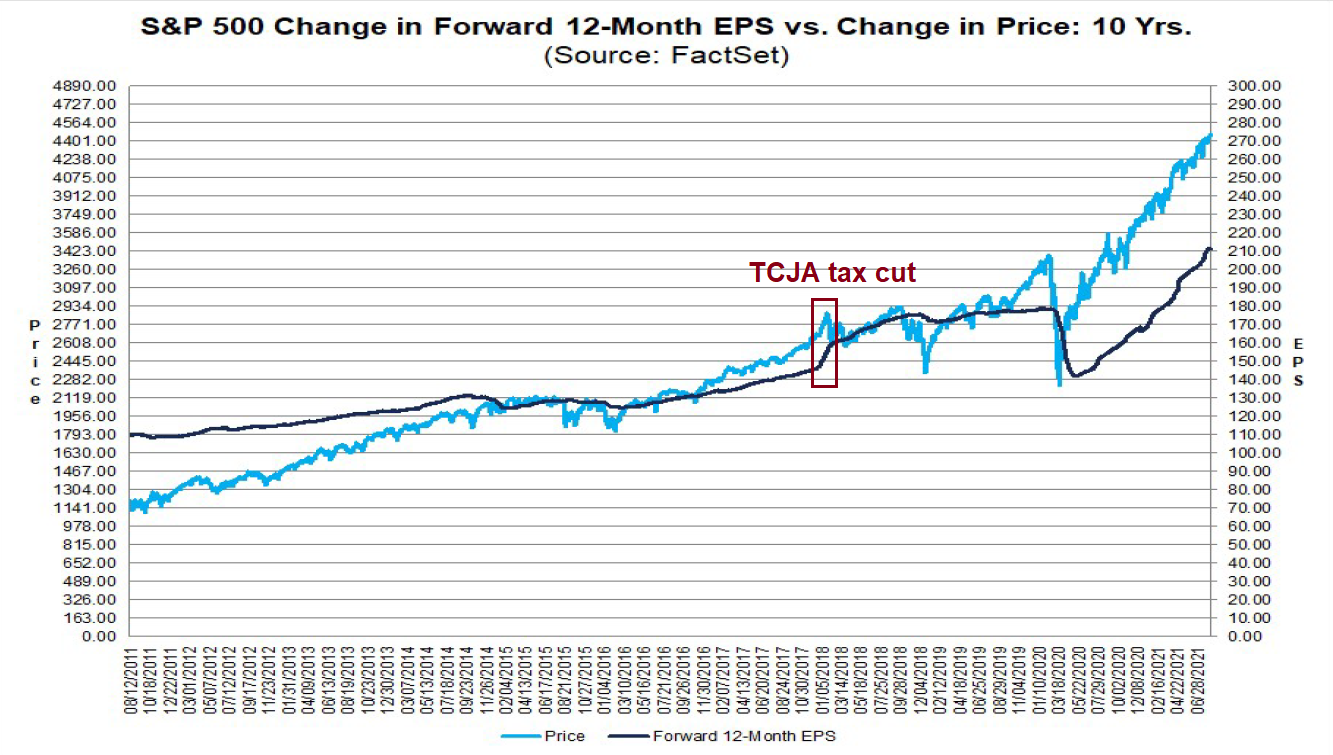
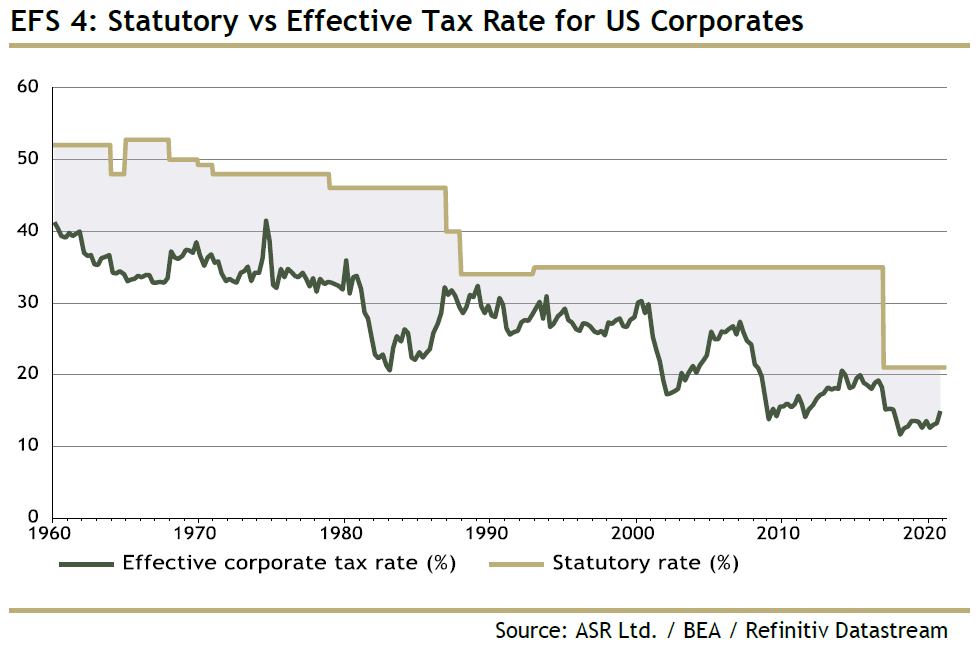
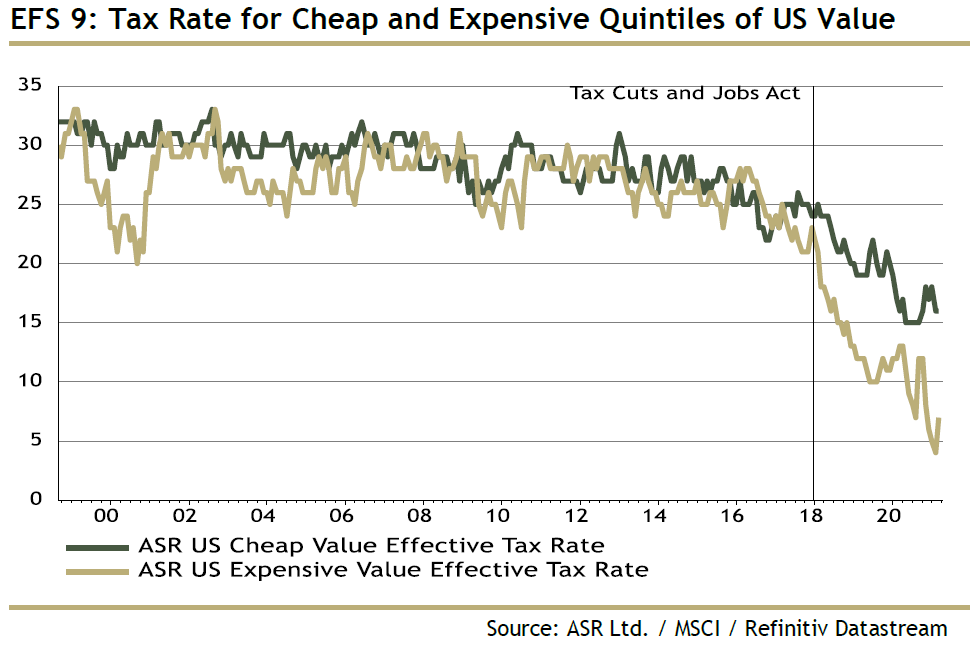
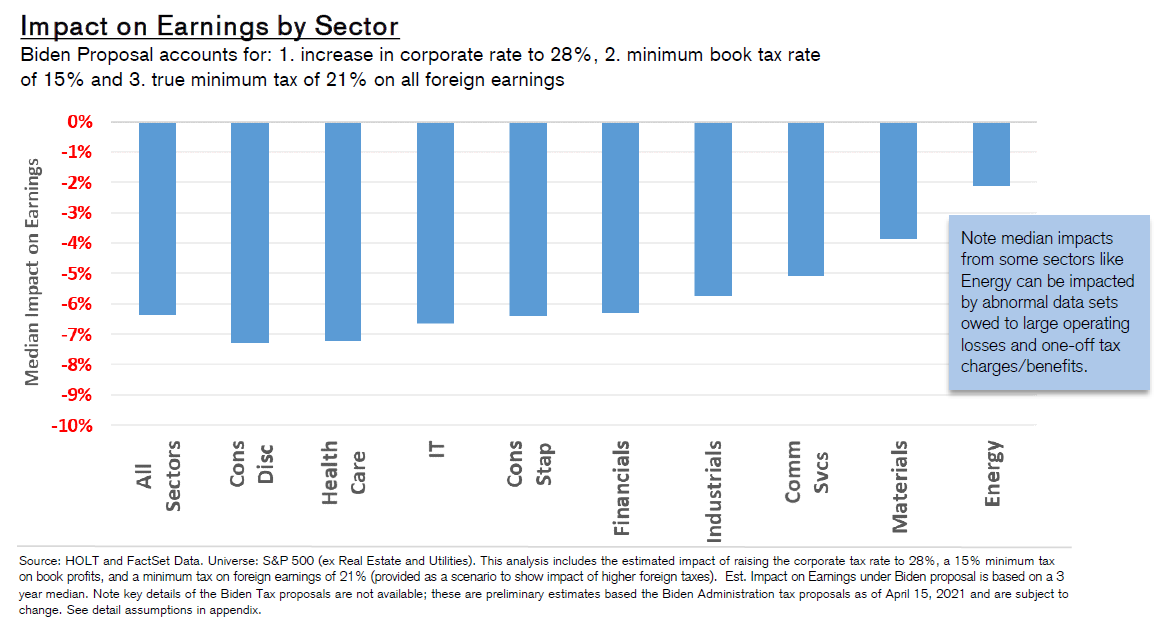
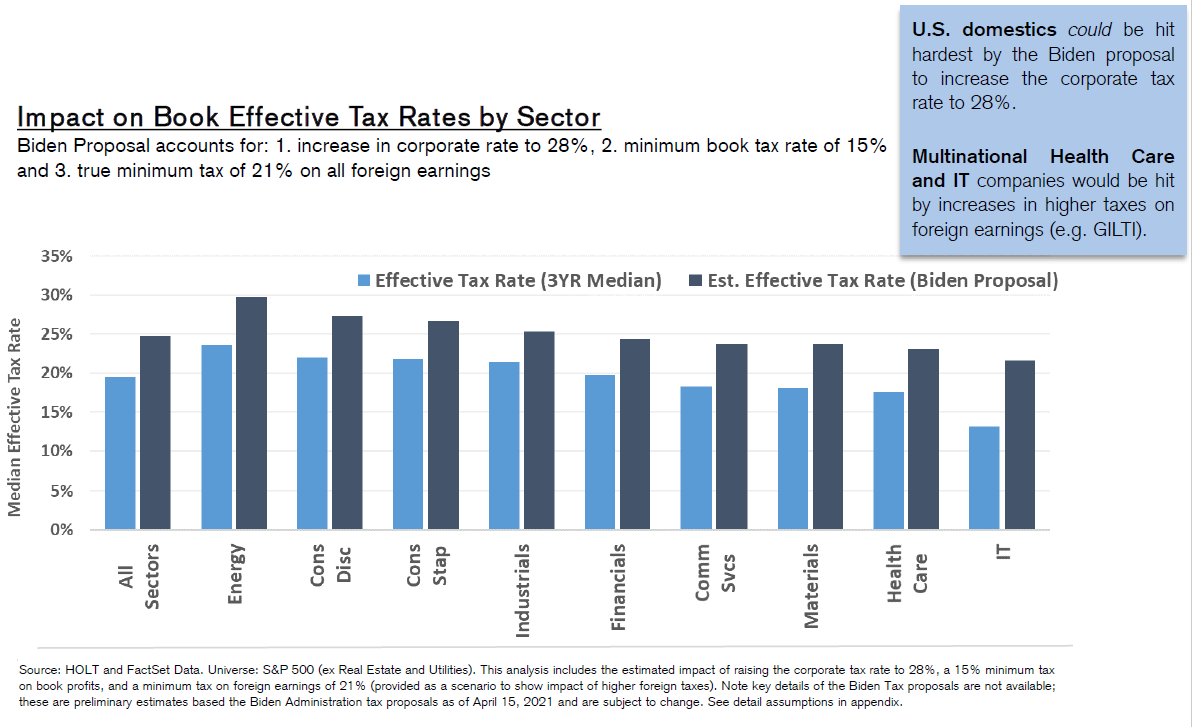
The flip side of the $3.5 trillion coin is a corporate tax increase. Street consensus calls for the corporate tax rate to rise to 25% from 21%. Most top-down strategists are estimating a 5% decline in S&P 500 earnings as a consequence. Over at
PredictIt, the market seems to have anticipated that outcome. Moreover, the recent 5% intraday peak-to-trough pullback in the S&P 500 would have discounted a 5% decline in earnings while keeping the forward P/E constant.

In conclusion, S&P 500 long-term breadth is deteriorating as the percentage of S&P 500 stocks above their 200 dma has retreated from a “good overbought” advance reading of 90%. Past episodes have resolved themselves either with a period of sideways consolidation or sharp pullback. Based on my analysis of the macro and technical backdrop, the sideways consolidation is the more likely scenario. Arguably, stock prices have been undergoing a period of sideways movement beneath the surface owing to the bifurcation between growth and value stocks.