Preface: Explaining our market timing models
We maintain several market timing models, each with differing time horizons. The “Ultimate Market Timing Model” is a long-term market timing model based on the research outlined in our post, Building the ultimate market timing model. This model tends to generate only a handful of signals each decade.
The Trend Asset Allocation Model is an asset allocation model that applies trend following principles based on the inputs of global stock and commodity price. This model has a shorter time horizon and tends to turn over about 4-6 times a year. In essence, it seeks to answer the question, “Is the trend in the global economy expansion (bullish) or contraction (bearish)?”
My inner trader uses a trading model, which is a blend of price momentum (is the Trend Model becoming more bullish, or bearish?) and overbought/oversold extremes (don’t buy if the trend is overbought, and vice versa). Subscribers receive real-time alerts of model changes, and a hypothetical trading record of the email alerts are updated weekly here. The hypothetical trading record of the trading model of the real-time alerts that began in March 2016 is shown below.
The latest signals of each model are as follows:
- Ultimate market timing model: Buy equities
- Trend Model signal: Bullish
- Trading model: Neutral
Update schedule: I generally update model readings on my site on weekends and tweet mid-week observations at @humblestudent. Subscribers receive real-time alerts of trading model changes, and a hypothetical trading record of those email alerts is shown here.
Subscribers can access the latest signal in real-time here.
From shutdown to re-opening
About a year ago, the World Health Organization declared the coronavirus a pandemic. Governments around the world shut down their economies and the global economy crashed into a recession. Fast forward a year, fiscal and monetary authorities have responded with unprecedented levels of stimulus, vaccinations are proceeding, caseloads are dropping, and economies are re-opening again.
The Dow Jones Industrials and Transports made new all-time highs last week. That’s a Dow Theory buy signal.
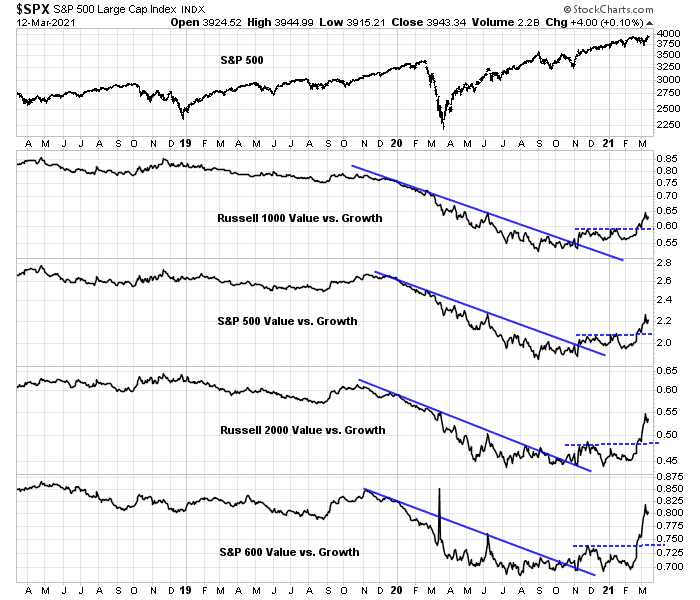
Here is how to play the bull market. First, recognize that the US equity market has bifurcated into two markets. Value and cyclical stocks should benefit as the economy improves. On the other hand, growth stocks are struggling and should be avoided. Growth has too many speculative excesses and they need to be wrung out before they see a durable bottom.
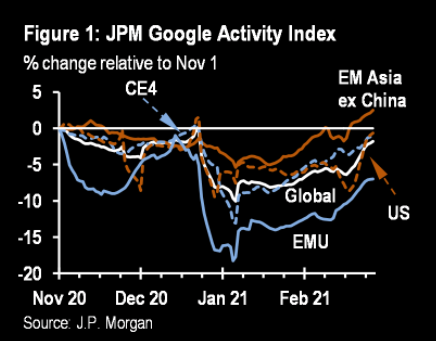
Signs of recovery everywhere
There are signs of economic recovery everywhere. JPM’s Google Activity Index is rising all around the world.
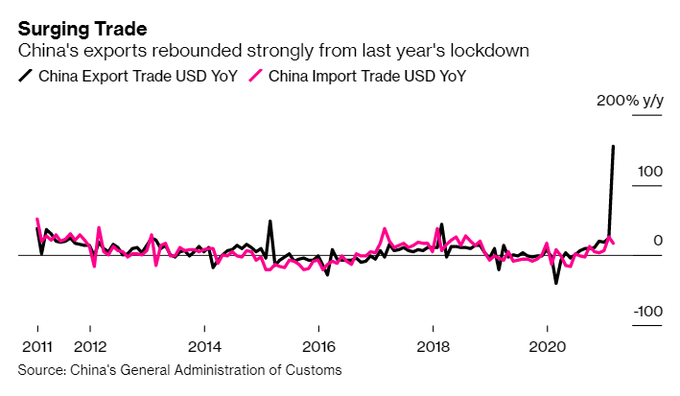
China’s February exports rose an astonishing 60% year/year, which signals a surge in global demand.
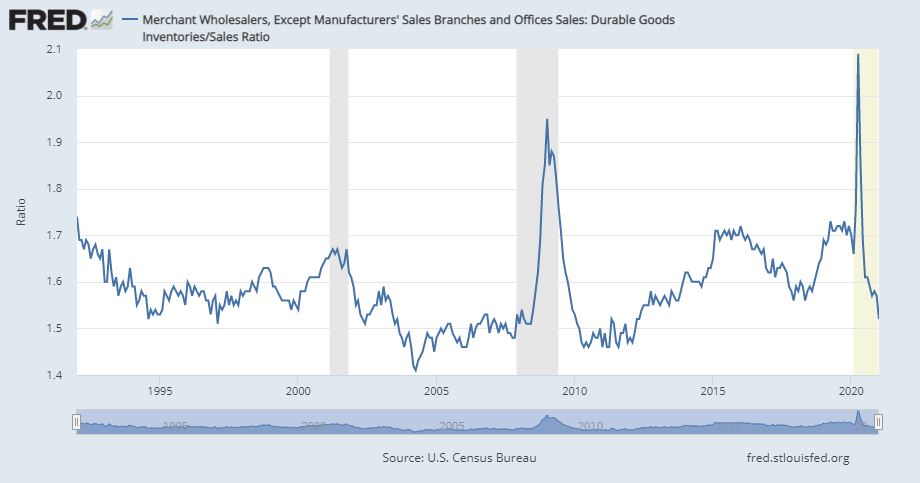
The US inventory to sales ratio has plummeted, indicating that restocking demand is on the way. Add to that the $1.9 trillion in stimulus spending about to hit the economy. We have a good old-fashioned boom on the horizon.
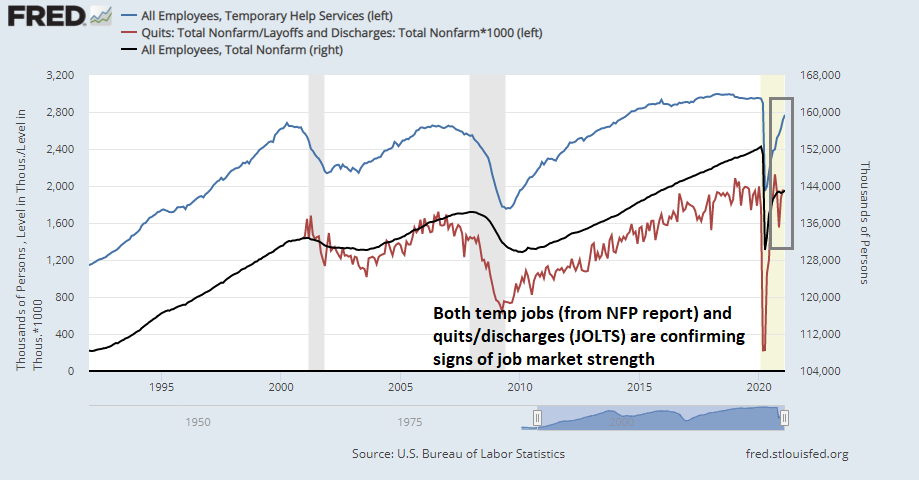
There was also good news from the JOLTS report that was released last week. Both temporary employment, which is part of the monthly Jobs Report, and the quits/discharges ratio, which come from JOLTS, lead Non-Farm Payroll employment, are turning up. These are additional indications of rising employment as the economy recovers from the pandemic shock.
Momentum everywhere
Bullish momentum is appearing everywhere. Price momentum is evidenced by the new highs made by the major market indices last week. Price momentum begets more momentum, as
Renaissance Capital recently pointed out.
As a sign of fundamental momentum, Wall Street analysts have been raising their forward 12-month earnings estimates after a strong Q4 earnings reporting season.
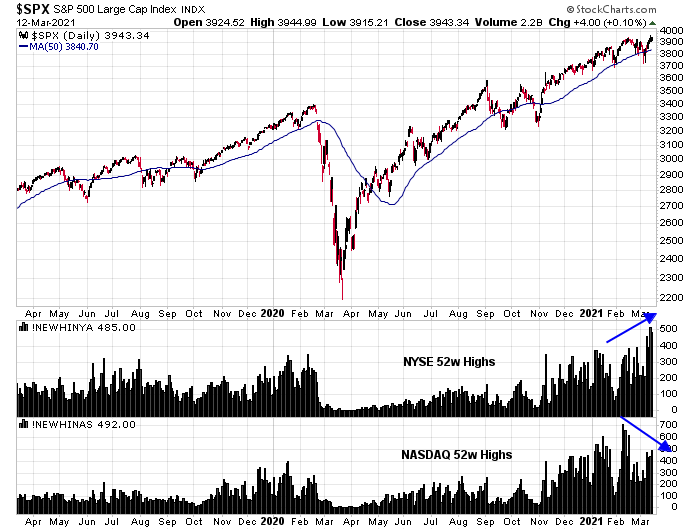
But don’t blindly buy everything. Take a look at how stock market internals have responded. NYSE 52-week highs have been surging, while NASDAQ new highs have decelerated. The momentum is flowing away from last year’s growth stock and technology winners into value and cyclical stocks.
As well,
Ed Clissold of NDR Research pointed out that earnings momentum is fading for growth stocks. As the recovery takes hold, cyclical earnings growth is surging and eclipsing growth stock earnings.
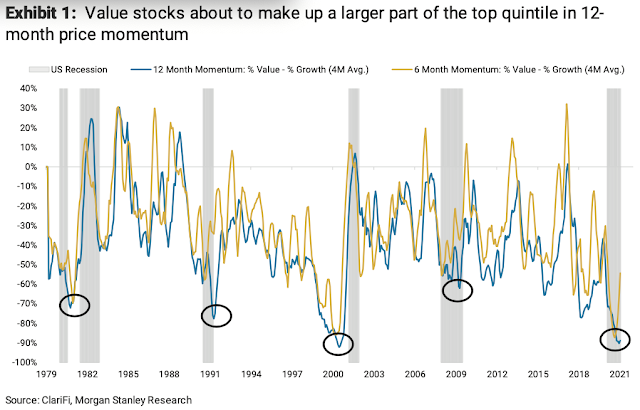
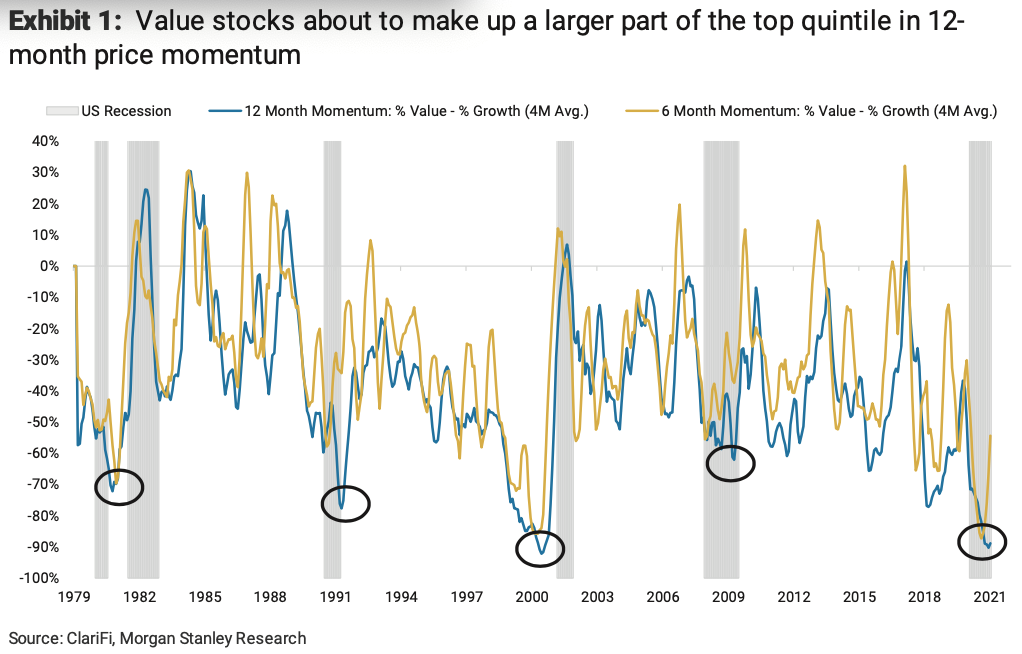
In addition, quantitative price momentum strategies are about to pile into value stocks. Morgan Stanley chief US strategist Mike Wilson stated that stocks with the greatest 12-month price momentum will change as we pass the anniversary of the COVID Crash last March. Quants seeking to buy the price momentum factor will rotate from growth stocks to add value sectors like banks and energy.
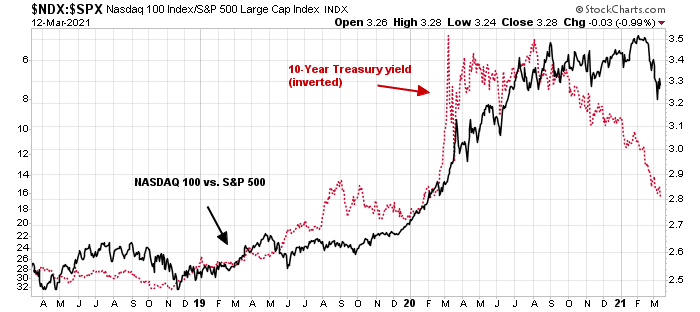
Here is another headwind for growth stocks. Growth stocks are partly yield duration plays inasmuch as they are more sensitive to changes in bond yields. The relative performance of the NASDAQ 100 has shown an inverse correlation to the 10-year Treasury yield.
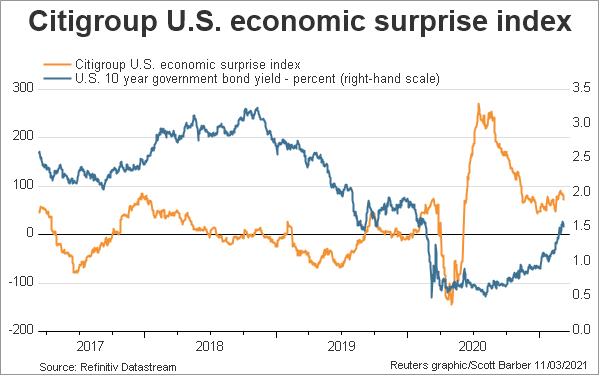
As the news from the economic reopening and recovery improves, the Economic Surprise Index has risen and it is putting upward pressure on the 10-year yield.
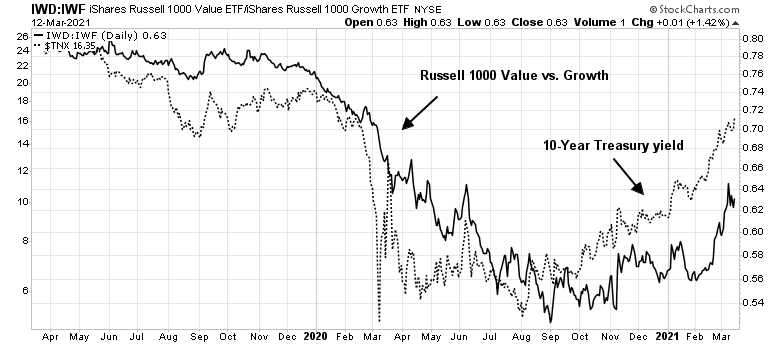
However, value investors shouldn’t be spooked by rising rates. The value/growth ratio has been highly correlated to the 10-year Treasury yield. Rising yields represent a signal of better economic growth, which benefits value and cyclical stocks.
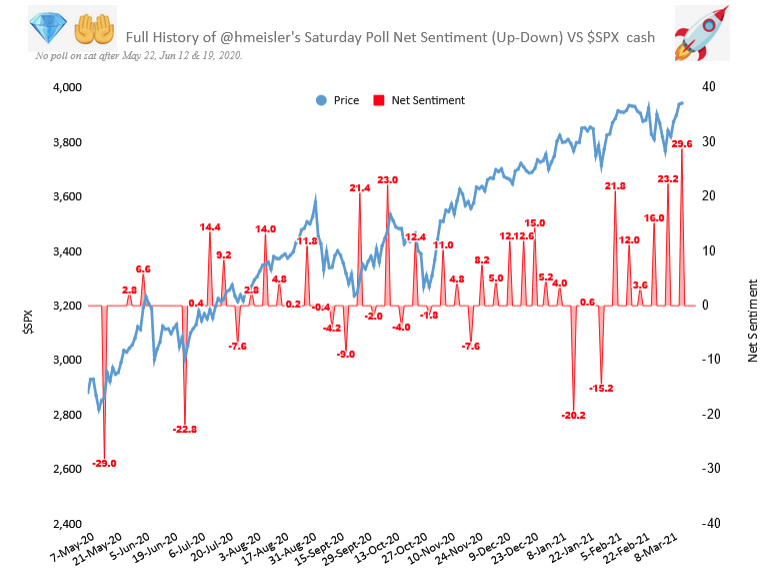
Sentiment supportive of gains
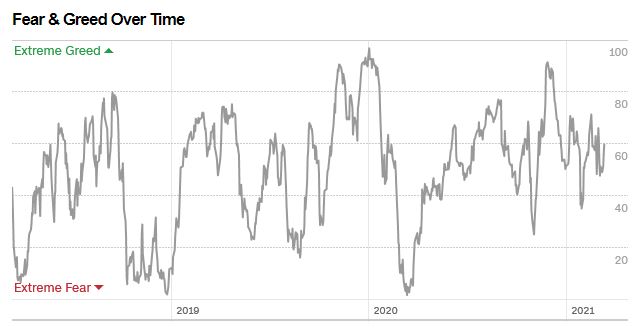
In the face of strong momentum, sentiment models are not extended and supportive of further gains. The
Fear & Greed Index is in neutral and it has a long way to go before it reaches a greedy reading.
Willie Delwiche observed that the spread between the Investor Intelligence sentiment ratio and the AAII ratio is near a historic low. Mom and Pop investors are more bullish than the professionals. Such episodes have tended to resolved bullishly in the past.
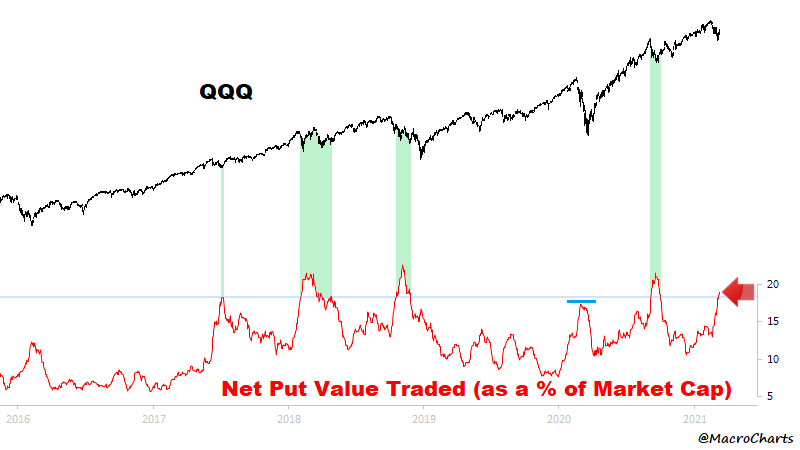
Macro Charts observed that growth investors have panicked. QQQ put option activity have spiked to levels consistent with past market bottoms.
The recent stock market pullback also panicked the NAAIM Exposure Index, which measures RIA sentiment, into a buy signal. This is a powerful contrarian model that has flashed only one false positive (in early 2008) since 2007. If history is any guide, expect a 5-10% advance in the S&P 500 over the next two months.
The combination of positive price momentum and skeptical sentiment is a strong bullish setup for higher prices.
Value/growth strength can continue
In the short-run, the value/growth reversal appears extended, especially among small-caps. But don’t be afraid to buy value when it dips against growth.
As an example, take a look at the relative performance of financial stocks. The relative performance reversal in this sector is global in nature, and the recovery does not appear overly stretched at all.
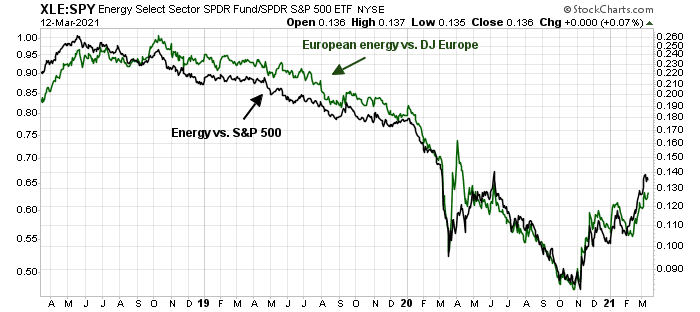
The relative performance recovery in energy shows a similar global pattern.
In the short-run, however, the S&P 500 is wildly overbought and it likely needs a few days to take a breather, either in the form of a mild pullback or sideways consolidation.
In conclusion, there is nothing more technically bullish than a market reaching new highs. My inner investor is bullishly positioned in accordance with the buy signal from the Trend Asset Allocation Model. Price momentum is shifting away from growth stocks, which were the winners last year. While the market may be extended in the short-term and a pause in the advance would not be surprising, investors should not be afraid to buy the dip with a focus on value and cyclical names.


https://quantifiableedges.com/opex-week-by-month-and-the-2020-impact-on-march-stats/
Hanna probably breaks it down by day of the week on Opex weeks as well, but I don’t have access to that data.
Looks good.
Thanks Cam for the analysis and helping me get ahead of the curve. It’s been especially helpful this past year, making what has been a stressful time less stressful on the financial front. Looking forward to the party this summer!
Exactly two weeks ago, Cam was looking for ‘a period of choppiness and growth to value rotation in the coming weeks.’ We got one.
He was also looking for a washout in small investor sentiment. We got that too, in the form of a brutal selloff in the high-beta names. Even bitcoin sold off the first week of March.
The 56-week rule seems to be playing out.
I’ll be looking to buy the usual suspects on weakness. IXC. PICK. VTV/VVIAX. EFV/VTRIX. VEU/VTIAX. VWO/VEMAX. +/- RSP if the SPX hits an attractive buy point. I’m not averse to buying growth as tactical opportunities present themselves.
Additional recommendations appreciated.
The whole scenario is a little more nuanced than shown on the surface. So a rolling 2-yr return average approach probably makes more sense in determining growth/value weighting ratio. This also applies to small/big caps weighting ratio. I know a few people running funds employing this 2-yr average approach. It basically is 2-yr mean reversion. Data analyses confirm validity this approach. Sure there are individual names running at different frequency, but most of the names more or less follow this 2-yr approach.
Then again the Market is not known for being logical, especially now. I am pretty sure many trend following algos are ready to go once vix is trending below 20 and stay there. So just follow Ken’s lead: buy whatever is moving and periodically take profits and reload. Don’t think/read too much. It does you no good.
Canada (EWC) is an interesting. It has a high weighting in banks, energy and mining and low in technology. It is rising in my momentum rankings. They just announced that almost three million people got jobs last month. They are a tenth the size of America so imagine if the was a post of three million new jobs in the U.S. last month. The Canadian/US ratio thrives in a cyclical world. Stimulus is off the chart and the Central Bank is talking the same game plan as the Fed.
OK, thanks.
question – can the spx move higher if the qqq is moving lower or trending sideways?
That’s one reason I would opt instead for RSP.
I’m guessing that most of us do not qualify for stimulus payments, and will in fact end up indirectly subsidizing the payments via higher taxes or lower credits in the future. Capitalizing on higher prices in the stock market which will be driven in part by the stimulus payments is one way to offset those future tax increases. At least, that’s how I see it.
Quit your salaried job. Form an LLC and move the domicile to Nevada. Get a competent accountant (preferably a tax attorney) and devise a system which will limit profit and enhance the liability (championed by John Malone and glorified by Jeff Bezos). Moreover bargain with IRS about tax payment.
Starters in EFA/ KRE/ ASHR/ FXI/ IXC/ PICK.
Small position in X.
I like the Nasdaq here, but will shift to an equal-weight position-> starter position in QQEW.
Starters in VTV/ EFV.
Starter in EEM.
Starter in RYSPX at the 730 am window.
Taking a different approach to reopening positions this morning. Basically, rather than open positions with a plan to flip into strength, I’m trying to build positions with a longer time frame in mind. Which doesn’t preclude changing my mind at any time, of course.
Starter in XLE.
XLI.
Adding here to most positions.
XLF.
Adding a couple of equal-weight positions.
KBE (equal-weight banks)
XBI (equal-weight biotechnology)
Reopening NIO/ PLTR.
Reopening VTIAX/ VTRIX/ VVIAX/ VTSAX/ VEMAX at the close.
Looking forward to adding over the few days either on weakness OR on strength.