Preface: Explaining our market timing models
We maintain several market timing models, each with differing time horizons. The “Ultimate Market Timing Model” is a long-term market timing model based on the research outlined in our post, Building the ultimate market timing model. This model tends to generate only a handful of signals each decade.
The Trend Asset Allocation Model is an asset allocation model that applies trend following principles based on the inputs of global stock and commodity price. This model has a shorter time horizon and tends to turn over about 4-6 times a year. In essence, it seeks to answer the question, “Is the trend in the global economy expansion (bullish) or contraction (bearish)?”
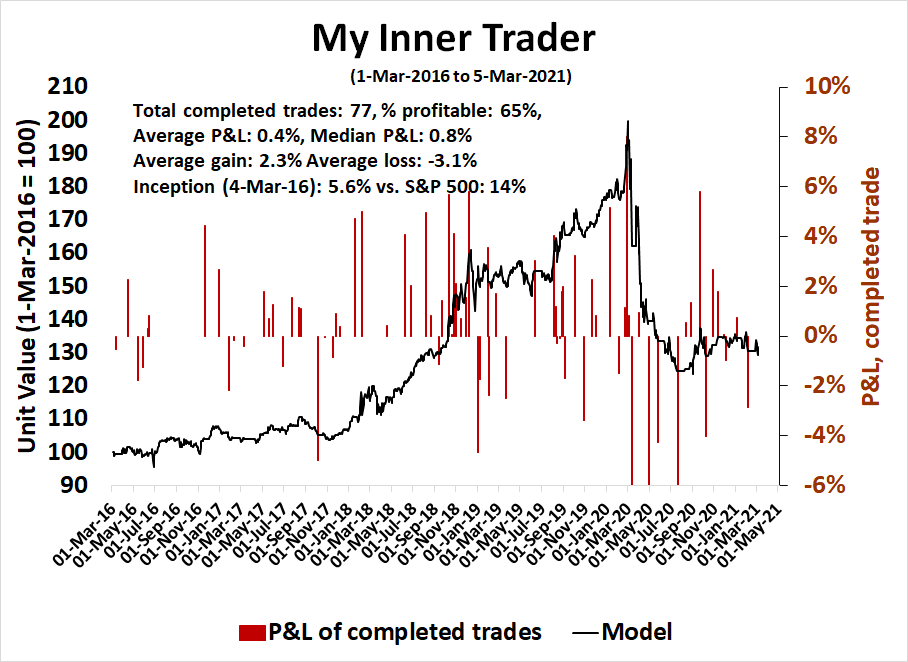
My inner trader uses a trading model, which is a blend of price momentum (is the Trend Model becoming more bullish, or bearish?) and overbought/oversold extremes (don’t buy if the trend is overbought, and vice versa). Subscribers receive real-time alerts of model changes, and a hypothetical trading record of the email alerts are updated weekly here. The hypothetical trading record of the trading model of the real-time alerts that began in March 2016 is shown below.
The latest signals of each model are as follows:
- Ultimate market timing model: Buy equities
- Trend Model signal: Bullish
- Trading model: Bullish
Update schedule: I generally update model readings on my site on weekends and tweet mid-week observations at @humblestudent. Subscribers receive real-time alerts of trading model changes, and a hypothetical trading record of those email alerts is shown here.
Subscribers can access the latest signal in real-time here.
Momentum crashes, S&P 500 wobbles
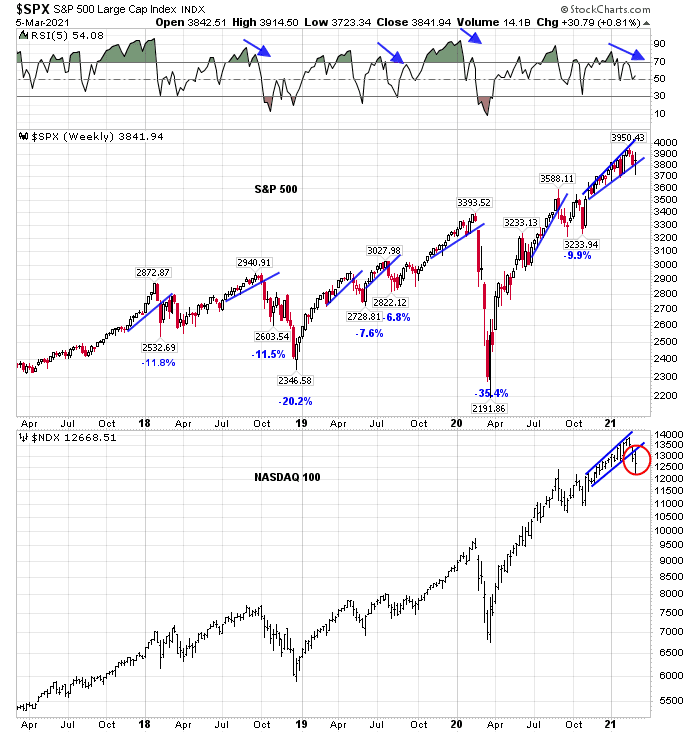
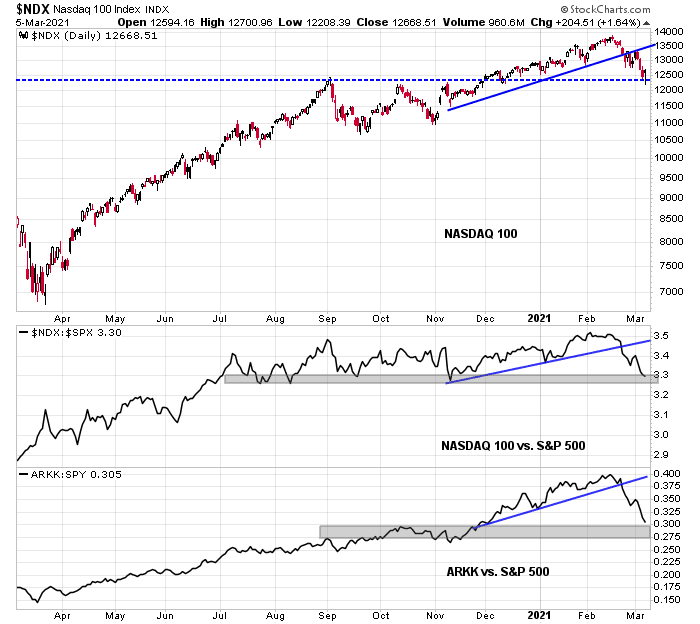
I have been warning for the past few weeks that sentiment was overly frothy and due for a reset. The reset finally began in the last two weeks. The weekly S&P 500 chart shows the index fell, but held a rising trend line support after the 5-week RSI flashed a negative divergence for most of 2021. The high-flying momentum stocks, as represented by the NASDAQ 100 (NDX), were not as fortunate. NDX violated its rising trend line indicating significant technical damage has been done.
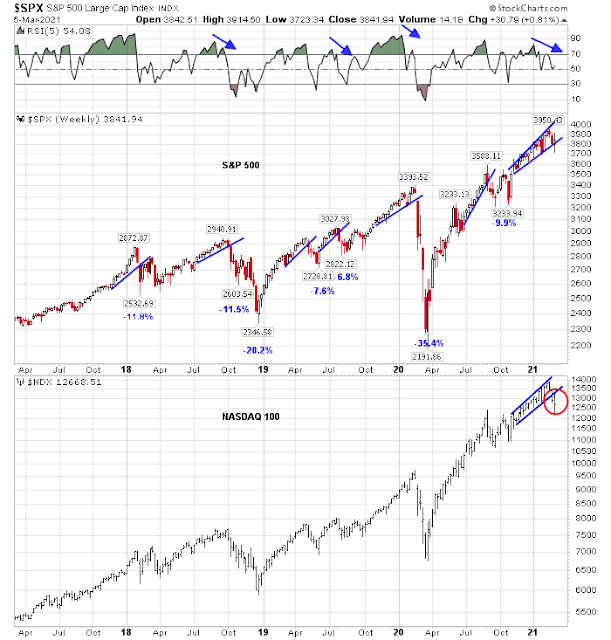
At its deepest, the S&P 500 was -5.7% off its all-time highs. The carnage in the high-octane NASDAQ 100 was even worse. That index was off -11.3% on a peak-to-trough basis indicating a definitive loss of growth stock leadership. As Big Tech comprise nearly half of S&P 500 weight, this has important consideration for the overall market direction.
However, the short-term market action indicates an oversold market poised for a relief rally.
The momentum and growth stock massacre
The carnage can be seen mainly in the price momentum factor, which buys recent price winners. There are four momentum ETFs (MTUM, JMOM, PDP, QMOM). No matter how momentum is measured, the relative performance of this factor has crashed in the past two weeks.
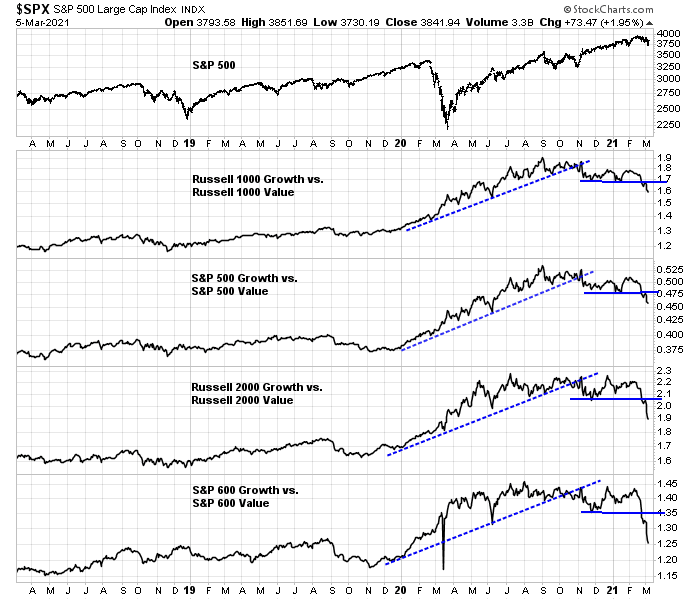
The same can be said of growth stocks. For several years, growth stocks have been the market leaders, but the growth and value relationship reached an inflection point at about the time of Vaccine Monday in November when Pfizer announced positive news on its vaccine by trading through a rising relative trend line. The growth to value ratio recently broke down by confirming the dominance of the value style last week.
The growth-heavy NASDAQ 100 is rolling over. Its performance relative to the S&P 500 is nosediving, and so is the relative performance of the speculative growth ETF ARKK. However, NDX and ARKK are all trading at or near absolute and relative support.
An oversold market
In the short-term, the market’s action is oversold and a relief rally may have begun on Friday. Let’s begin with the bond market, which sparked the latest round of market weakness. TLT, which represents the Treasury long bond, is flashing a positive 14-day RSI divergence on high volume, indicating positive momentum on capitulating volume.
IEF, the 7-10 year Treasury ETF, is showing a similar constructive pattern.
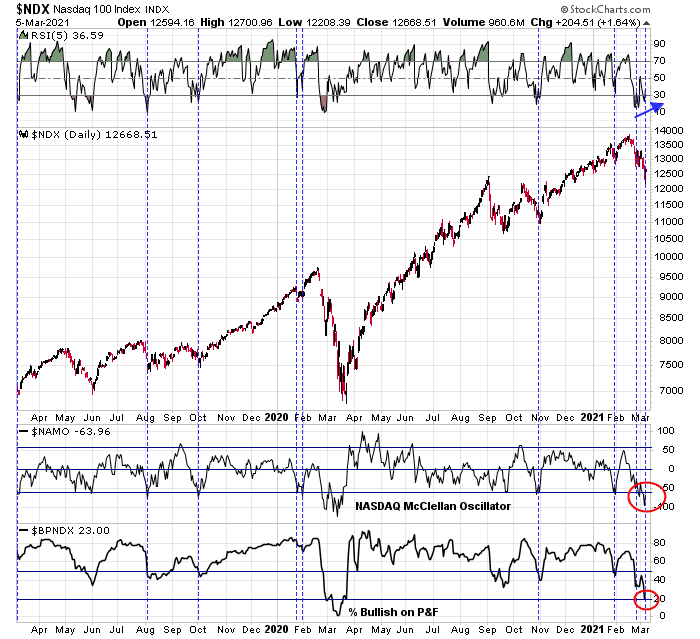
The NASDAQ 100, which bore the brunt of the selling, is also exhibiting a positive 5-day RSI divergence. As well, the NASDAQ McClellan Oscillator (NAMO) has reached a second oversold reading in the space of a week. The last time this happened, which was in January 2020, the index bottomed and took off to its ultimate peak in February when the news of the pandemic sideswiped all risk assets. In addition, market breadth such as the percentage of stocks with point and figure buy ratings have reached oversold levels.
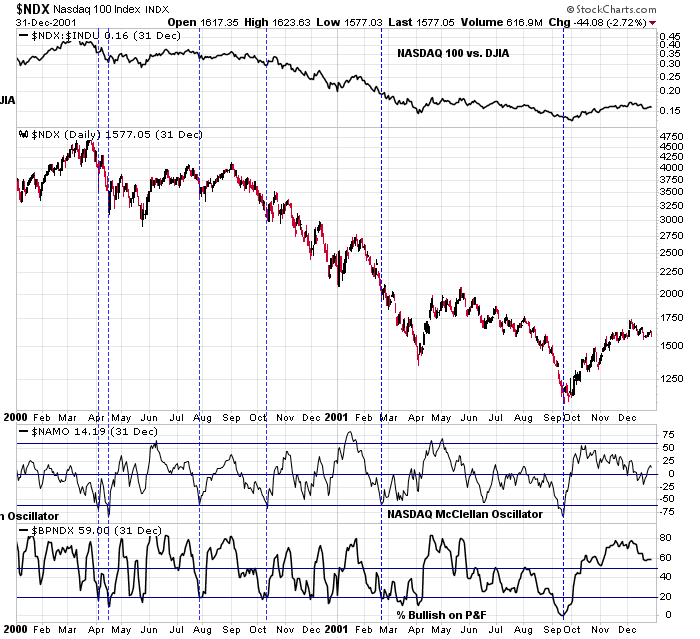
Based on the thesis that growth stocks have shifted to a secular period of underperformance, I analyzed the NAMO and percentage bullish indicators during the 2000-2001 Tech Wreck period when the dot-com bubble burst. Based on a study of that difficult period for growth stocks, I found the NASDAQ 100 always staged a short-term relief rally when NAMO became oversold.
Sentiment: Not out of the wood
Before investors rush out to buy the dip on Monday, sentiment models have not sufficiently recycled to indicate a major bottom just yet.
The latest Investor Intelligence survey shows a pullback in bullish sentiment, but bearish sentiment has not spiked to levels normally seen at durable bottoms.
Similarly, the NAAIM Exposure Index, which tracks the sentiment of RIAs, has fallen to 65% from a recent high of 110%. Readings have not fallen below the 26-week lower Bollinger Band, which is the level when my sentiment model flashes a buy signal, though there are no guarantees that sentiment will necessarily reach those levels.
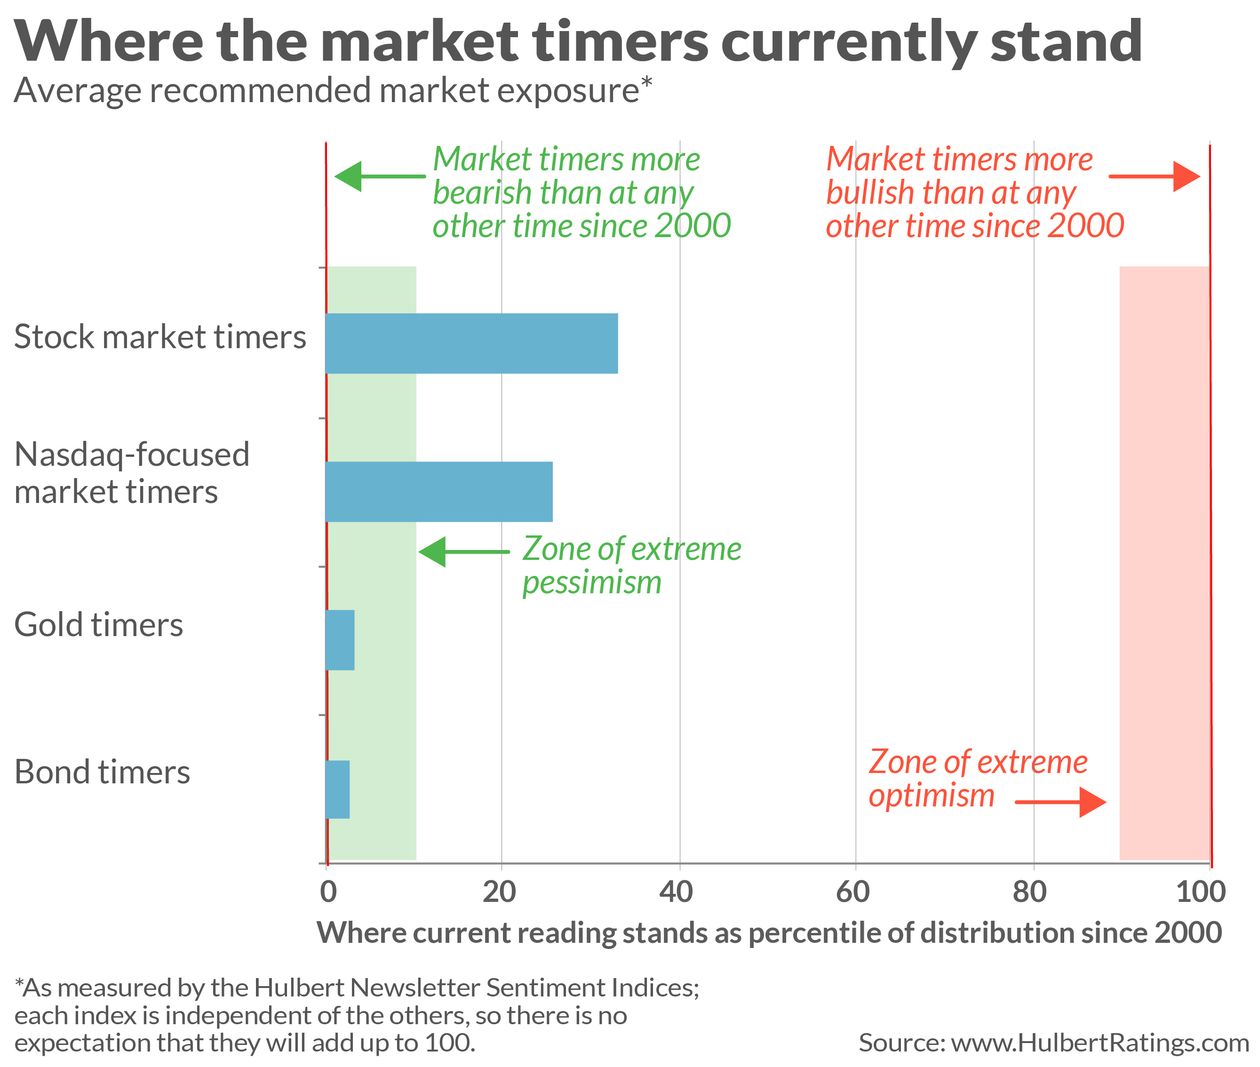
Mark Hulbert‘s newsletter sentiment models show that while equity sentiment is low, they are not in the extreme pessimism zone. However, gold and bonds are washed out and poised for rallies.
In summary, equity sentiment models can be best described as constructive. There isn’t enough panic just yet.
Buy the dip, and sell the rip
In conclusion, the downtrend for the market and growth stocks has been confirmed, but conditions are sufficiently oversold that a relief rally is imminent.
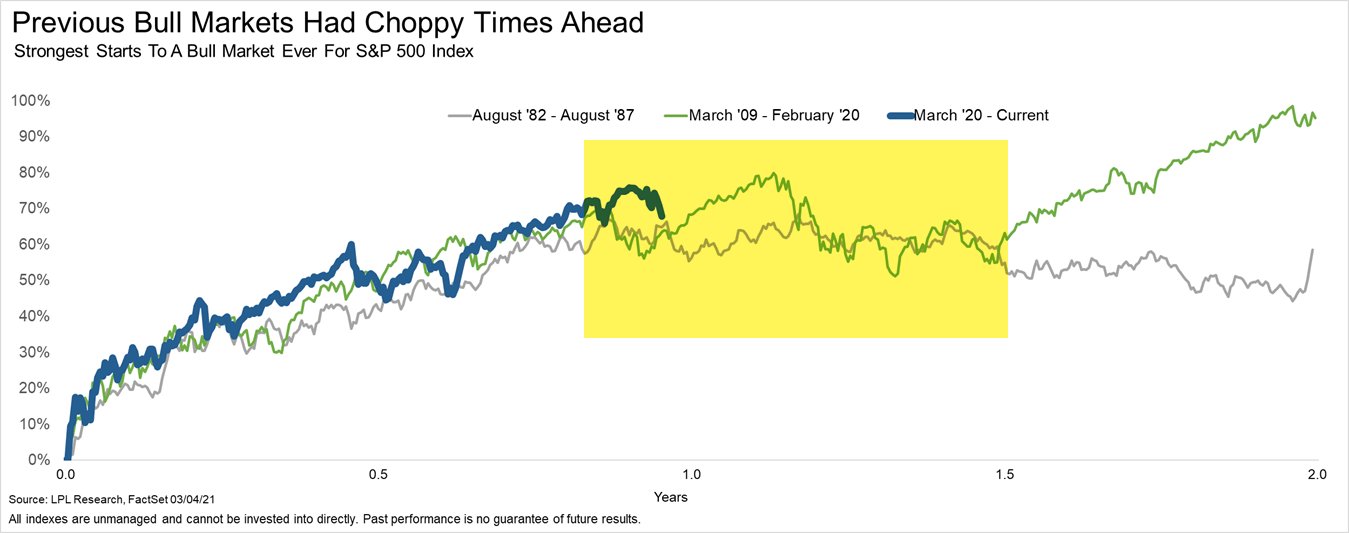
Ryan Detrick of LPL Financial offered the following template for the market. If the current bull market follows the pattern of the two strong bull markets that began in 1982 and 2009, it would begin to tire and consolidate about now.
However, market averages are deceptive. Investors should use rallies to raise cash from the sale of growth stocks rotating into value stocks on weakness. Proshares has a Rising Rates ETF (EQRR) that I would not recommend buying because of its minuscule assets and lack of liquidity. Nevertheless, its sector weights are tilted towards value and cyclical sectors and reflective of the new market leadership, and its relative performance is revealing of what investors should expect in the new market regime.
Disclosure: Long TQQQ


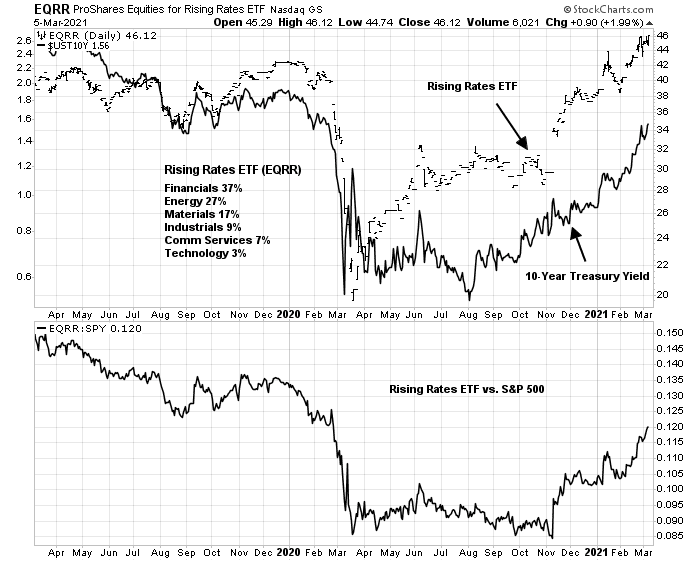
Regarding the liquidity of EQRR, consider this: https://sumgrowth.com/downloads/ETF-Liquidity-Myth.pdf
Price Momentum is my game.
The momentum ETFs rebase about twice a year and their price change look back can be long.
Let’s check out the big MTUM. It rebalances in May and November while using a combination of a six and twelve month look back.
So in November it added best performers from May 2020 and November 2019. It’s no wonder then that they have zero energy shares and 1% in financials both of which are huge outperformers since the November Vaccine Twist. The other momentum ETFs are similar.
Investors who buy momentum ETF in the hope of owning the new outperformer don’t know about these infrequent reshuffles and long lookbacks. We have to wait until after the May rebalance on MTUM for them to own energy or financials.
Thanks, Cam. If I read your comments correctly, then:
(a) NDX appears ready for a ST relief rally. Hulbert’s ST market exposure index among Nasdaq-focused newsletters supports that thesis on a ST basis, but in the longer term exposure levels are likely to fall much further. Buy early and sell quickly. In my case, buying the early decline on Friday was prescient but closing positions in the afternoon was probably premature. So I’ll need to find another buying opp.
(b) Gold and bonds may be poised for more durable rallies. I’ve been burned on bonds twice. Although one-day trades in TLT and GDX turned in minor profits on Friday.
(c) Sentiment levels in general are far from washed out, even in the NDX. Maybe another six months of volatility.
(d) Transition from growth into financials/ energy/ materials/ industrials.
Re next week, my questions would be:
(a) If growth is sufficiently oversold to support a relief rally, then the best risk/reward lies in buying further weakness in the NDX. Based on the charts above, we might target sell levels when $NAMO recycles to ~+50 – is that reasonable?
(b) Where does that leave value stocks? Are they now overbought? For instance, I don’t feel compelled to immediately reopen positions in XLE or XLF.
Overall, I see global markets on shaky ground and while holding cash over the weekend is likely to hurt me on Monday (I anticipate a gap-up), it’s not the worst position to be in. (I had a +2% day on Friday – historically, cashing out immediately has probably been the right move 60% of the time. The other 40%? Generally a decent pullback will materialize within a week.)
We closed Friday @ 1.568 on the Ten year T note. This is near term high and also resistance. Having said that, I can just about see Balanced funds starting to move money into fixed income say around 1.75%, creating further headwinds for stocks.
I suspect, 1.57% is likely to be a pit stop to 1.75 and 1.96%.
To be sure, Junk bonds are still holding up (JNK, HYG), so liquidity is flowing well in the system. Sure, NDX may be at support, but the gravitational pull to 11k seems about right (see above graph). Sure, we bounced off 12500, on the NAZ, but 13k seems resistance which is where we are now.
RxChen: I like your 60 cash 40 value portfolio.
At some point bonds will become attractive. hard to say when – an ‘attractive’ interest rate is a moving target.
I have a so-called pension plan at work. It’s a virtual account into which the company contributes 6% of my income each year, and is guaranteed to grow at 5% a year (until the GFC in 2008, it was guaranteed to grow at 6% a year – so many of us referred to it as the six-six plan). How do the plan administrators fulfill the 5% obligation? That’s what I’d like to know! Right now, a ‘risk-free’ 5% annual return is gold. If I could invest 60% of my portfolio into a vehicle at that rate for the next six months, I’d do it in a heartbeat.
rxchen2: You have a job? Other than day-trader?
Impressive flexibility in your work environment, I guess.
Haha, that’s right. I have a great job that I love and may continue with, not unlike some of the 90-year-old+ Japanese guys I’ve read about.
There are two keys to happiness. The right job, and the right wife. If you’re blessed with that, you can handle just about anything of life’s setbacks/difficulties.
‘any of’
Then I’m batting .500.
Even better than Ted Williams!
lol.
You know, honestly I’m not a day trader. I only started the ST trading maybe a few months after the market crash last year. I attribute the change to the unpredictable cross-currents in the market during that time. We now have a better handle on much of it. I anticipate transitioning back to much longer holding periods later this year.
One option re the NDX is to simply wait for the crash to play out. Then buy back in. That one move could theoretically make your year.
My Dad had the ultimate retirement package when he taught at Michigan. For every $1 he contributed to his retirement fund, the university contributed $3! I still can’t believe it. Michigan also provided post-retirement health care benefits for both him and my Mom. In addition, they were able to purchase LTC insurance from MetLife at premiums fixed at a few thousand per year.
I’m guessing that packages like that were unsustainable after his generation.
What does my company offer? A 401k/403b with a 3% match. The virtual pension plan mentioned earlier. No post-retirement health care benefits.
My back-up plan?
(a) Retire at 70 (or even later, if health permits) in order to maximize Social Security payments.
(b) Self-fund the equivalent of a LTC insurance plan.
(c) Self-fund the equivalent of post-retirement benefits to pay for expenses above and beyond what Medicare will cover.
In order to accomplish all of the above, I have maximized retirement benefits for my entire working career and invested well. However, I have mainly worked my *** off for 40 years- if I can do it for another 5, I hope to establish safety nets for our kids as well. The cost of living in the Bay Area makes it difficult to either buy a home or retire comfortably. But we’re surrounded by family and friends, and we’ll do what it takes to keep our families here.
Here is an unusual happening with another factor ETF, High Beta SPHB. This owns the 100 most volatile stocks in the S&P 500. I watch it and recently it’s been acting weird.
I thought it should be plunging with all the tech stocks crashing but no. It hit a new high on Friday????
I checked in further and found its rebase was in February and the new high beta stocks in it are extremely Value oriented.
My Factor research has come to the conclusion that that these ever changing Factors like Momentum, Low Vol, High Beta are not true Factors. They are ever changing indexes of the true factors Value and Growth. Calling them Factors is like saying the S&P 500 is another industry group. No, it’s an index of industry groups that each have their own life.
https://www.cnbc.com/2021/03/06/covid-stimulus-update-senate-passes-1point9-trillion-relief-bill.html
When you stop to consider what’s really going down here – it’s just incredible. Leaving aside for the moment the qualifying conditions, that’s almost 6k per US resident in direct or indirect benefits, or 24k per family of four. They’re not holding anything back this time.
Was thinking with some consternation about the amount of taxes I’m going to have to pay upon being forced to take RMDs in a couple years.
It dawned on me that I could take the equity out of my condo and live on that, and donate most of my RMD tax free to my favorite far-right 501c3’s. (e.g., acri.org).
Would have been great if I’d have this epiphany a few months ago when rates were lower, or so I thought.
Turns out I can borrow (‘refinance’ my $0 mortgage) 500K at 3.00%, no points, and an $840 credit back at closing.
lol my first mortgage 40 years ago was 14%.
One possible catch: Notwithstanding mid-seven figures in retirement accounts, I may not show enough ‘income’ to qualify. Apparently I need to set up some periodic distribution that looks like regular income, and then I can cancel it after the load goes through.
So what was the most recent ‘generational low’ for this type of mortgage?
According to this chart (scroll down) on Trulia, 30-year rates for this type of loan bottomed maybe only a .25 or .375 lower than what I’ve locked. Anybody out there know better?
https://www.trulia.com/mortgage-rates/San_Diego,CA/?auto=true&zip=92130&value=685000&down=185000&skip_interstitial=true&va=false&loantype=purchase&cscore=760%2B#request=ZR-SYGPVHZG
Anyway, everybody loves the 2001-7 analogy right now, I seem to recall the homebuilders did rather well back then.
And back then mortgage rates were much higher.
Nothing wrong with having to pay taxes – it just means you’ve done well!
You’re probably aware that it’s possible to gift 15k per recipient without filing a gift tax form – you may have kids/ grandkids/ nephews/ nieces that would benefit. In addition, you have a lifetime exclusion of >$11m. If you’re married, then you and your wife can gift up to $22m without paying a gift tax (at least for 2021 – who knows what Biden has in mind). So you could buy a house for your grandson/ fund a 529/ buy a Lamborghini for your neighbor and never pay a cent in gift taxes!
We’ve done loads of refis lately.
We did our 30 year fixed at 2.875 on 2 houses. It is more of a pain than it used to be, and for the self employed, it is getting harder. I look at it as a hedge on inflation. If they keep printing, then assets like homes should go up eventually. If rates go up, then house prices should initially go down (after maybe a rush to buy because rates are going up), but rentals should go up. So if house prices take a hit because inflation is 6% and mortgages are 5%, rents will go up so we rent one. Eventually costs and wages catch up and nominal prices go up.
But I just don’t see them letting this happen.
I saw a chart showing how much buybacks there has been since 2009, and you read about how some companies are raising cash for buybacks. What’s been going on with high risk bond yields over the last decade fits well with borrowing for buybacks, but what will happen when junk bond rates go up?
What would happen if all this corporate debt has to roll over the next few years at higher rates?
One thing that I noted while reading the stuff from this weekend is about growth. It seems to me that there is a world of difference between a small cap that is growing fast and a large cap. How much can Apple grow it’s sales and earnings? or NFLX?
Remember the dogs of the dow? or just luck of being in the right place at the right time….the outperforms of 2020 will most likely give up the title for 2021, it happens often, not always but often.
It makes sense to borrow as much as one can, even now, when rates are cracking higher. Hard assets like houses will likely go up in value.
I believe I’ve figured out why Cam and Ken have singled out Cathie Wood for abuse.
It’s because they can neither spell nor pronounce Chamath Palihapitiya.
jk
‘Sentiment: Not out of the wood’
…
If it looks like a bear market and walks like a bear market. -basically, I just don’t think it’s a good time to be invested.
The rate differential between the US and Europe/Japan plus the difference in the respective stock market valuation is eye-watering. In addition it sounds like everyone is still bullish on US growth stocks and trying to buy names that are down 10-20%. This still doesn’t sound like equity investors are positioned for what’s going on in bond and currency markets.
Several analysts, including Cam and Ken are on record, favoring overseas equities for the longer term, over expensive US equities.
Great rotation day!
Tepper rally faded
Not sensing capitulation.
Making good headway on sentiment, though.
I think the reopening trades are still on. There was a stunning rally in Disney today, as it got permission to open Disney in California. Let us call it the Disney Monday.
I see airlines, hotels, casinos, restaurants reopening. Does one see 5000 on the S&P 500 by end of 2022?
https://www.marketwatch.com/story/how-high-can-rates-go-this-chart-shows-this-years-sharp-climb-in-long-term-treasury-rates-11615249096?mod=home-page
We could well be in the “Roaring 20s” here! Be careful what you wish for and after a couple of decades of deflation, we could well be in for a stiff dose of inflation. This could well be an “inflation blip” and unsustained past 2-3 years. We will wait Cam to show us “inflation expectation” data. The Fed wants to run somewhat hot on inflation. We shall see how much they let inflation run. Such higher inflation would also do wonders to US debt, by debasing the USD further. The inflation wick may have been lit, quietly.
Having said that, see the Baltic dry goods index, cracking higher, into resistance. WSJ had an article how containers are being returned to China, empty from the US, to meet US demand.
https://tradingeconomics.com/commodity/baltic
Furthermore, 6-10 March is usually market bottom!!
What we are seeing here is refinancing the US consumer. We saw the same movie in 2008. Consumer got reliquified in 2008 through bankruptcies and foreclosures. Some of these Americans are now great tenants! In 2020, these consumers got actual Helicopter money!!
So, after 6 Trillion $ pandemic refinance, consumer America is flush with cash, burning a hole in their pockets. With a nascent economic recovery, 10% long term unemployment, the stage is set for a long recovery ahead of us. As rates move higher, it makes sense to back up the truck and borrow. If inflation runs hotter, corporate America gets some pricing power, adding to the bottom line. Sure cost push inflation may push input costs higher in the short term, but this may not matter as higher prices on Goods and services are passed to the consumer.
The above would ensure refinancing of corporate debt which is another mountain load of money that no one has talked about recently.
All in all, one could make a case for the Roaring 20s! So, with 28 Trillion $ US debt, we have no way but to inflate our way out of it!!!
https://www.usdebtclock.org
What am I missing here?
https://www.yahoo.com/news/soaring-home-prices-starting-alarm-195546721.html
Our great politicians want to make housing affordable for all Americans!!
“The price of lumber is up about 180 percent since April — an increase that works out to about $24,000 being added to the price of the average home, according to the National Association of Home Builders”.
Wonder if tariffs on Canadian timber is a good idea!
https://www.schwab.com/resource-center/insights/content/red-flag-day-bond-yield-spike-denting-euphoric-sentiment
A bad moon rising (or a red sky morning)? An absolutely information packed missive from Liz Ann Saunders.
Sentiment reset coming in the short term????
Reopening a few starters this morning in the extended-hours.
FXI/ ASHR/ EEM. All vastly oversold IMO.
XLU. Utilities seem to be reversing out of a one-month decline.
EWZ small.
I sense the Value/ Growth divergence may be due for a little reversion to the mean.
Biting into AAPL.
QQQ small. Will traders be selling strength again this morning, or will the market instead decide it’s time to blitz the shorts?
The market is damned good at fake-outs and frustration.
For instance, I briefly considered going long at Monday’s close, until the brutal selloff in the final minutes made it next to impossible – when that happens, there’s a better than 50/50 chance it continues into Tuesday.
I suspect (but will refrain from taking action until it actually transpires) that bullish momentum will pick up during the trading session. If it does, I plan to add long positions as opportunities arise.
I may be wrong, and morning strength will transition into another decline.
If your portfolio has experienced a drawdown recently, here are two perspectives that have always helped me:
(a) It’s not supposed to be easy. The market makes you work for the gains.
(b) The bottom line is the balance you begin with each day. Make the most of it.
Re the utilities sector – opening a position in EIX.
Adding to QQQ.
Opening a position in XLP (consumer staples).
Reopening starters in NIO/ PLTR.
KRE.
PICK.
GDX.
Taking partial profits on QQQ/ NIO/ PLTR. Will revisit.
Taking partial profits on AAPL.
Taking profits in EEM/ XLU.
Taking profits in KRE/ PICK.
You know what? I’m taking profits across the board and moving back to 100% cash.
It was a pretty good early morning workout in the market, and I’m going to walk the dog without worrying about the market.
It comes to ~+0.23%. And I’m happy with that. I can always revisit later.
Reopening EIX on the pullback (utilities).
Opening a position in TSN as well (consumer staples).
Reopening AAPL.
Reopening ASHR/ FXI.
Reopening QQQ (at a slight premium to earlier exit).
Reopening EWZ.
Opening a position in ARKK – believe it!
We’ve been focused on Value for several weeks. Maybe it’s time for a ST switch to Growth, while Value charts reset.
Reopening GDX.
Reopening XLU.
Opening a position in SMH.
Opening a position in XBI.
My strategy right now:
(a) Based on today’s upside gaps, it may appear that I’m chasing. However, having sidestepped Monday’s declines, I’m opening positions more or less relative to FRIDAY’S prices.
(b) Positions such as XBI (biotechnology) provide some diversification.
Adding a position in XLV.
I plan to end the day with the same spread I backed out of last Friday (should have opened the positions at Monday’s close, but it just didn’t seem safe).
VTIAX/ RYOCX/ RYGBX/ RYPMX/ VEMAX.
The positions will be opened at small premiums (or, in the case of emerging markets it may be a slight discount) to FRIDAY’S prices.
Emerging markets, bonds and gold remain oversold. Despite today’s rally, the NDX remains oversold. Global markets ex-US? Not exactly oversold, but neither are they overbought.
Now watch them pull the rug in the last fifteen minutes!
Looks like they pulled the rug mainly on value stocks. This market knows how to keep traders on their toes!
(a) VTIAX (Vanguard International) ended the day +0.3% above Friday’s close.
(b) VEMAX (Vanguard Emerging Markets) ended the day -1.28% BELOW Friday’s close.
(c) RYPMX (Rydex Precious Metals) ended the day +0.86% above Friday’s close.
(d) RYOCX (Rydex Nasdaq 100) ended the day just +0.99% above Friday’s close. That was a pleasant surprise.
(e) RYGBX (Rydex Long Bond) ended the day +0.79% above Friday’s close.
I’m OK with the above. It’s as if I ducked into a hotel on Monday to ride out the storm, and now picking up where I left off.