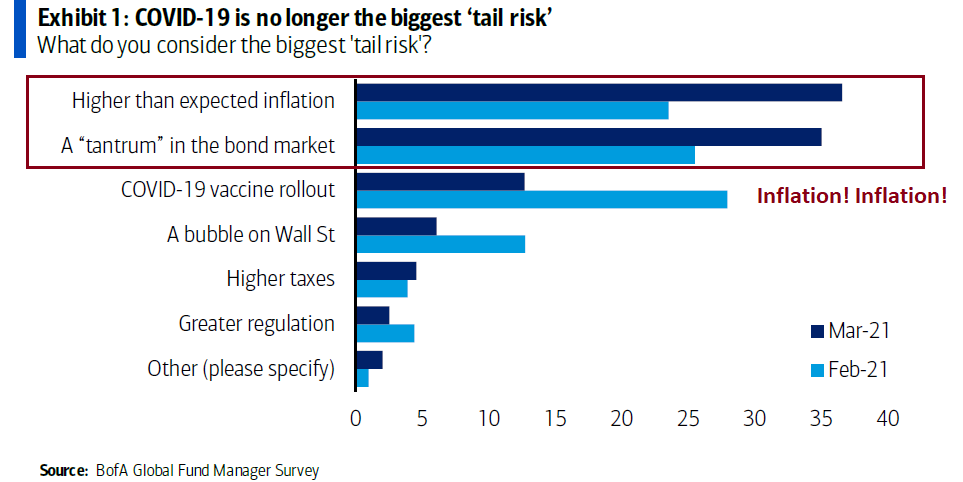
The latest BoA Global Fund Manager Survey shows that respondents believe the biggest tail-risks to be inflation and its effects on the bond market.
Are these worries overblown? How will these concerns affect asset prices?
How transitory are inflation pressures?
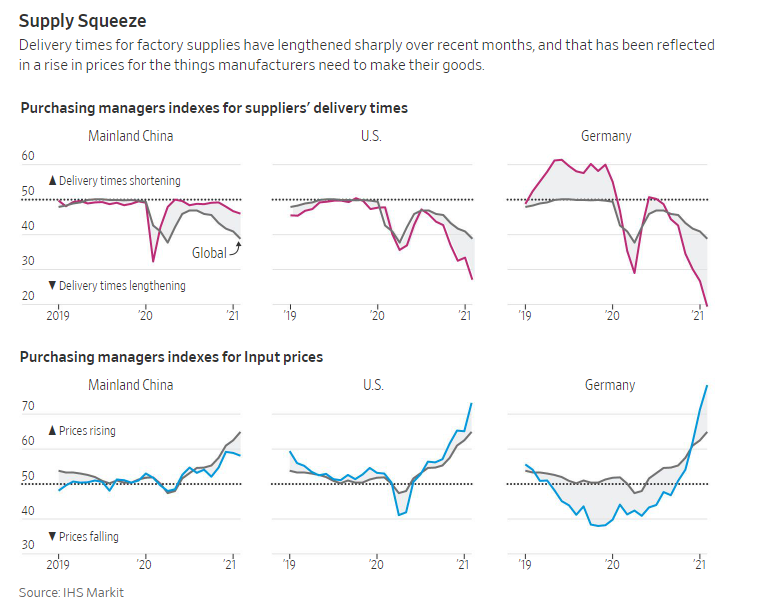
Recently, there has been a spate of reports about rising supply chain bottlenecks and their effects on input prices. As the global economy recovered, delivery delays have risen and so have input prices, which will undoubtedly put upward pressure on inflation statistics.
Indeed, inflation surprises have appeared all over the world.
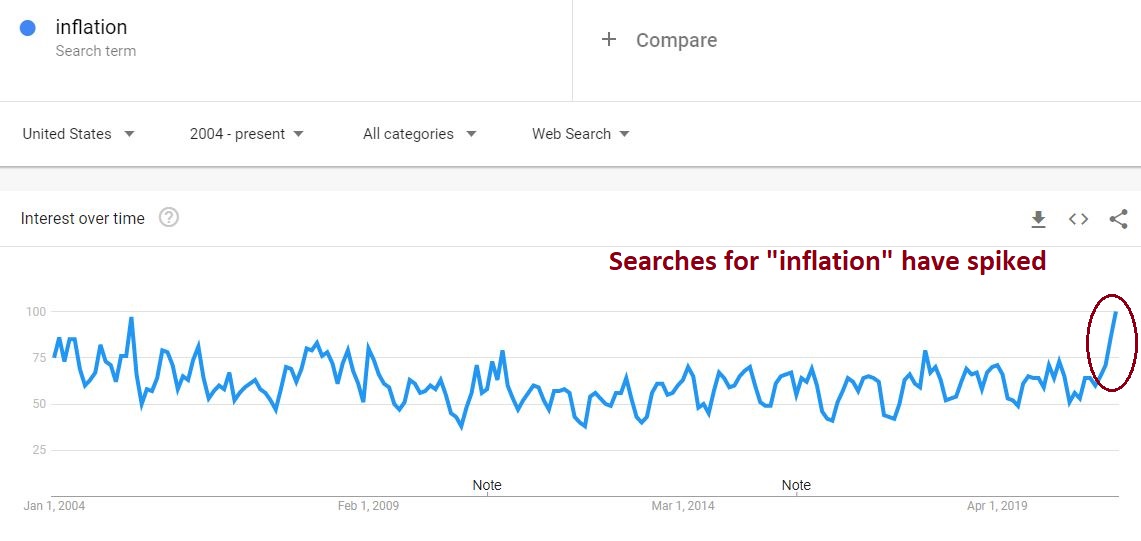
Inflation fever is not just confined to economists and market analysts, but it is seeping into the public’s imagination. Google searches for “inflation” have spiked.
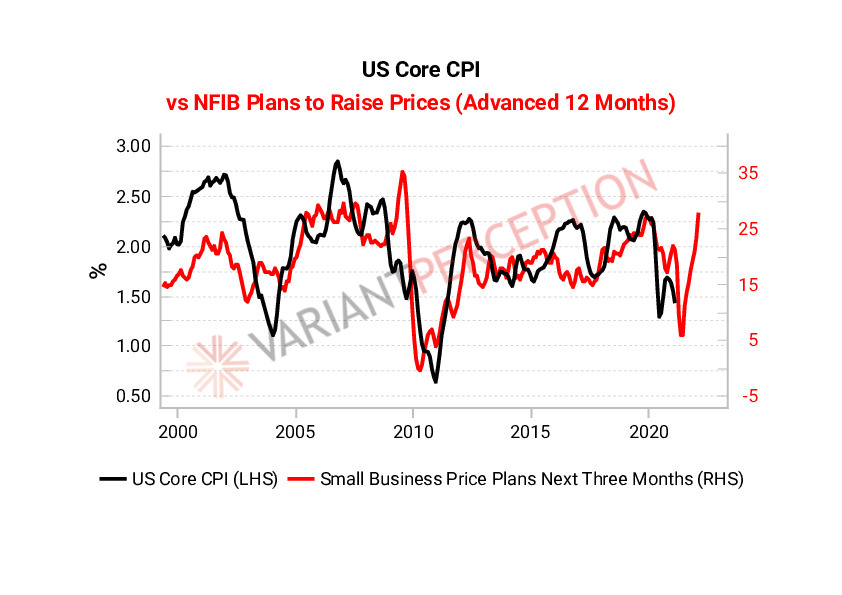
The NFIB small business survey of pricing expectations is rising. Historically, this has led to upward pressure on core CPI.
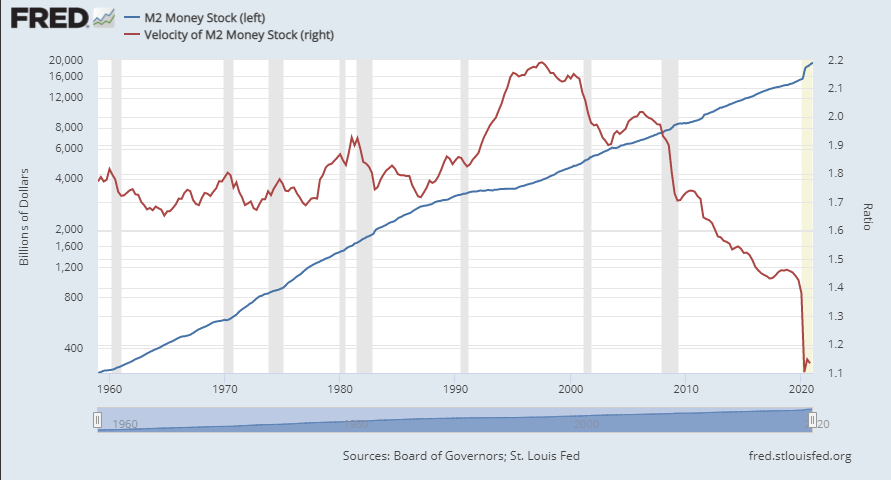
On the other hand, the economy is arguably not poised for an uncontrolled inflationary spiral. Monetary theorists believe that inflation is purely a monetary phenomenon (PQ = MV). The M component of that equation, M2 money supply growth has skyrocketed, but the V component, or monetary velocity, remains tame.
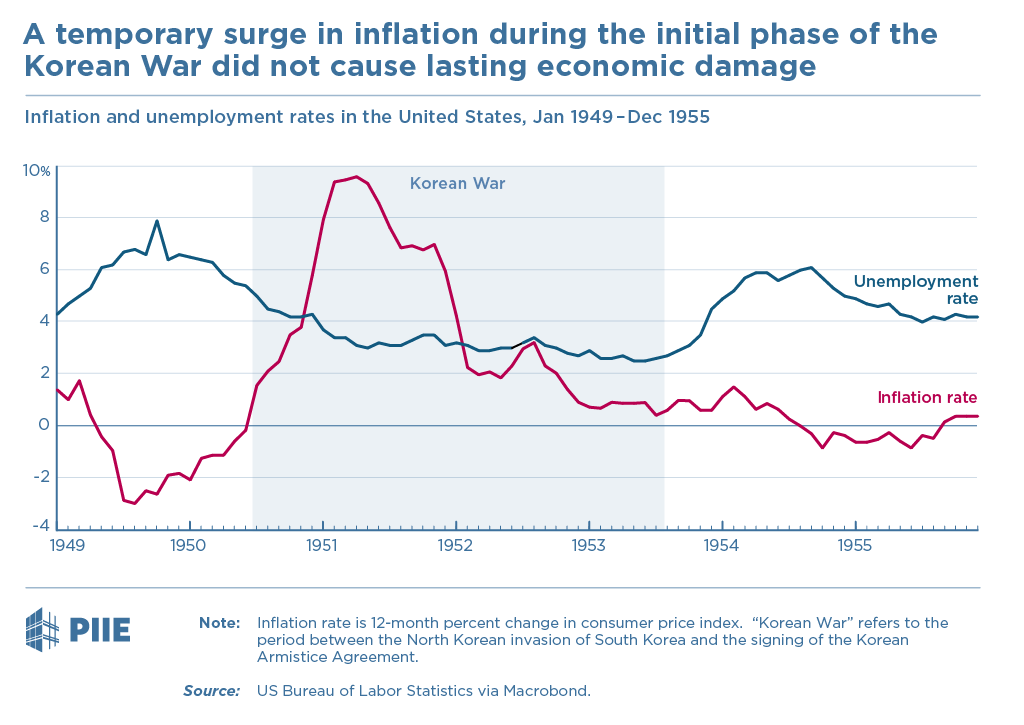
In addition, Joseph E. Gagnon at the
Peterson Institute argued that inflation fears from Biden’s fiscal stimulus program are overblown. For historical parallels, investors should look to the experience of the Korean War, not the Vietnam War. That’s because government spending during the Korean War was short-term and perceived as such. By contrast, LBJ’s Guns and Butter policy during the Vietnam War was long-term and affected expectations accordingly.
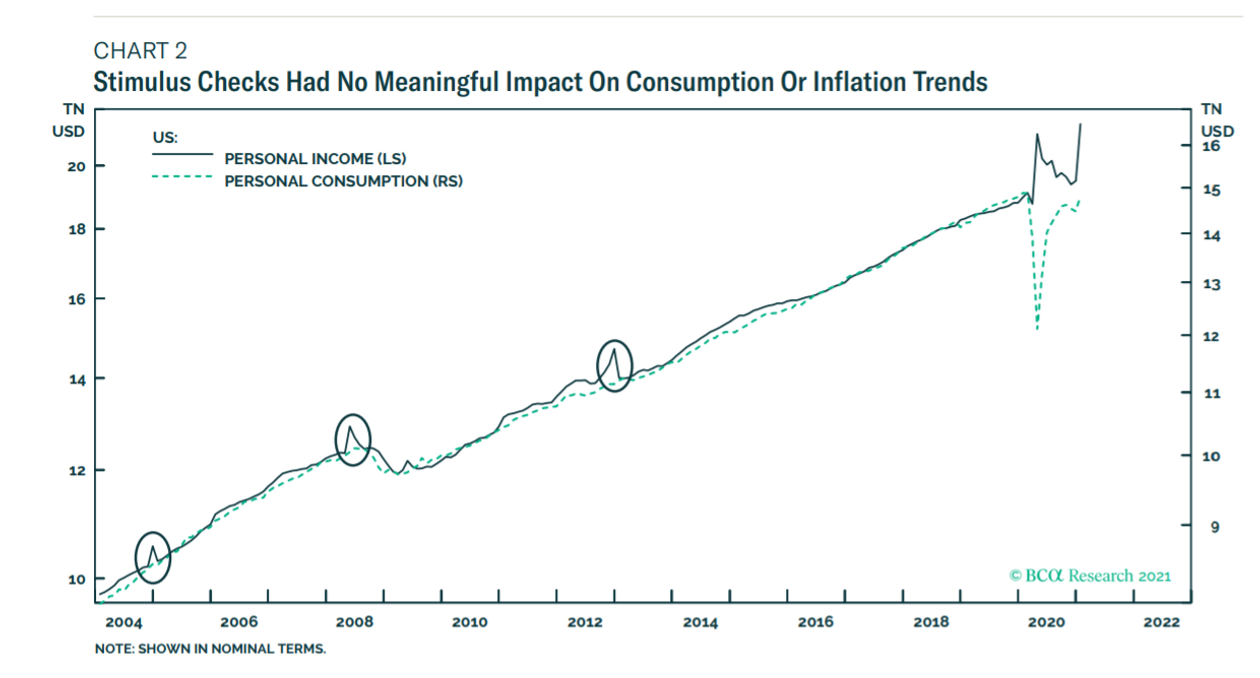
Marketwatch reported that BCA Research also came to the similar conclusion that one-time stimulus payments had negligible inflationary effects.
Dhaval Joshi, chief strategist at BCA Research, says whether the new stimulus is considered wealth or income depends on whether the household receiving it has a low or high income to begin with. But looking at past stimulus checks, there weren’t meaningful shifts in either consumption or inflation.
The Fed’s reaction function
The FOMC statement and Powell’s remarks at the post-FOMC meeting press conference made the Fed’s reaction function very clear. The Fed’s latest
Summary of Economic Projections raised GDP growth, inflation, and lowered the unemployment rate. Despite the expectations of stronger growth and inflation, the median trajectory of the Fed Funds rate remained unchanged and it does not expect rate hikes until 2023. However, the “dot plot” did show a few members raising their expectations of rate hikes in 2022.
This is consistent with the framework review that was unveiled at Jackson Hole last summer, which established that the Fed will not raise rates at the first signs of growth. It wants to see maximum employment and evidence of sustained higher inflation. Moreover, the Fed is increasingly focused on the jobs market and the effects of inequality.
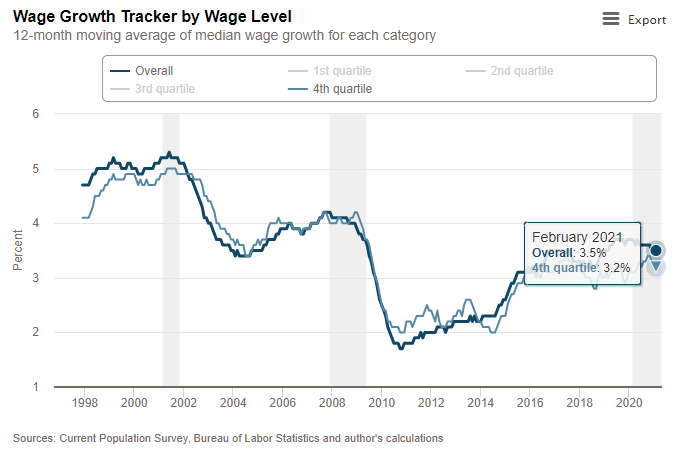
Here are some of the metrics that Powell is looking at. First, one of the components of the inflationary spiral of the 1970’s was characterized by wage growth and cost-of-living adjustment clauses in union contracts. Today, wage growth is below the pre-GFC peak. Moreover, fourth quartile wage growth is lagging the overall figure, which is widening inequality. These were metrics cited by Janet Yellen when she was Fed chair as progress towards full employment.
Keep an eye on the March 29 unionization vote of an Amazon warehouse at Bessemer, Alabama. Amazon is the second-largest employer in the US and its compensation and labor practices have profound effects all over the country. The company has successfully resisted unionization at its facilities in the past, but if unions were to gain a beachhead at Bessemer, it would be an early sign that labor is regaining its bargaining power, put greater upward pressure on wages, and be the setup for an inflationary spiral down the road.
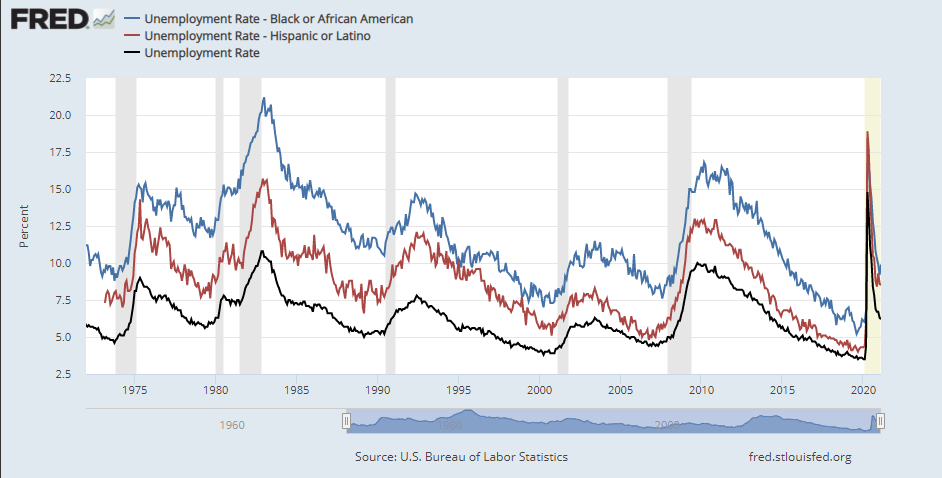
In the face of a chorus on inequality, the Fed has begun to acknowledge the uneven expansion in recent years. Powell has stated in the past that he wants to see broad-based gains in employment. Black and Hispanic unemployment rates remain elevated compared to the overall rate. More progress needs to be made before the Fed considers the economy to be at full employment and pivots to tightening monetary policy.
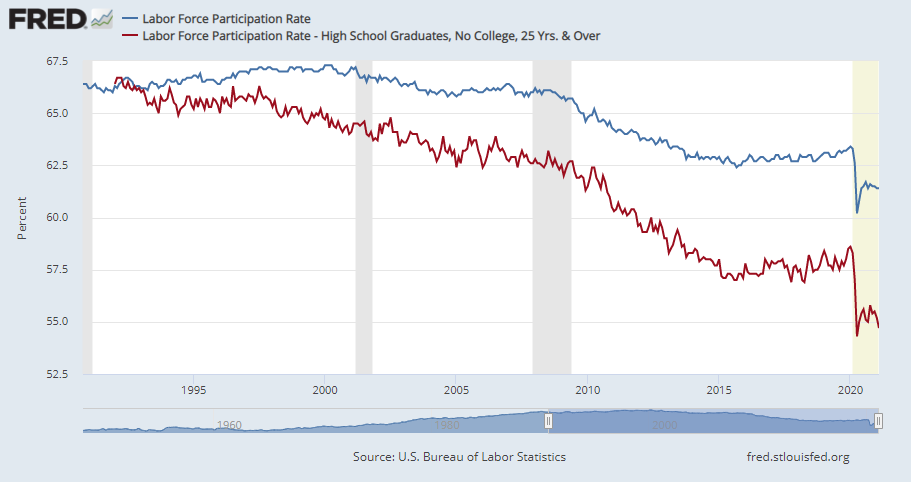
In the past, Powell has also commented on the plunging labor force participation rates (LFPR) for those without college degrees. LFPR for this demographic began widening in 1995 and it has fallen further with each successive recession. Many job seekers in this group have become discouraged and eventually gave up, leading them to stop being counted as unemployed.
Viewed from a labor market lens, Powell’s past comments that the economy is far from normal are becoming clear. The Fed will not raise rates until it sees significant improvement in labor market internals and realized inflation rates.
The market reaction
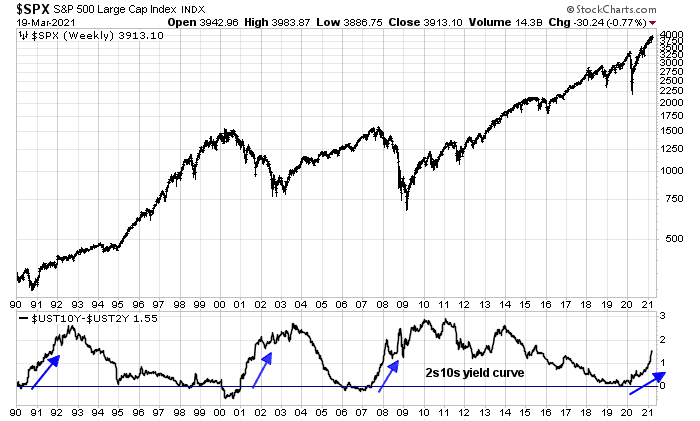
Powell made it clear last week that he expects better economic growth, rising (transitory) inflation, and no rate hikes. While the Fed has an iron grip on the short end of the yield curve, it does not control the long end. In response, the yield curve steepened and the 10-year Treasury yield surged past 1.7%.
Rising bond yields and steepening yield curves are not unusual for an economy that recovers from a recession. However, there are several differences between this recovery and past recoveries.
In the past, a steepening yield curve was the mark of a stock market top. That’s because past recessions were induced by the Fed. The Fed signaled that it would tighten, and the yield curve steepened based on expectations of more rate hikes. The recession of 2020 was not induced by the Fed, but by an external event. The Fed and other global central banks flooded the system with liquidity. As the economy began to recover from the pandemic, the yield curve steepened based on the expectation of higher growth and inflation.
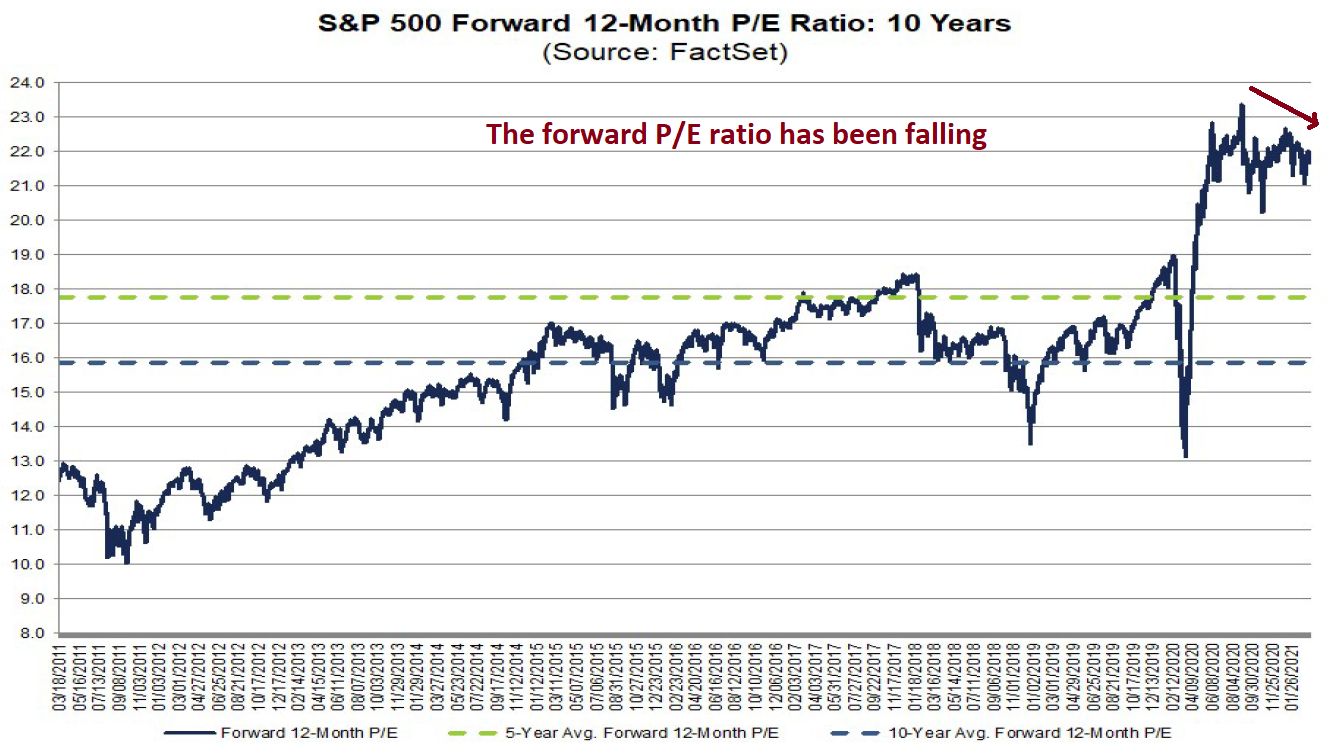
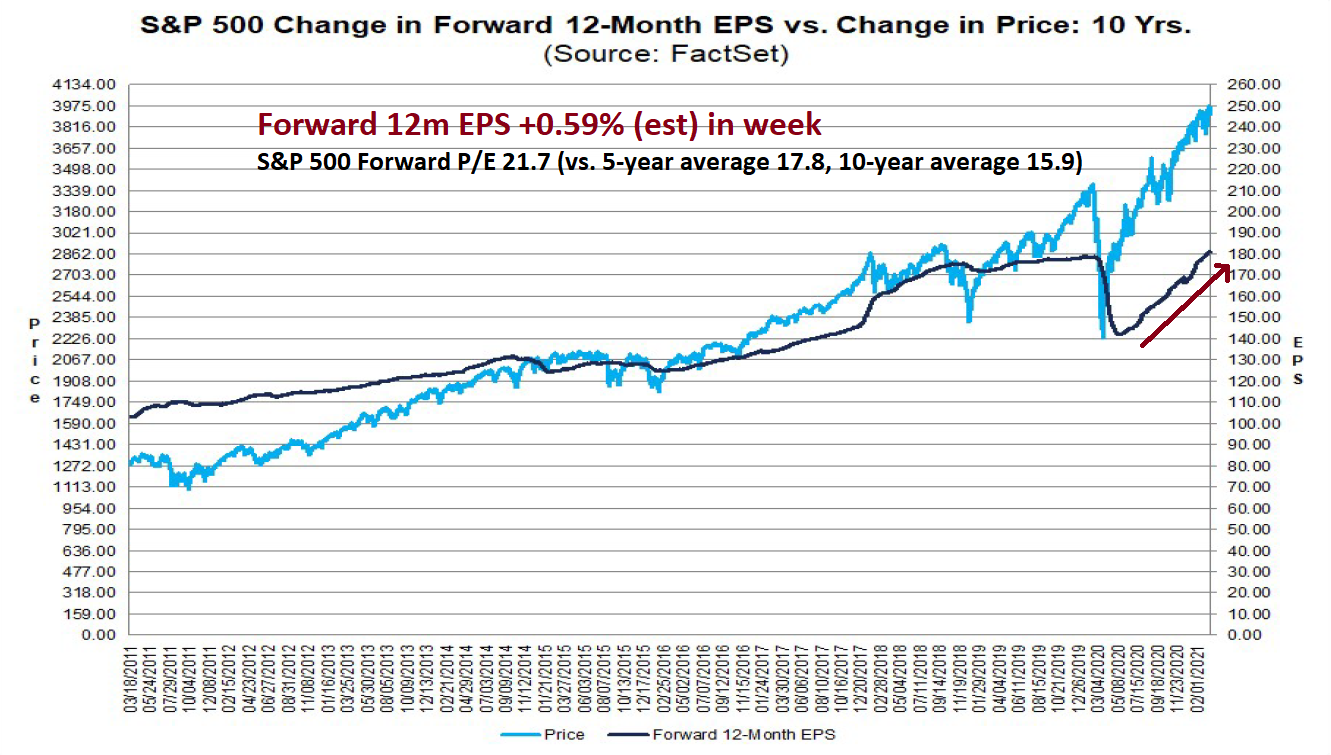
Rising bond yields will undoubtedly put downward pressure on P/E ratios. Indeed, forward P/E ratios have been falling in the last year.
However, as long as EPS estimates are rising, the bullish effects of higher earnings will offset the bearish effects of lower P/E ratios.
For equity investors, this has several implications. When growth was scarce during the recession, investors bid up the price of growth stocks. The growth premium is receding as economic recovery is becoming evident, and investors should focus on cyclical and value parts of the stock market.
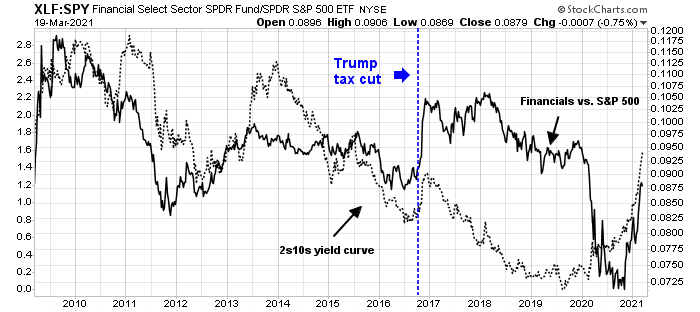
In particular, financial stocks should be a prime beneficiary of this environment. Banks borrow short and lend long, and a steepening yield curve enhances margins. This relationship has been strong in the past. The only disconnect occurred when the sector rallied strongly owing to the Trump tax cuts, which raised banking profitability. I would add that the Fed’s announcement Friday that it was allowing the Supplemental Leverage Ratio exemption for Treasury holdings on bank balance sheets to expire on March 31 should have minimal effect on the banking sector. I had highlighted analysis from Zoltan Pozsar of Credit Suisse indicating that the large banks had ample capital cushions and SLR expiry is expected to have minimal effects on their balance sheets (see
FOMC preview: Dot plot, YCC, and SLR).

The Rising Rates ETF (EQRR) is another illustration of how investors should position themselves in the current environment. While I would not recommend buying the ETF as its assets are very low and investors run the risk that it will be wound up, the underlying portfolio is heavily weighted in value and cyclical sectors, namely financials, energy, materials, and industrials.
In conclusion, Powell has made it clear that growth will be strong, inflation is coming but it is expected to be transitory, the Fed will not raise rates, and it will not engage in yield curve control. No matter what happens to inflation expectations or bond yields, equity investors positioned in value and cyclical stocks should look forward to strong returns over the next 12 months.


If inflation is supposed to be transitory, wouldn’t it be a great opportunity to buy growth (FAANG) at some point to portfolios?
Once inflation subsides, wouldn’t we go back to business as usual and back on to growth bandwagon, with a handful of stocks pulling the indices?
Tony Dwyer from Canacord Genuity just downgraded financials for the near term. To be sure, XLF, just broke out of its 2007-2008 peak of around 32$. I can see the point he is making.
Furthermore, with 10% unemployment, there is plenty of slack in labor markets. For sure, China may be facing labor shortages as I write this because of a synchronized global recovery. Having said that, most of this is likely to be transitory due to various factors noted here and in the article.
A unionized labor force in the US is likely to produce even more Automation. There are other labor unions in the US that have little or no bargaining power. Would Amazon labour union have significant bargaining power? Never say never, but I doubt it.
LFPR has been on a downward trajectory in decades, and may reverse in the short term. In a knowledge economy, LFPR is likely to keep going down as far as the eye can see. Software will do the job of humans, no doubt about it.
Liz Ann Saunders has suggested that the stimulus checks are likely to be saved not spent (!). To be sure, perhaps some stimulus check will be spent, but with an aging population, Americans are perhaps likely to engage in more austerity. Underlying consumer confidence is what would dictate whether this money is spent or saved.
After a decade of monotonous rise in growth names, sure, we may be in for cyclicals to outperform, but for how long?
You should buy growth if growth becomes scarce. A transitory inflation environment means that the economy should see continued real growth but without the Fed feeling necessary to tighten. This will be more positive for cyclicals, not high-octane growth stocks.
The key word in the post for me is ‘transitory.’ Most events in the capital markets are transitory – yet not necessarily taken in stride by investors.
For instance, the vast majority of corrections in the capital markets are transitory (the main exception that comes to mind would be companies that end up bankrupt), yet the effects of each decline can be huge.
So I wouldn’t rule out a violent market reaction to temporary inflation. That remains to be seen.
Speaking of value/cyclical, it’s quickly becoming thematic material for the financial media. For instance – https://www.marketwatch.com/story/value-stocks-are-so-in-favor-theyve-become-momentum-stocks-11616084864?mod=mw_latestnews
Might that create headwinds for the trade going forward, and perhaps even initiate a countermove prior to regaining traction?
(a)
The above link was intended as (a).
(b) https://www.marketwatch.com/story/value-stocks-are-making-a-comeback-dont-get-left-behind-these-analysts-say-11615828690
What’s the real contrarian trade here, at least for the short term – as D.V. conjectures, short financials/cyclicals and long growth?
For now, cyclicals remain the place to be, until we hit the next recession or growth (FAANG) has a significant pull back and valuations approach a more reasonable multiple.
Bond prices ROC the last several weeks has dived to the historical low range. Odds are increasing that a reversal trade is in the making. With such one-sided bet on $TNX increasing in future markets Tech may see daylight soon. The consensus is like for $NDX: if below fib 38.2% 12,850 then down to 12,200, and if above fib 61.2% 13,250 then up to 13,900.
I usually don’t like this kind of exact numbers, but it happened to be very clean this time. Again just a setup, albeit high probability of Tech going reversal.
fib 61.8%
The price of buy-and-hold is always one of commitment. – one that includes tests and retests of that commitment. Buy-and-hold investors in growth are undergoing one such test right now. What about newly-minted investors in value/cyclicals? We had one in January. Was that sufficient, and for how long?
I spotted something on the chart of the Fed Funds Futures that I have highlighted in the past.
https://refini.tv/3nsexU1
We see the December 2023 contract that was hugging the 2022 contract suddenly diverge at mid-February. It then started showing one Fed Funds quarter point tightening in 2023.
Now look at this chart of the Value and Growth Factors from the Vaccine Twist. Mid-February is the exact point where Value surges and Growth stumbles. They diverge markedly. I believe mid-February marks the point when professionals built in an inflation/hot economy Fed policy shift in the out years. Going forward, watching the 2022 and 2023 futures will tell us what’s happening. Will rates be ramping up slowly or fast? Will we see futures fall back if the economy disappoints? Growth and Value will shift accordingly. Keep the chart. It updates nightly.
https://refini.tv/3c3SbW9
Last chart compares the ‘rising rates’ ETF to the ten year. Let’s review:
eqrr halved when tnx went from 1.5 to .5. Then tnx corrected back up, and eqrr jumped up 50% to 30. tnx resumed downtrend and made a double bottom at .5, but eqrr refused to go down. Huge divergence. Once tnx started a ‘convincing’ uptrend, eqrr shot up again. So here we are.
So then, if you hang your hat on this correlation, it suggests the question (not ‘begs the question’): Where does the ten year go from here?
So far, there does not appear to be any meaningful divergence between eqrr and tnx.
But to believe there is much more to come from these ‘rising rates’ stocks, you also have to believe the ten year keeps on going up a consequential amount.
So I would like to hear from the ‘rising rates etf’ enthusiasts, what is your projection for the ten year over the next year? 2.5%? 4%? What?
Or do we memory-hole the eqrr/tnx correlation when the correlation stops correlating?
Hoping Cam will make explicit his interest rate outlook tomorrow.
Just a quickie: US10y is at 3.24 peak in early Nov 2018. Then we got one quasi-bear market. I would venture this time tnx would not even get near this number before we get into another recession.
So much debt. So many structural problems. So few solutions. No conviction. No concept of shared sacrifice.
‘So much debt.’
The first financial newsletter I read 40 years ago: ‘Look at this chart of the last several decades, for every dollar the US borrows, less and less resulting GDP growth. Disaster only a matter of time.’
I have here on my shelf: ‘Beyond Our Means – How Reckless Borrowing Threatens to Overwhelm US’ published 35 years ago, by the news editor of the WSJ.
Sure, we zeroed out the S&L industry, and some large banks, but how much has that mattered? Not much.
Debt skeptics not wrong, just early, I guess.
I don’t think it’s necessary for rates to go up for the inflation stocks to rise. On the chart there’s lots of periods of flat or up 10 year rates when the FAANG and ARKK stocks were soaring. They didn’t need rates to fall to go up. The economically sensitive inflation stock need their earnings to soar to keep the ball rolling. I believe that will happen.
In agreement with the video I pointed to in the last post. Cyclical stock outperformance is about rising confidence in cyclical earnings, it’s not about rates.
If one believes there is actual information in this chart, only possible takeaway is that for eqrr to advance, the ten year has to continue to rise. And if eqrr continues to advance, but tnx flatlines, that would be an important negative divergance.
Financials 37% of eqrr. Banks, I assume, make money on the spread, borrowing short, lending long. Is spread widening driving their out-performance, or increased loan volume? If long rates stop going up, it better be increased volume.