Preface: Explaining our market timing models
We maintain several market timing models, each with differing time horizons. The “
Ultimate Market Timing Model” is a long-term market timing model based on the research outlined in our post,
Building the ultimate market timing model. This model tends to generate only a handful of signals each decade.
The Trend Asset Allocation Model is an asset allocation model that applies trend following principles based on the inputs of global stock and commodity price. This model has a shorter time horizon and tends to turn over about 4-6 times a year. In essence, it seeks to answer the question, “Is the trend in the global economy expansion (bullish) or contraction (bearish)?”
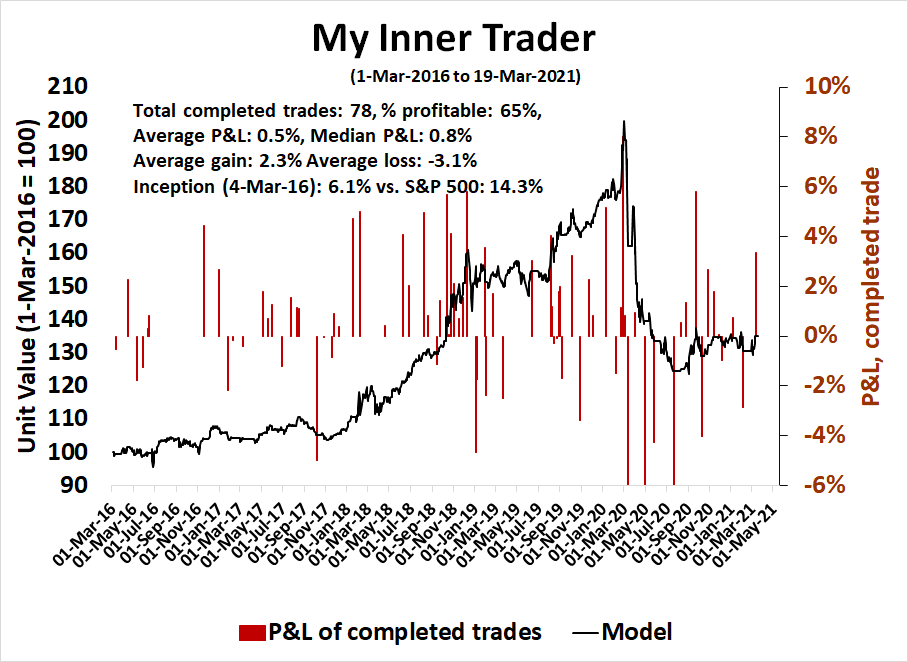
My inner trader uses a trading model, which is a blend of price momentum (is the Trend Model becoming more bullish, or bearish?) and overbought/oversold extremes (don’t buy if the trend is overbought, and vice versa). Subscribers receive real-time alerts of model changes, and a hypothetical trading record of the email alerts are updated weekly here. The hypothetical trading record of the trading model of the real-time alerts that began in March 2016 is shown below.
The latest signals of each model are as follows:
- Ultimate market timing model: Buy equities
- Trend Model signal: Bullish
- Trading model: Bullish
Update schedule: I generally update model readings on my site on weekends and tweet mid-week observations at @humblestudent. Subscribers receive real-time alerts of trading model changes, and a hypothetical trading record of those email alerts is shown here.
Subscribers can access the latest signal in real-time here.
A tale of two markets
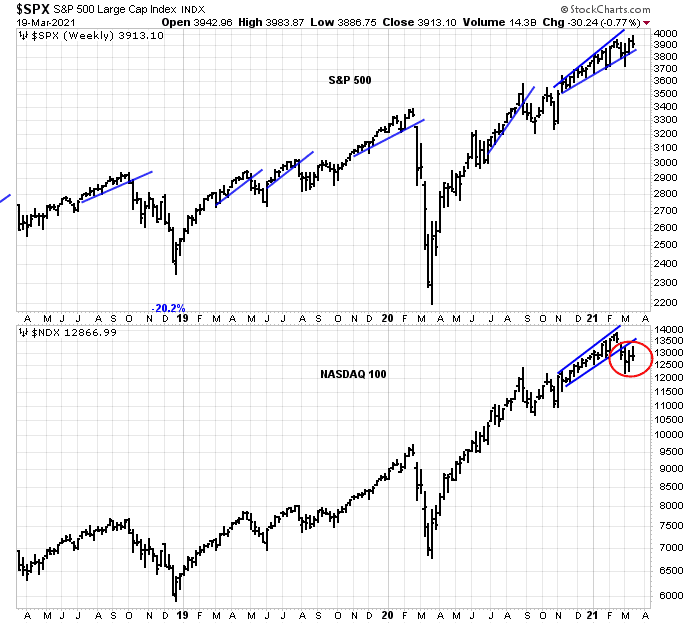
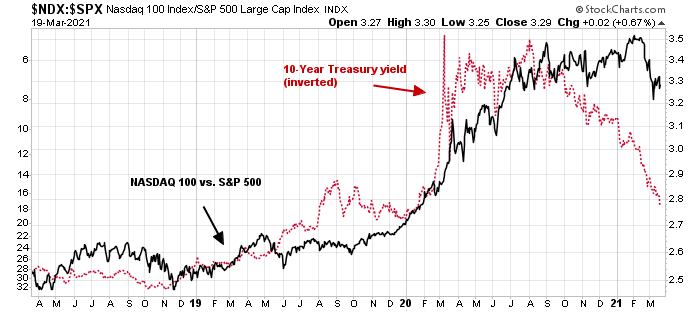
It was the best of times. It was the worst of times. This doesn’t happen very often, but the character of the stock market has made an abrupt turn recently, as evidenced by the performance disparity between the S&P 500 and the NASDAQ 100.
The weekly chart of the S&P 500 shows that it survived a brief corrective scare, but the index went on to fresh highs. By contrast, the growth-heavy NASDAQ 100 is acting like a sick puppy. NDX violated a rising trend line and last week’s rally attempt was rejected at the 50 dma level.
The violent change in market character, or leadership, has created a two-tiered market of extreme winners and losers. Traders need to be aware of this shift and adjust their analytical framework accordingly.
The Great Rotation
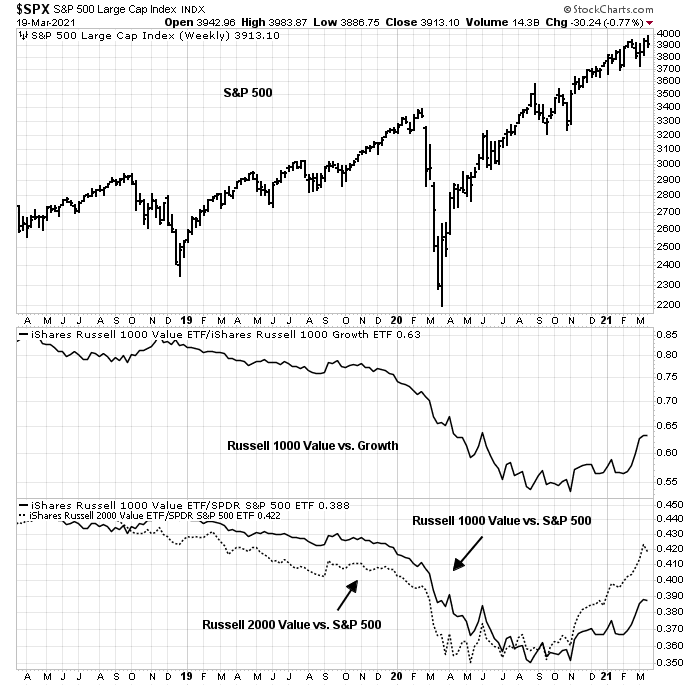
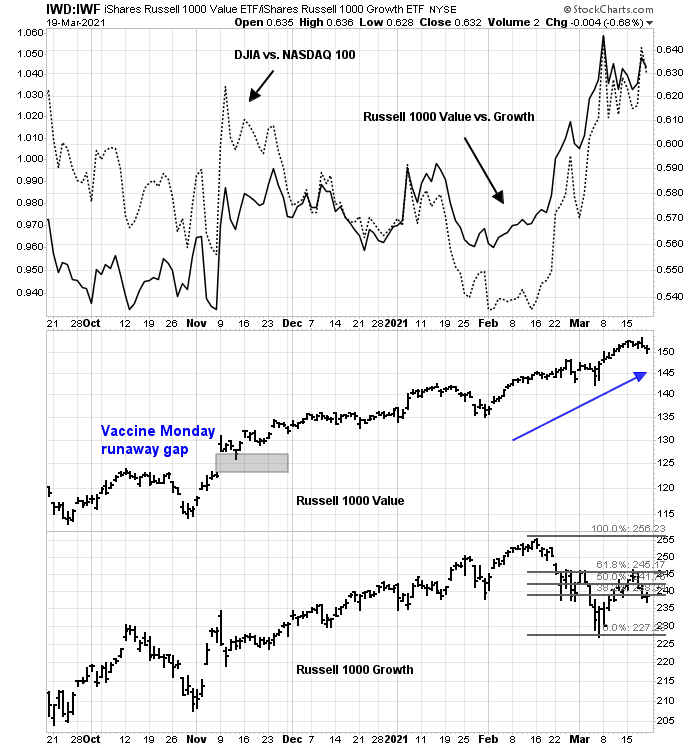
When bull market cycles mature and end, market leadership changes. This is evident with the behavior of value and growth stocks, which I have called the Great Rotation. Growth had been leading for years, but value bottomed out against growth last summer and began to turn up in late 2020. The effects of the Great Rotation can be seen by the relative strength of the Russell 1000 Value Index (large-cap value) against the S&P 500 (bottom panel). The performance turnaround of small-cap value, as measured by the Russell 2000 Value Index, was even more dramatic.
In light of these changes in market leadership, the task of analyzing overall market direction, as measured by the S&P 500, becomes especially challenging. Traders are advised to separate the performance of growth and value stocks separately in order to get a clearer view of the technical picture.
Growth’s stagnant outlook
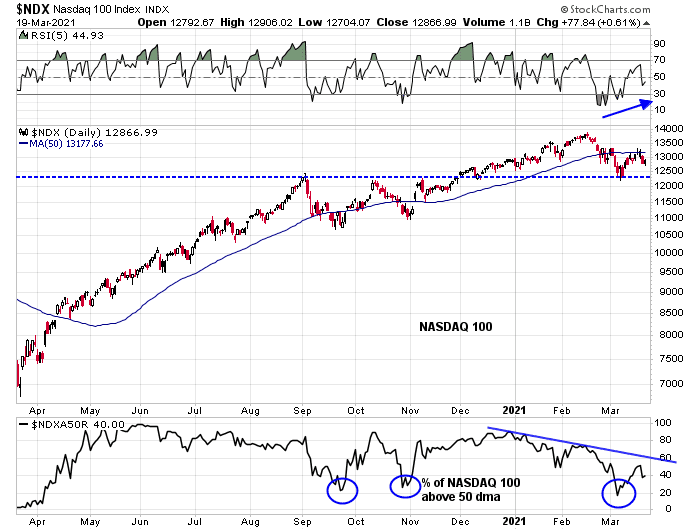
Let’s begin with growth stocks, which is proxied by the NASDAQ 100 (NDX). From a technical analysis perspective, the growth stock outlook can be analyzed using NASDAQ-only breadth and momentum indicators in order to separate the action of growth and value stocks.
NDX bounced off an area of major support while exhibiting a positive 5-day RSI divergence in early March. The index was also oversold as measured by the percentage of stocks above their 50 dma. The rally met but couldn’t overcome overhead resistance at its 50 dma and the index has since pulled back.
The bull case is speculative risk appetite remains intact. Bitcoin prices are highly correlated to the relative performance of the ARK Innovation ETF to the S&P 500. In the short-term, this is a bullish divergence supportive of better returns.
On the other hand, the relative performance of NDX is inversely correlated to bond yields. The 10-year Treasury yield has surged above 1.7%, which has to put downward pressure on the attractiveness of growth stocks.
Is this bullish or bearish for growth stocks? Call it a wash. It’s difficult to discern a strong tradable signal for growth stocks, other than to observe that they are in an intermediate-term relative downtrend.
Value: The new leadership
Even as growth stocks struggled, value stocks have performed much better. While the relative performance of large-cap value and growth can be measured by the Russell 1000 Value and Russell 1000 Growth Indices, one quick proxy for value and growth would be the relative returns of the Dow against the NASDAQ 100.
The Russell 1000 Growth Index (bottom panel) staged an oversold rally that was halted at the 61.8% Fibonacci retracement resistance level. By contrast, the Russell 1000 Value (middle panel) continues to grind upwards. In short, value stocks are in a well-defined uptrend while growth stocks have faltered.
The established strength of value stocks makes a “buy the dip” strategy an attractive proposition for traders. The NYSE McClellan Oscillator (NYMO) made a double oversold bottom in late February and early March and the S&P 500 subsequently rallied. NYMO readings have come off the boil and retreated off a near-overbought condition. I interpret this as a constructive intermediate-term bullish condition for value stocks.
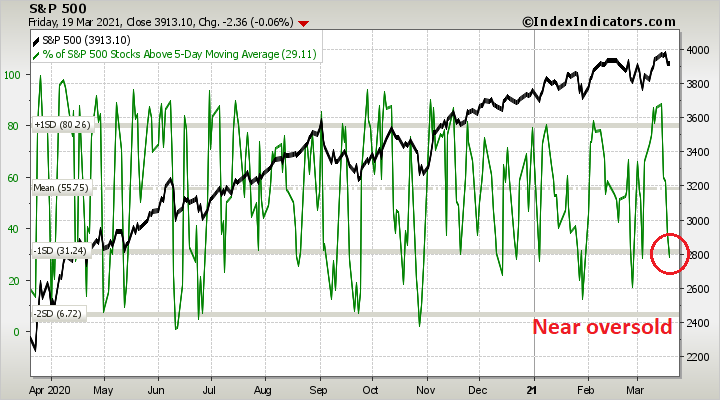
In the short-run, the price weakness seen late last week makes the S&P 500 ripe for a relief rally.
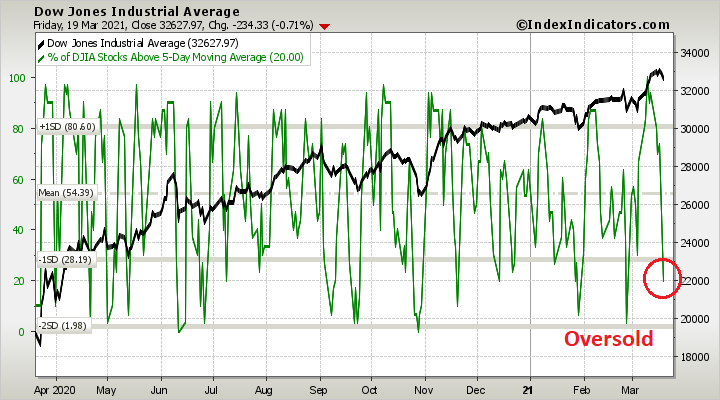
Short-term breadth for the DJIA. which as a proxy for value and cyclical stocks, are flashing a similar oversold reading. Expect market strength during the first half of the week.
In conclusion, the character of market leadership has shifted dramatically, leading to a two-tier market. There is no longer a single stock market, and technicians need to analyze growth and value stocks separately. Growth stocks have been struggling and should generally be avoided. Value stocks are in an intermediate-term uptrend, and traders should adopt a “buy the dip” strategy. Current technical conditions for value are nearing an oversold reading, and the risk/reward for value bulls appear favorable in the coming week.
My inner investor is bullishly positioned mainly in value and cyclical stocks. My inner trader is tactically long small-cap value stocks, which have been the recent market leaders.
Disclosure: Long IJS


Looking at individual stocks : Amazon, Apple and Ring Central which were past leaders in the growth sector one finds that they are trading close to their 200 moving average. This provides an attractive entry on a risk reward basis. Moreover, the 10 year Bond is also close to a very oversold level on a weekly RSI. Therefore, I would not be surprised to see money shift back into the NDX albeit on a short term to medium term while the overextended value sector pauses and consolidates.
Jim Bianco and several others I follow are also calling for a bounce in TLT and growth stocks.
https://www.cnbc.com/2021/03/21/investors-will-get-relief-from-falling-treasury-yields-jim-bianco.html
I’ll be closely monitoring yields and tech stocks next week.
From len g:
“‘So much debt.’
The first financial newsletter I read 40 years ago: ‘Look at this chart of the last several decades, for every dollar the US borrows, less and less resulting GDP growth. Disaster only a matter of time.’
I have here on my shelf: ‘Beyond Our Means – How Reckless Borrowing Threatens to Overwhelm US’ published 35 years ago, by the news editor of the WSJ.
Sure, we zeroed out the S&L industry, and some large banks, but how much has that mattered? Not much.
Debt skeptics not wrong, just early, I guess”.
Excellent len g. Modern Money Theory (MMT) proponents are right. I had penciled in 50 Trillion $ of money printing, to stave of recession. We, in the US are running a debt of 30 Trillion $, as I write this.
Today, I will upgrade the deficit spending to 100 Trillion$, say in the next decade. In the meanwhile, buy gold and buy stocks.
Literally a day after I wrote the above, this from zerohedge:
‘Headed for a collapsing debt bubble’
‘Figure 5. Dollars of additional debt required to add $1 dollar of GDP growth (including inflation), based on data of the US Bureau of Economic Analysis.’
https://www.zerohedge.com/economics/headed-collapsing-debt-bubble
I dot not follow Zero hedge very closely, but not much is new in the article you referenced. Some things written do not ring true, for instance:
“I can imagine a situation, not too many years from now, when countries everywhere will establish new currencies that are not as easily interchangeable with other currencies as today’s currencies are. International trade will dramatically fall. The standard of living of most people will fall precipitously”.
Really, the world is going to be less integrated going forward? Fruits of science are not going to benefit the rest of the world? The evidence seems opposite of what is quoted above.
In my opinion, this Howard Marks article is a MUST READ.
https://www.oaktreecapital.com/docs/default-source/memos/2020inreview.pdf
Good summary. Central banks hold the trump cards is what I see is the conclusion of Howard Mark’s article, IMHO.
More seriously, you reminded readers that circa middle of 2020, it was predicted that the pandemic could run till 2023. However, we are putting the pandemic in the rear view mirror two years earlier.
The real winner here is mRNA technology (Joe six pack would call it Science). Alchemists from central banks did the rest!
Howards Marks needs to learn the ideas being proposed by Professor Stephanie Kelton et al!
100 Trillion $ and -5% real yields on ten year Note. We may be heading to Alice in wonderland world!
Howard Marks and his like-minded peers like Greenblatt and Bassman et al are disciplined deep-value investors, and very disciplined. I like their style more than that of Grantham. They made most of their money during the last two crises: 2000 and 2009, basically buying convexity at the deep discount.
But it is going to be very tough going forward to find opportunities like in the old days, since, like you mentioned here, CBs have learned how to play the game. He is subtly conveying the message in the letter to his investors. Did you also notice how desperate these days for Ray Dalio? He is becoming increasingly incoherent, like Buffet has morphed into.
Maximum randomness and mean reversion and time compression. Just say that in the future everyone needs to be nimble. Small guys need to realize they can beat big guys easily by virtue of agility.
I noticed that parabolic price moves are increasingly common starting about three years ago. First I don’t like it. Now remembering Farrell’s wisdom I started to embrace it, like Dr. Strangelove: “How I Learned to Stop Worrying and Love the Bomb.”
Kelton is not the inventor of MMT. US Gov has actually been practicing it for a long time now. But she is the first one stating it publicly and blatantly. US Gov does not want this to get into the public’s consciousness, not that US citizens are very bright and curious these days. The dumbing down has been very successful. But even a small percentage of enlightened ones could tip the balance of power away from US Gov. I guess these folks can be bought off and they can join the elite ruling class. Is it too crowded already? Too many wannabes?
Times, they sure are changing! What I noticed is the returns of the stock market are random. It is hard to beat a portfolio of diversified assets over a long period of time. Check the tables on Paul Merriman’s website. There is a wealth of information that I found very useful.
Sure, value is bubbling up for now and Tech is down, after a decade of tech dominance. Something tells me that mean reversion will get growth back on track. The million $ question is how much cheaper does tech have to get to get back to good value? Pun intended!
“Maximum randomness and mean reversion and time compression”.
These three will destroy any “factors” like convexity, and others given enough time. I am slowly coming to see the evidence that a well diversified portfolio help over a few decades is hard to beat when risk to reward metrics are used. Truth be told, Jeremy Grantham has plain and simply been wrong. With information availability so widespread, all factors will be defeated, and would only be one time shot. Even Howard Marks asked the question how many people were able to time the market and sold in February 2020 and bought in end of March 2020? Average 8-10% returns are pretty good over a 3-4 decade holding. When information was difficult to find, like in the last century, was when likes of Mr. Buffett had an edge. Not so much anymore as market efficiency has defeated Buffett type outperformance. We may have some downside to the Nasdaq, but going forward, we probably will need growth names to balance out portfolios.
Cam,
Is IJS a more superior ETF than alternatives?
– VIOV – Vanguard S&P Small-Cap 600 Value ETF
– IWN – iShares Russell 2000 Value ETF
– VBR – Vanguard Small-Cap Value ETF
– SLYV – SPDR S&P 600 Small Cap Value ETF
Compare the fees and the size of these funds for comparison.
Good answer.
Thanks.
https://www.cnbc.com/2021/03/22/covid-cases-rise-across-more-than-half-of-the-us-as-country-races-to-vaccinate.html
So, here they come, rise in cases and a post spring break swoon for a 10% correction, more lock downs and another few Trillion $s of money printing (?/may be).
https://www.washingtonpost.com/us-policy/2021/03/22/infrastructure-biden-drug-reform/
“White House officials are preparing to present President Biden with a roughly $3 trillion infrastructure and jobs package that includes high-profile domestic policy priorities such as free community college and universal prekindergarten, according to three people familiar with internal discussions”.
So, with or without a new Pandemic surge, here is 3 Trillion in new spending, that is what the doctor ordered. I was simply wrong, speculating about spending (it is already here). I have nominally pencilled in 100 Trillion in new spending in the next decade, give or take. So, we still have a lot of money to spend, after 4.9 Trillion this year alone.
Interest costs on such borrowing is the job of the Fed to take care of!
Where is Wally when I need him the most?
So, now do you believe Tesla goes to 3K per share? Tesla in every garage!
Decided to wait until after hours to start rebuilding a few positions. Even so, just 17% invested at this point.
XLE.
KRE/ KBE/ XLF.
FXI/ ASHR.
JETS.
X/ AA.
NIO.
PLTR.
QS. Waiting until after hours paid off on this one, as prices pulled back on news of a secondary announcement.
TWTR.
Adding a second tranche to selected positions premarket.
FXI/ ASHR.
XLE.
JETS.
XLF.
In the meantime, NIO/ PLTR/ QS/ TWTR are holding up well.
A reversal in the rotation trade continues, and value holders are being tested.
Opening a position in IJS.
Reopening a position in PICK.
Adding to KRE.
Reopening a position in EEM.
Restarter positions in VTV and VEU.
Adding to IJS.
Restarter in EFV.
Tempted to buy more, but I’m going to have to hold the line here. Already off -0.27% on positions opened last night and this morning – which is a shot across the bow in terms of being on the wrong side of the market.
My take is that the current test/retest is about to end. The trick is to take the other side of sell orders near the end of the test – but often what happens instead is that I get stopped out myself when the selling accelerates. My primary backstop is position size – but now that I’m up to 30% even I can feel the heat.
Adding cautiously here to JETS/ KBE/ PICK.
Adding a position in EFA.
Restarting positions in VTIAX/ VTSAX/ VVIAX/ VTRIX/ VEMAX at the close – albeit sized down from my usual starting position sizes.
It’s my humble opinion that while the broader market will likely see further downside, the selloff in the value sector has been sufficiently brutal to end the current decline.
Will be ~50% invested by the close.
We should assess the likelihood of two huge packages passing the senate. One is the above mentioned infrastructure. The other one is the tax. I have no clue
In the US, Texas is opening vaccinations to all groups next week. Georgia and Oklahoma has opened appointments to all groups today.
127 MM doses distributed so far.
In more good news, hospitalization rates in my locale have plummeted due to the vaccine rollout.
Several hospitals in the area have begun removing COVID-19 overflow capacity.
Is anyone here bearish?
I’m starting to think that the market has discounted all of the reopening news and may in fact be on the verge of a major consolidation. Why? That’s what stock prices seem to be saying.
I think its basically what Cam has outlined the last few weeks. Tech and ‘bubble’ stocks are being sold off in favor of value, finance, and energy.
Tech and ‘bubble’ stocks have been closely watched and heavily bought the last few years. To see them get sold off 50%+ could create all the bearish sentiment.
I’m still holding XLE from Nov/Dec. added to XLF and looking for individual value stocks.
Paring back.
AA/ X off here.
XLF/ KRE/ KBE off here.
JETS off here.
Taking losses on EEM/ FXI/ ASHR.
Turning bearish. All other positions off here.
I have until the end of day to decide how to handle the index funds, which currently represent a 15% investment.
Not exactly why I would be bearish with the DJIA +300 points, but that’s my sentiment. I think value holders were tested sufficiently on the first round – a second shakedown might be needed for a sustainable reversal. JMO.
Taking a swing at ARKK here. Reopening smaller positions in QS/ NIO/ PLTR as well.
Reopening IJS.
This is bear market action – whether it’s NIO or IJS.
Index funds will be closed end of day.
My one-and-a-half day foray into the markets will trim -0.5% off the portfolio. That may not sound like much, but it’s much more than I expected and another indication that it’s a bearish tape – despite the emphasis on value.
IJS/ NIO/ QS/ PLTR off here for minor losses (but only because position sizes were small). A very negative tape, IMO.
No point in being married to a position. I turned bullish Monday evening, transitioned to neutral last night, and now I’m bearish. All traders believe they will be able to exit prior to any major declines – but how many of them succeed? The market almost always warns us ahead of time. Personally, I would prefer to act even on false positives, as being trapped in the midst of a major decline is just too much emotional work. It still happens – but far less often than it used to.
In my view, the two most likely scenarios on Thursday-
(a) A modest bounce.
(b) A gap-down open which accelerates into a decent selloff.
I’ll be dealing with either one positioned in 100% cash. Obviously, I would prefer to manage (b).