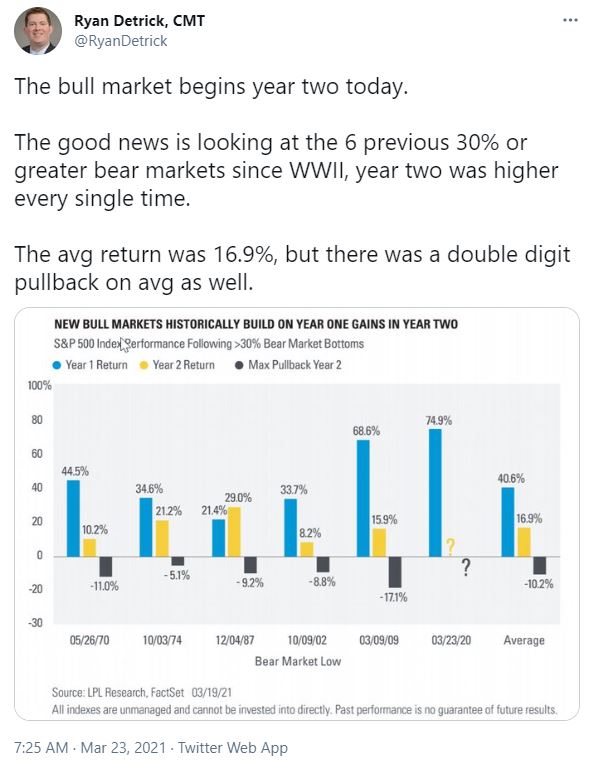
Mid-week market update: The equity bull market began about a year ago. Ryan Detrick observed that the second year of past major bulls have averaged gains of 16.9%, though investors should not ignore pullback risk.
Risk on!
Animal spirits
Bullish readings are confirmed from a long-term perspective by a combination of strong MACD momentum and the emergence of market animal spirits. Past bullish crossovers of the monthly MACD histogram have marked strong buy signals (blue vertical line), though bearish crossovers (red lines) have been less effective sell signals. In addition, while most analysts have scrutinized option call and put activity for short-term trading signals, a big picture view of the equity call/put (inverse of the put/call ratio, top panel) shows that a steadily rising equity call/put ratio has also defined bull phases. Moreover, a rising 200 dma of the equity call/put ratio (red line) has coincided with MACD buy signals.

What could dent this bull?
An EM crisis?
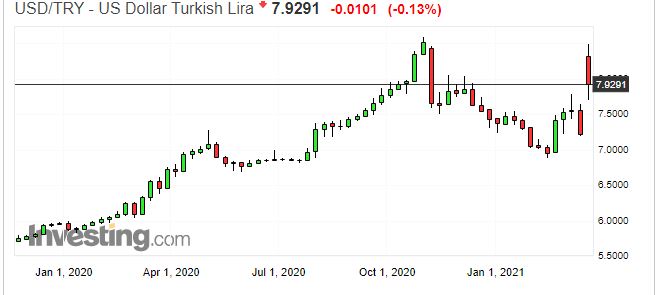
Could an emerging market currency crisis halt this bull market? It doesn’t appear so. The Turkish lira came under pressure when Erdogan replaced the head of Turkey’s central bank for raising interest rates. The Turkish lira (TRY) cratered on the news but stabilized within a day.
BBVA is a Spanish bank that a high degree of Turkish exposure. Its shares fell, but the price action could hardly be described as a crash and it has stabilized.

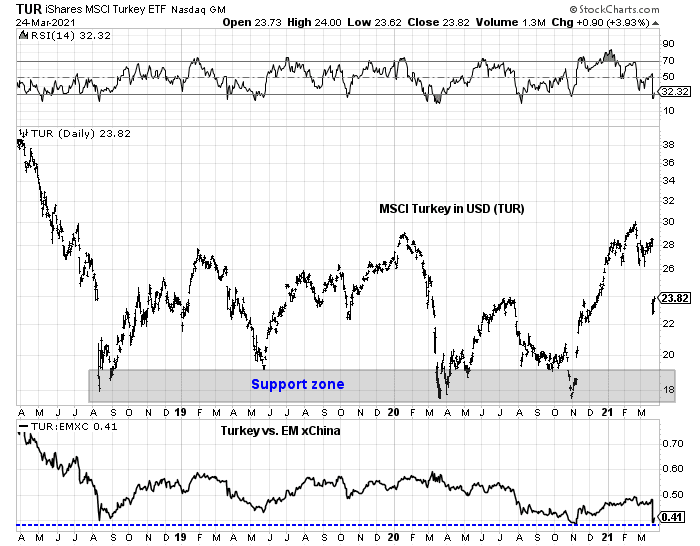
The same could be said of the Turkish stock market, which fell dramatically on Monday but it is not trading at a key support level relative to MSCI Emerging Markets ex-China.
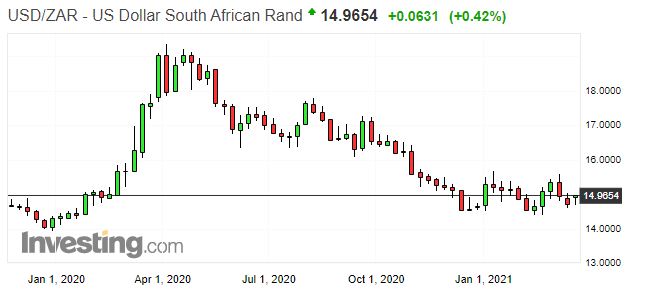
There was also no contagion effect felt in a vulnerable EM currency like the South African Rand.
The Turkish lira crisis is turning out to be a non-event like the Dubai World restructuring of 2010 when Dubai World teetered on the edge of bankruptcy. Coming so soon after the GFC, there were fears of financial contagion at the time which never materialized.
Seasonal headwinds
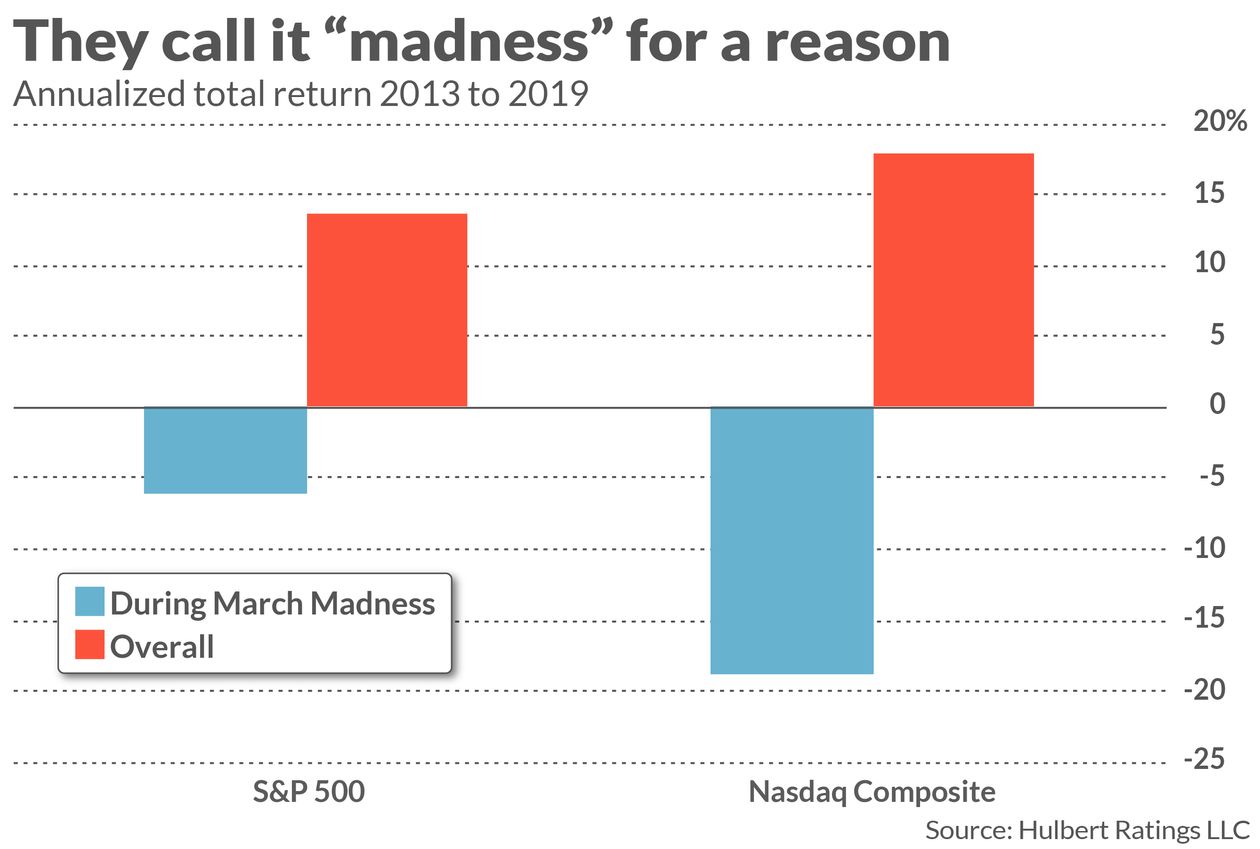
What about the recent market weakness? Mark Hulbert found that major sports events can have a depressing effect on stock prices.
If you are a short-term trader, note that tip-off in the first game of this year’s March Madness is 4 p.m. Eastern time on Mar. 18. The tournament ends with the championship game on the evening of Apr. 5.
The correlation between sports and the stock market was documented by a study published a number of years ago to in the Journal of Finance. Entitled “Sports Sentiment and Stock Returns,” its authors were finance professors Alex Edmans of the London Business School; Diego Garcia of the University of Colorado at Boulder; and Oyvind Norli of the BI Norwegian Business School.
After studying more than 1,100 soccer matches, the professors found that, on average, a given country’s loss in the World Cup elimination stage is followed by its stock market the next day producing a return that is significantly below average. Though they focused primarily on the World Cup, they also studied cricket, rugby and basketball matches as well.
Crucially, the researchers did not find a symmetrically positive stock market impact following a World Cup win. They speculate that this is because a win merely means that a country’s team advances to the next round, while elimination is final. As a result, losing teams’ fans are likely to be more despondent than winning teams’ fans will be exuberant.
The logical consequence of this asymmetry: global stock markets should experience abnormal levels of selling during the World Cup and, therefore, below-average returns. And, sure enough, that is exactly what was found by another academic study, this one by Guy Kaplanski of the Bar-Ilan University in Israel and Haim Levy of the Hebrew University of Jerusalem.
Hulbert went on to analyze stock market returns during March Madness and he found a negative effect (caution, n= 7).
An internal rotation
First, equities have performed so well against bonds that large balanced funds are compelled to re-balance their holdings by selling stocks and buying bonds at or around quarter-end.
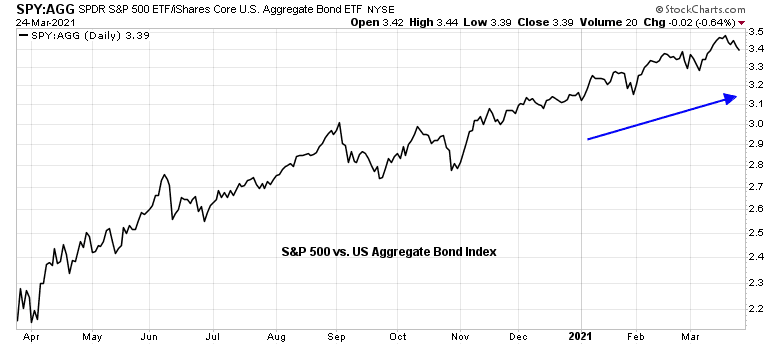
We are already seeing some of that re-balancing effect. Bond prices have exhibited positive RSI divergences for several weeks and they are finally turning up. The open question is how long the rally can last. One key test will be tomorrow’s 7-year Treasury auction. If it doesn’t go well the bond rally could reverse itself very quickly.

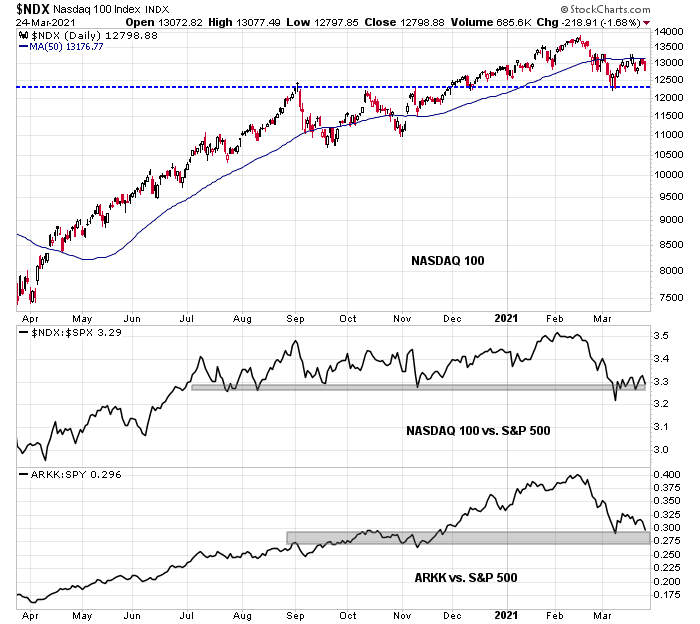
Growth stocks have also been bid while value and cyclical names have weakened. This all appears to be part of the re-balancing trade overhanging the market. Despite the strength in growth stocks, the NASDAQ 100 has yet to regain its 50 dma and it has barely rallied above a key relative support zone as measured against the S&P 500. The high-octane ARK Innovation ETF (ARKK) is also struggling relative to the S&P 500.
By contrast, the Russell 1000 Value Index remains in a well-defined uptrend, both on an absolute basis and relative to the S&P 500.

In conclusion, the bull is still alive. The recent market weakness is only temporary. Stay with the market leaders of value and cyclical stocks.
Disclosure: Long IJS
Are investors preparing for continued US Dollar strength? The yield differential is quite significant between US and zero to negative yields in Europe and Japan. Emerging markets weak, Nasdaq weak, German DAX holding up relatively well, one would expect these kind of moves in a rising Dollar environment. Cost pressures are rising everywhere though and might weigh on corporate profits. Usually one would expect a weaker Dollar in a “synchronized global growth” environment, but this time the growth is primarily being driven by US growth and fiscal policies.
I agree with you in that the USD is poised for a rally. The surprise is TRY weakness did not induce any kind of EM contagion among the more fragile EM economies.
Got that. I hope that conclusion is not too early.
If USD rallies, does it bode well for oil, gold, copper and other commodities, and therefore the cyclical and value stocks?
‘The same could be said of the Turkish stock market, which fell dramatically on Monday but it is not trading at a key support level relative to MSCI Emerging Markets ex-China.’
‘is now trading at a key support level’, methinks
Cam, what’s causing the significant drop in the R2K Growth Index? it is almost down ~10% over the last week.
Morgan Stanley downgraded smallcaps on March 15th mentioning rising cost pressure and PPI outpacing CPI, noting that small companies might have more difficulties managing cost surprises. The rise in producer prices has been confirmed in IHS Markit Flash PMI reports.
More on whether ‘duration’ has anything to do with growth or value going up or down.
‘Given the drivers of return for value as an investment style, you could make the argument that value should have a slightly shorter duration than the overall stock market and growth stocks a slightly longer one. But the difference between them is small enough as to easily disappear in the noise of the market and cannot possibly explain the performance of value and growth stocks over the past few years. There may be other reasons to believe value stocks at present are more correlated to economic growth than growth stocks, and that correlation might well persist for a while. But neither history nor economics suggest that there is anything permanent or inevitable about there being a meaningful correlation between the performance of value stocks versus the market and shifts in bond yields.’
https://www.gmo.com/americas/research-library/the-duration-of-value-and-growth
Looking at exhibit 1 in there, the rising bottoms associated with negative correlation, might imply a more significant positive correlation going forward.
Market is basically narrative-driven and algo-driven herding in the short run. I don’t find that there is any mathematically valid correlation. You can find at any time tons of conflicting signals. At this moment the narrative is rip-roaring recovery and growth. But look around and do a simple analysis, do you believe this is going to be the case?
I remember last year being amazed by the v-shaped price recovery, and examined lots of spreadsheets. Basically markets have looked two years ahead. In this case we should expect this year to be very flat. So all the rotation is just part of the mean reversion processes.
I could be wrong, but if you look at any indices you should expect a long consolidation period ahead this year. People would say energy and financial have more upside. All right, to what level do you expect 10s2s to be from today’s spread. And for energy, it is going to be a killer when crude prices spike.
I believe a lot of market participants have been adopting momentum based strategies as those have been working so well over the last decade. At some point investors simply bought EV and green tech because it has been going up, then the momentum switched over to small caps and cyclicals, first industrials and materials, then banks and energy.
I believe that’s what Dr. Michael Burry was talking about when he wrote that TSLA might crash to 100, which would not destabilize markets as a whole but would possibly mark the end of a certain type of investment style.
Bitcoin and it’s parabolic rise is a bit of a poster child for this price momentum strategy.
Maybe that Jefferies upgrade on GME yesterday was an indication that the usual “we raise our price target because the price has been going up” analyst notes are losing a bit of credibility.
Time for risk control. Lots of broken charts out there.
Cash is a position.
Taking an early swing at QS, which now sports a 41 handle.
Reopening NIO – now in the 34 range.
Restarting XLE/ KRE.
All positions are only trades, and will be sized down until the market proves itself – ie, the assumption is that we’re now in a ST downtrend.
QS/NIO positions off here.
Restarting IJS.
Restarting VTV.
Reopening QS/ NIO.
Restarting X/AA.
Adding to IJS/ XLE.
All positions off here. Back to cash.
+0.2% for the portfolio, which trims yesterday’s hit to a more manageable -0.34%.
Still leaning towards a decline in the indexes.
We know the stock market is not the economy, and vice versa. However, one problem that I notice is the lack of bad economic news right now. If markets bottom on bad news and top out on good news, then we may need some bad news to get things going again.
Reopening PICK here, along with another swing at XLE/ KRE/ IJS.
Adding IXC.
QS/ NIO.
All positions off here, and returning to cash.
Red to green on the broad indexes – a major positive. Currently +0.3% on the day, which is in line with the intraday gain on VT. This leaves me open to positioning long at any time.
Tough call here. Is a -3% pullback in the SPX sufficient to launch a sustainable rally? My opinion would be no. On the other hand, the pullbacks in value/ cyclicals/ small caps (whether growth or value) seem ‘good enough.’ So I’m back to Cam’s take – which is to separate the value/cyclicals not only from growth, but perhaps from the broader indexes as well.
A little too much FOMO out there, IMO. I’ll revisit my next long entries on Friday.
(a) It’s unnecessary (indeed, impossible) to catch every twist and turn.
(b) Booking gains is one way to make money. What escapes us sometimes is that it’s just as important (perhaps more so), to avoid downdrafts.
Whether it’s a gap up or gap down in the morning, I’m OK with it.
In the US, more states are opening vaccine appointments to all adults.
MN – March 30
CA – April 15
US Military – All veterans, spouses, caregivers
FL -April 5
130.5 MM doses administered
As for the market, dipped my toe into the dip this AM. Will see what happens Friday.
JPM’s Kolasinac says there will be month end buying instead of selling- Urban Carmel also pointed out that the Put/Call Ratio on Wednesday was high enough to warrant a bounce.
The market is reluctant to stay above 3900 in a decisive manner. Any pull backs have been shallow that confirms the VIX around 20. It may be an End of March thing/end of quarter thing, with the next leg higher in April ???
Taking a swing @ QS/ NIO/ ARKK down here.
QQQ here.
Reopening GSAH.
I’m still looking for a decent correction over the short term. Right now, just aiming for cash flow by buying on weakness when/where I find it.
That didn’t last long. Out of all positions for a minor loss.
A -3% correction in the SPX doesn’t really do it for me (although it does put my ahead of the SPX ytd). It may turn out that rotating corrections among sectors will do it, but that’s not my sense of things. Of course, the market couldn’t care less what I think – but as someone who manages his own money, I care a great deal.
Incidentally, closing all positions as soon as it became clear I was wrong (~30 minutes after opening) kept my losses small. That, IMO, is the most important rule of trading. We’re all going to be wrong much of the time – no worries, as long as we manage them correctly.
QQQ heading for a retest of the March 8 low.
I think that would be the best scenario. If the Nasdaq can survive a retest and then reverse, it sets up the SPX for a return to the highs.
I meant to say that ARKK is heading for a retest of the March 8 lows.
Taking into account a bifurcated market, none of the recent price action strikes me as bullish. It’s been a very negative tape. Hopefully that changes – but often what it takes to change things is a brutal selloff that clears the table.
Wow – nice win for just about everyone! From a guy who got this one wrong. Enjoy the weekend!