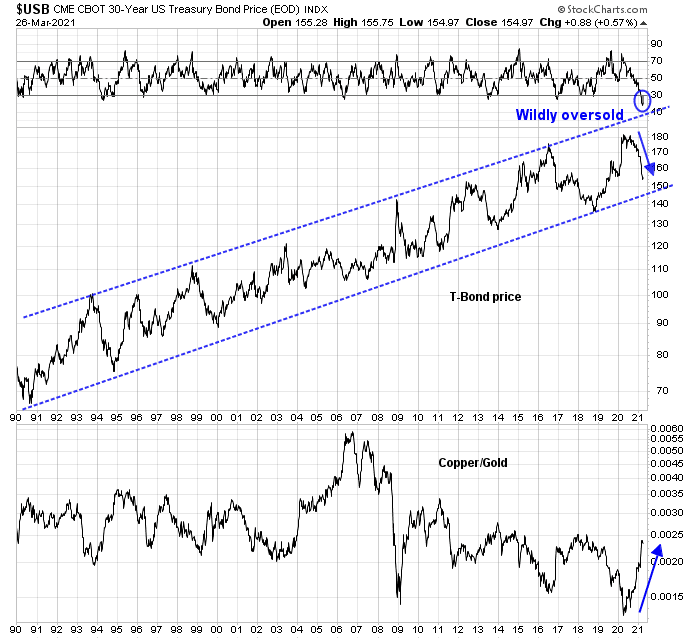
In light of last week’s partial NASDAQ reversal, I had a number of discussions with readers about whether the reflation trade has become overly consensus and crowded. To be sure, bond prices have become wildly oversold while the cyclically sensitive copper/gold ratio has surged upward and appears extended.
Is the reflation trade, which is another shorthand for cyclical and value stocks, due for a reversal?
There is a definite risk that the reflation trade is overdone in the short-term and a reversal can happen at any time. However, a bottom-up technical review and a top-down macro review indicate that the reflation investment theme is showing no signs of intermediate-term weakness. Investors should view any weakness in value and cyclical stocks as opportunities to buy the dip.
A factor and sector review
To answer that question, I conducted a factor and sector review using a framework of analyzing the index representing a factor or sector and the relative return of the index to the S&P 500.
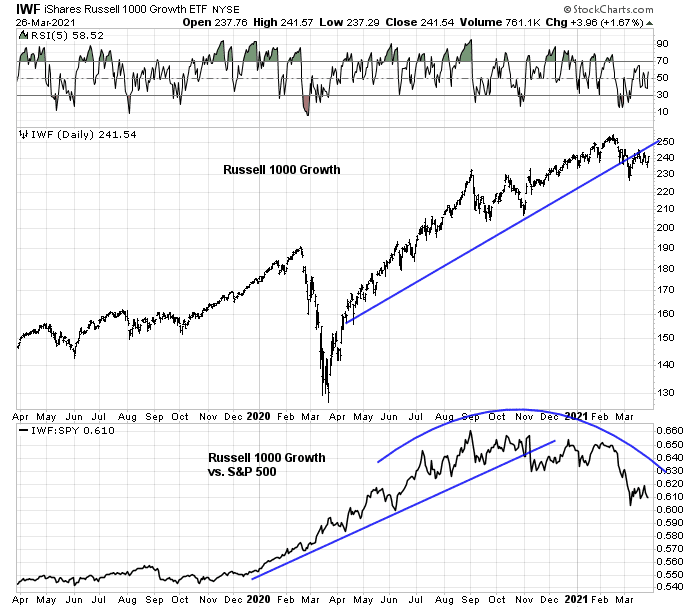
Let’s begin with growth stocks, which had been the market leaders. The Russell 1000 Growth Index has violated rising uptrend lines both on an absolute and relative basis. The weakness is particularly striking on the relative performance chart (bottom panel), which shows a well-defined rounded top.
The technology sector is the largest sector among growth stocks. Technology shows a similar pattern of a troubled uptrend and a relative topping pattern.
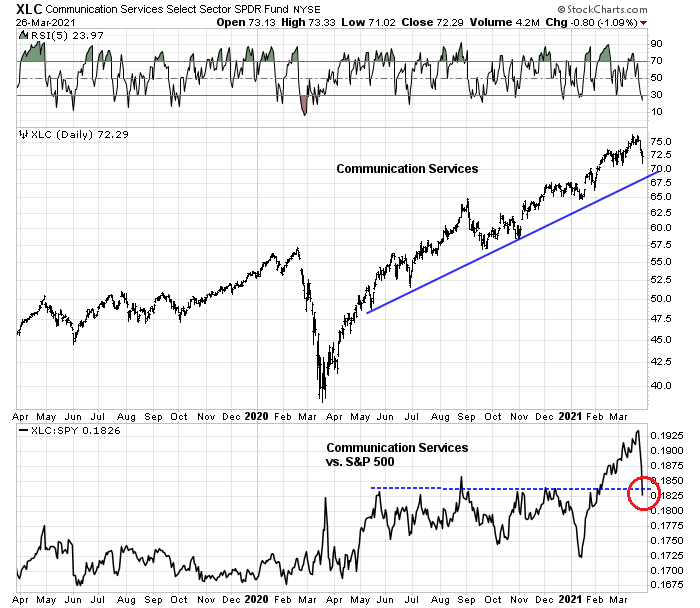
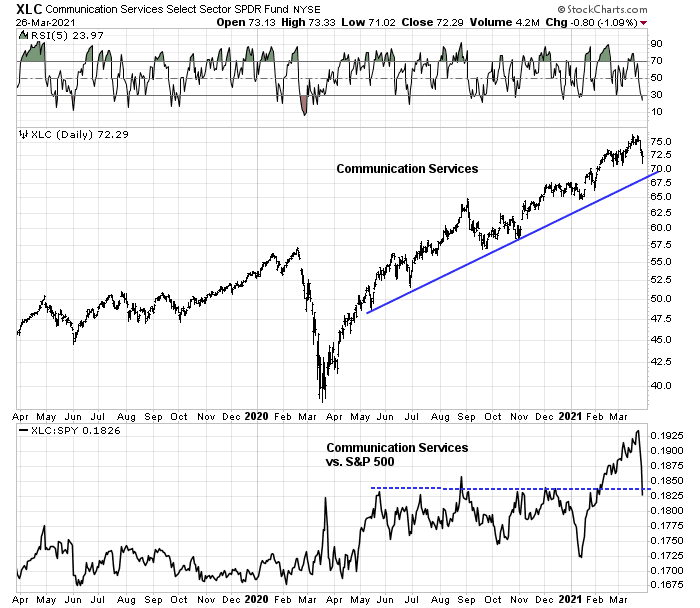
The one bright spot within growth sectors was communication services, which exhibited strong absolute and relative strength owing to the superior performance of its two largest components, GOOG and FB – until recently.
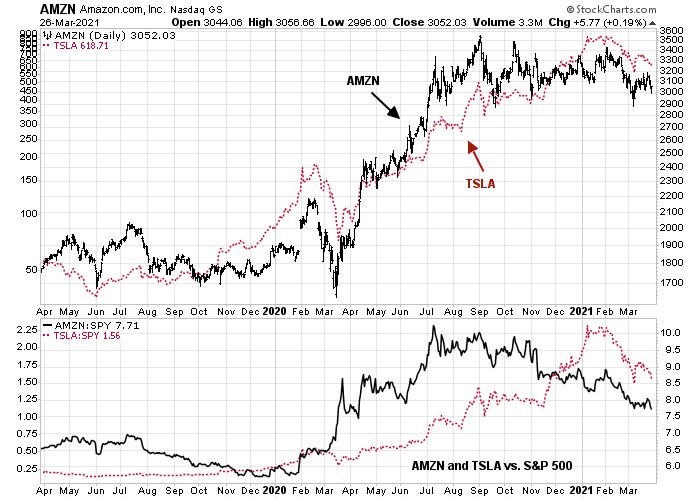
From a factor perspective, the consumer discretionary sector can be divided into two. The growth heavyweights are AMZN and TSLA, while the remainder can be classified as more traditional cyclical stocks. AMZN has topped out and has been trading sideways since last summer, and the lack of relative strength can be seen clearly in the bottom panel. TSLA began weakening in early 2021, though its relative uptrend remains intact.
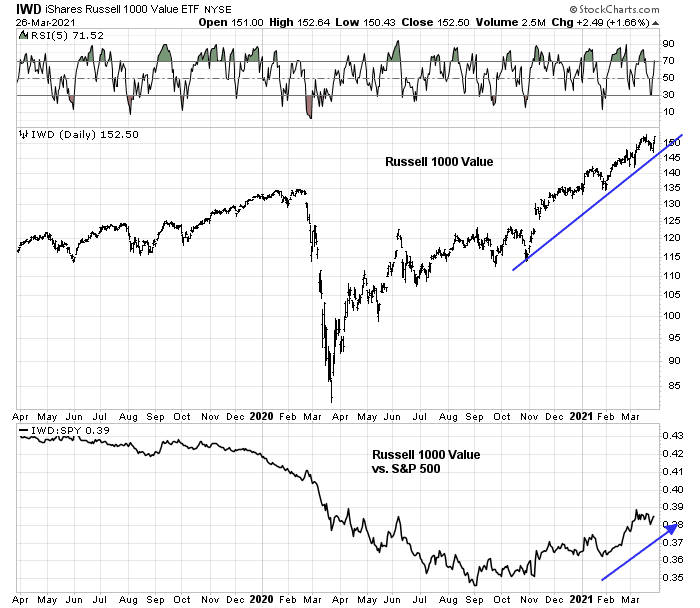
In contrast to the faltering growth names, value stocks are performing much better. The Russell 1000 Value Index remains in a well-defined uptrend. The index also made a relative saucer-shaped bottom last summer and its relative uptrend is intact.
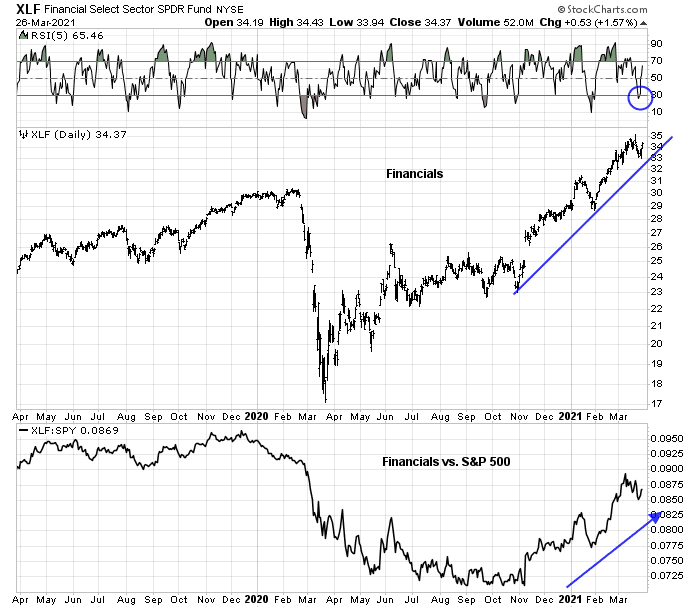
The technical patterns of sectors in the cyclical and value categories are all very similar to each other. Take financials as an example. Financial stocks remain in an absolute uptrend despite the recent weakness when it flashed a 5-day RSI oversold signal last week and rebounded. Relative to the S&P 500, this sector is showing the typical saucer-shaped relative bottoming pattern of value stocks.
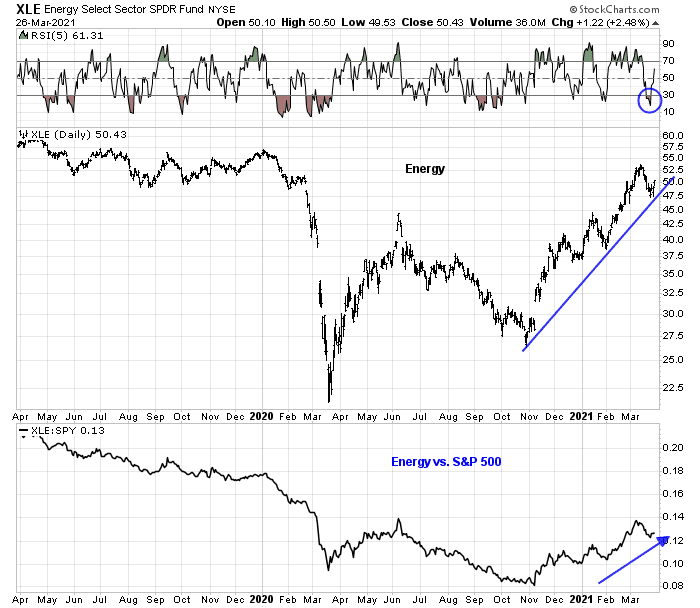
Energy has recently been another favorite among the value and cyclical crowd. Energy is also in an uptrend after recovering from an oversold condition. It also remains in a relative uptrend.
Material stocks are also in an absolute uptrend, though the relative uptrend is a bit choppy.

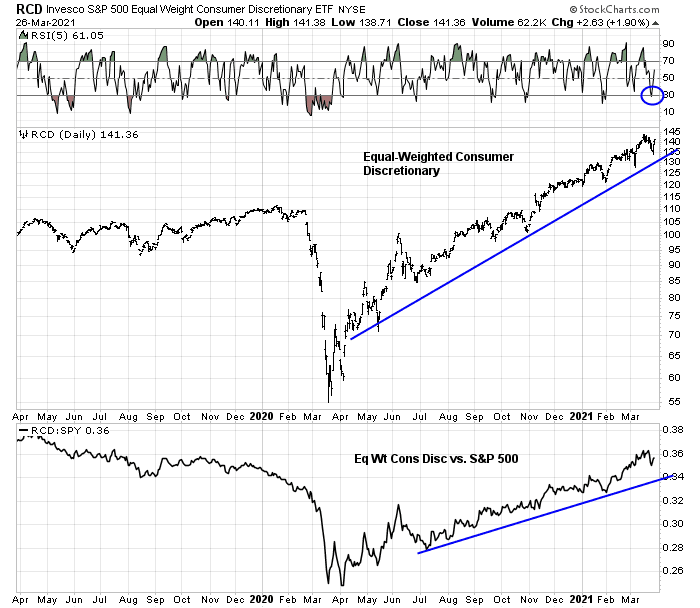
I wrote earlier that consumer discretionary stocks can be divided into two groups. The heavyweights are growth stocks, AMZN and TSLA, while the remainder represents cyclical plays. An analysis of the equal-weighted consumer discretionary sector which lessens the impact of its growth components shows that this sector is in strong absolute and relative uptrends.
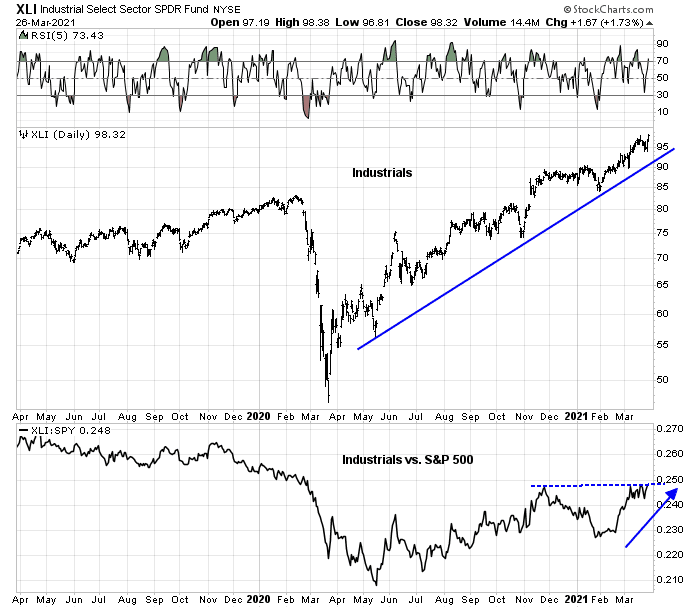
Industrial stocks are also considered to be value and cyclical plays. This sector is one of the relative laggards within the factor group. The sector is in an absolute uptrend, but its relative performance is more uneven.
The remaining sectors of the market, namely healthcare, utilities, and real estate, can be classified as defensive in nature. Most have started to bottom relative to the S&P 500 during the January to March period but none are exhibiting leadership characteristics.

In summary, a technical review of market leadership shows widespread evidence that the reflation trade is strong. There are few signs of technical deterioration that warrant significant caution.
Top-down support for the reflation bull
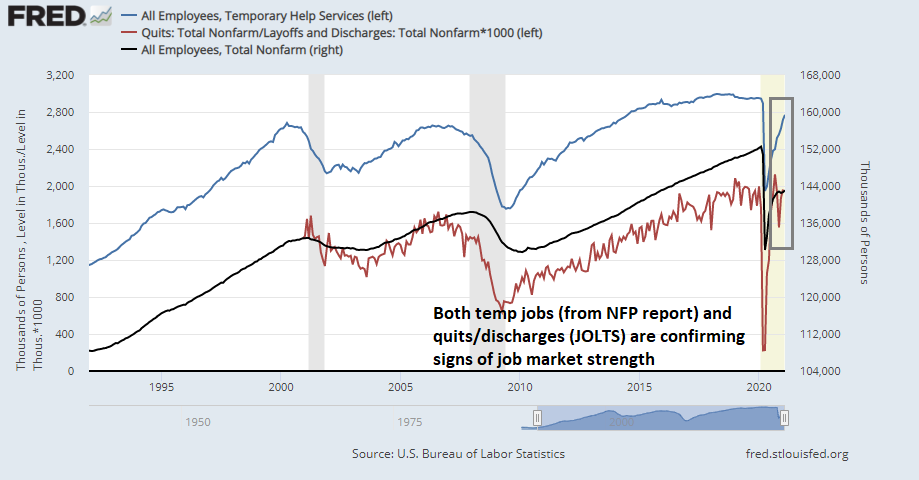
In addition, the macro backdrop is also supportive of the reflation trade. Leading indicators of the jobs market such as temporary employment and the quits/discharge ratio are signaling further gains in employment.
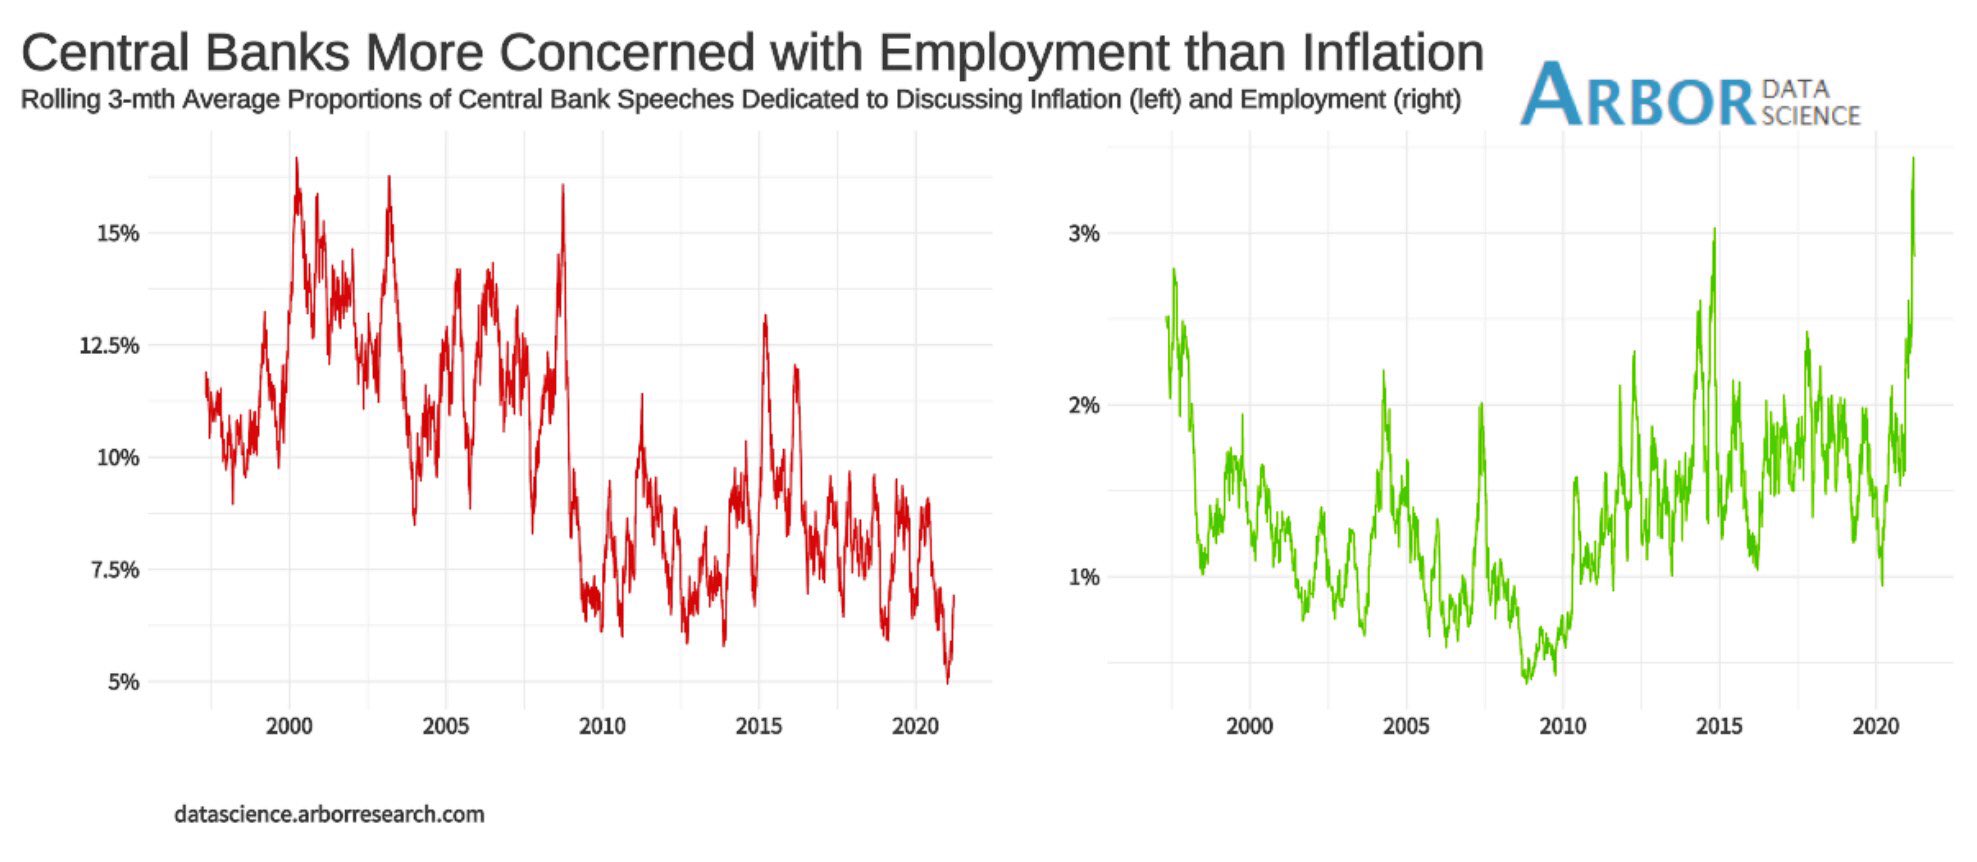
Central banker rhetoric has pivoted from fighting inflation to full employment, which is also supportive of economic growth.
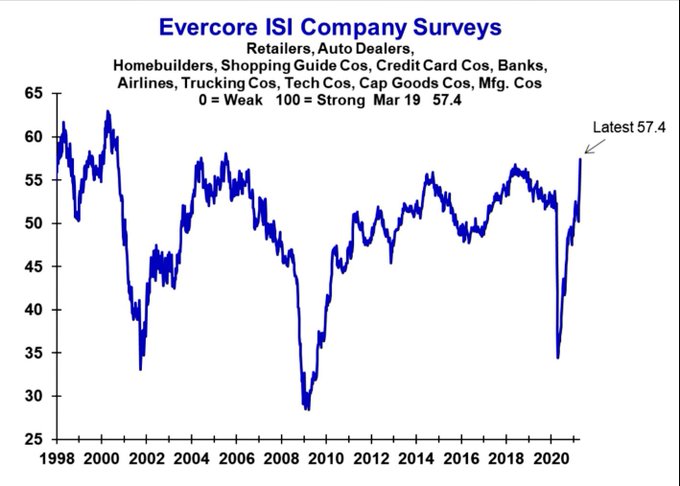
From a bottom-up perspective, Evercore-ISI’s company surveys are showing a bullish pattern of economic recovery.
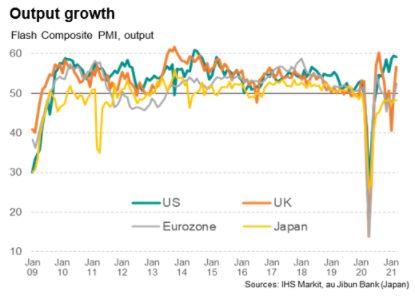
As well, March flash PMIs show that the US continues to lead the major developed economies, but the UK and eurozone are rebounding strongly.
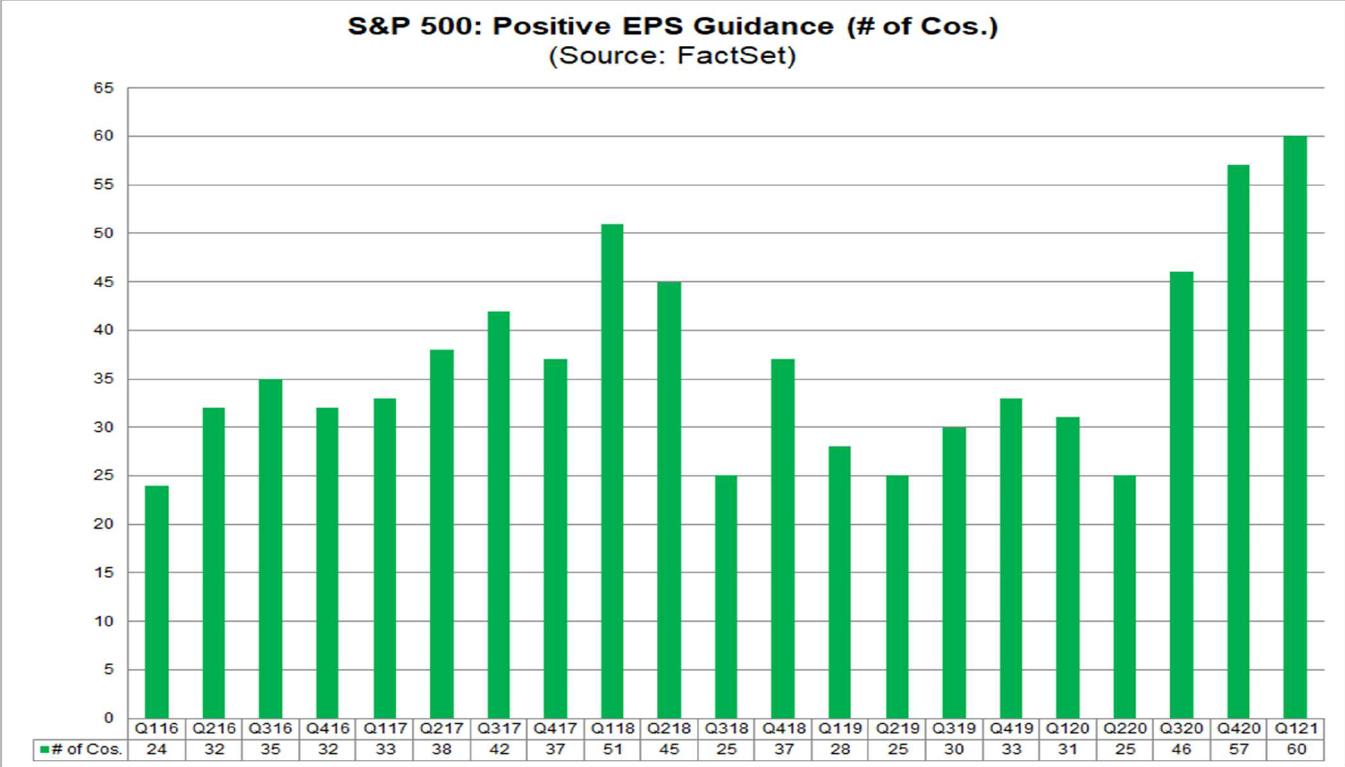
Lastly, FactSet announced that a record number of S&P 500 companies had issued positive earnings and sales guidance for the next quarter.
Value, growth and rates
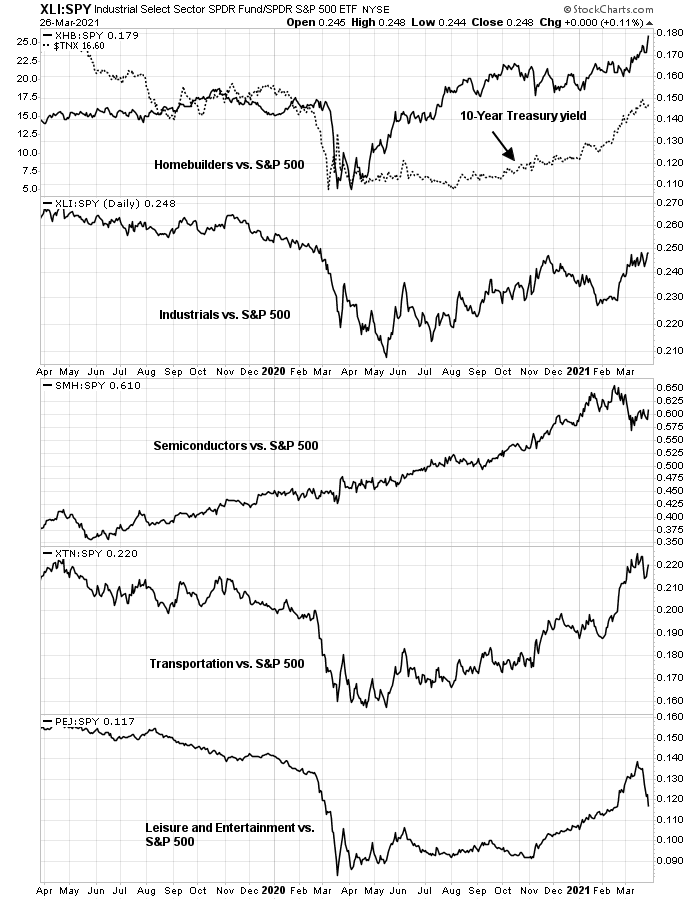
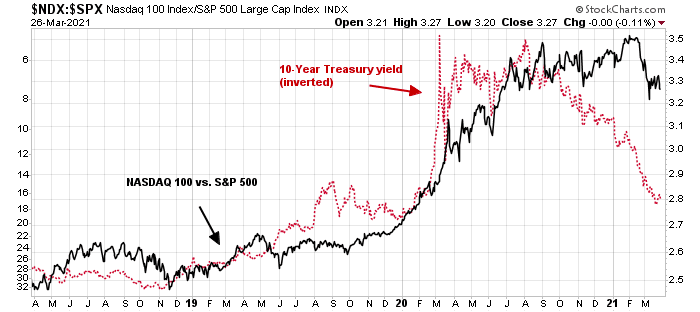
More importantly, rising rates haven’t really dented the reflation trade. Take a look at the relative performance of different cyclical industries to the S&P 500 and the 10-year Treasury yield. In particular, interest-sensitive stocks like homebuilding is on fire despite the rise in yields.
What about the recent reversal in yields? Aren’t growth stocks more sensitive to interest rates and won’t a bond market (price) rally spark a surge in the growth sector?
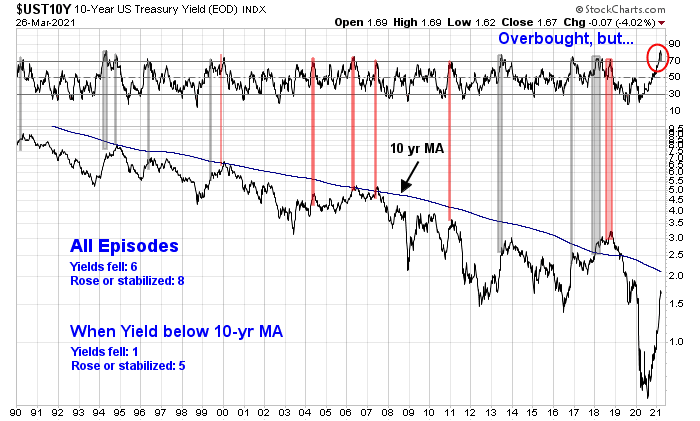
There is no question that the bond market has sold off too quickly and a relief rally may already be underway. The big picture, however, tells another story. An analysis of the history of the 10-year Treasury yield from 1990 shows that there were 14 episodes when the yield became overbought (and therefore bond prices became oversold). Of the 14 episodes, yields fell in six instances (shown in pink) and either stabilized or rose in eight (grey). However, this analysis occurred during a period when yields had been in a long-term downtrend. If we throw out the occasions when yields were above the 10-year trend, yields fell only in one instance and either stabilized or rose in five. Since the current circumstances fall into that category, the odds argue for further increases in yields.
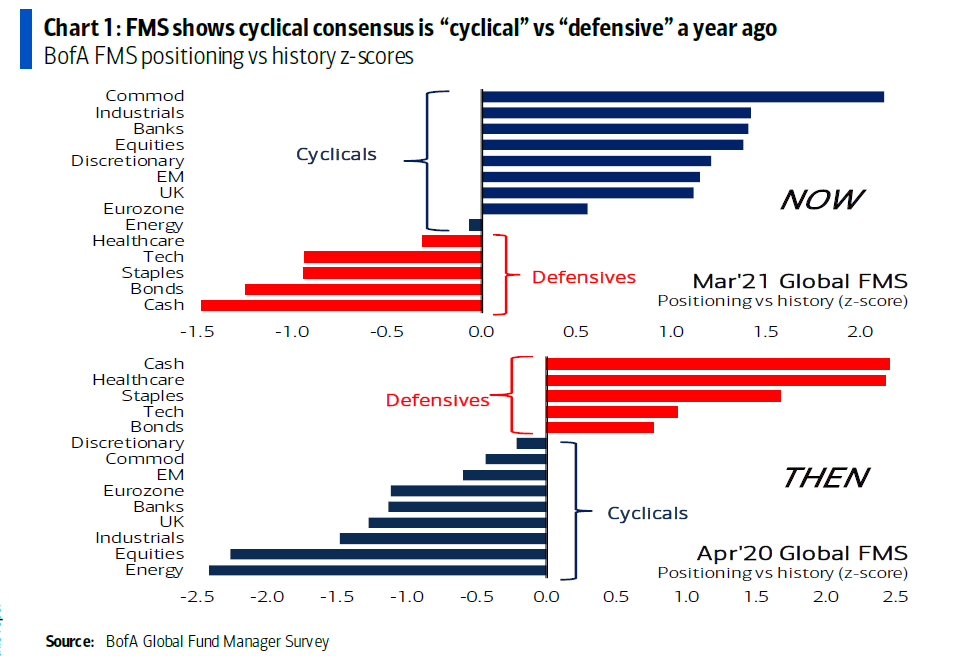
In conclusion, there is a definite risk that the reflation trade is overdone in the short-term and a reversal can happen at any time. The latest BoA Global Fund Manager Survey shows that positioning has shifted into the cyclical trade in a big way.
However, a bottom-up technical review and a top-down macro review indicate that the reflation investment theme is showing no signs of intermediate-term weakness. Investors should view any weakness in value and cyclical stocks as opportunities to buy the dip.
Cam mentioned Taiwan being invaded a few months ago. Seems like an invasion is becoming more likely.
Successfully invading and occupying Taiwan, despite the diplomatic, moral, military and economic consequences, will set a similar precedent that the US has already done over the last 40 years regarding military intervention. The key difference is that the US at least attempts to get some sort of international consensus via some sort of diplomacy. Maybe the play is similar to what Putin was able to do in the Ukraine and Crimea?
A successful occupation of Taiwan could result in the nationalization of Taiwan Semiconductor, the second world’s largest semiconductor manfacturer.
The real window of vulnerability was during the Trump to Biden transition. The US has shored up alliances in the region, which will make it very costly for China to invade now.
Taiwan is not the main concern for CCP. Xinjian is. It is potentially very explosive. Most people alive today have had a chance to witness the fall of Berlin Wall and the disintegration of USSR. Now we have a realistic chance to see the fall of CCP. When that happens it is going to be very messy, especially for Xinjian ad Tibet areas. If you examine Xinjian’s history you will immediately recognize the explosive nature of it. Now you know why UK, US, and many other countries are in such a hot pursuit of Xinjian issue.
If the East Turkstan is actually established in Xinjian, China will immediately fragment into several countries. There are a lot of Muslims living in the central part of China. The number is also quite big in southern part of China. Inner Mongolia will merge with the other Mongolia immediately. Manchuria might be another country. I am patiently waiting for the day.
On the charts, I see the Value sectors have recently dipped both nominally and in relation to the market. So. I’d say this is the dip to buy, no waiting needed.
Innovative Growth sectors have a problem. Many of the stocks in the various indexes have small market caps and large institutional ownership. As investors pull money out because their prices are falling hard, it will put undo pressure on these smaller company’s shares. I read about two small New Zealand green energy companies that were being dropped from a green energy index that will take almost thirty days of average share trading volume to exit.
This has always been the risk of passive ETFs following indexes that have illiquid components. That risk might be coming into play with strange results.
I was looking for a reentry point for some of these innovative growth ETFs but I’ve decided to step back in case a wave of growth ETF selling causes shocking liquidity problems. Been there, seen that in the past.