Analysts who try to call the direction of the US equity market are facing an especially difficult time as they are encountering a bewildering array of both bullish and bearish sentiment readings. That’s because the stock market has bifurcated into a growth stock market and a value stock market. There is no more single stock market anymore.
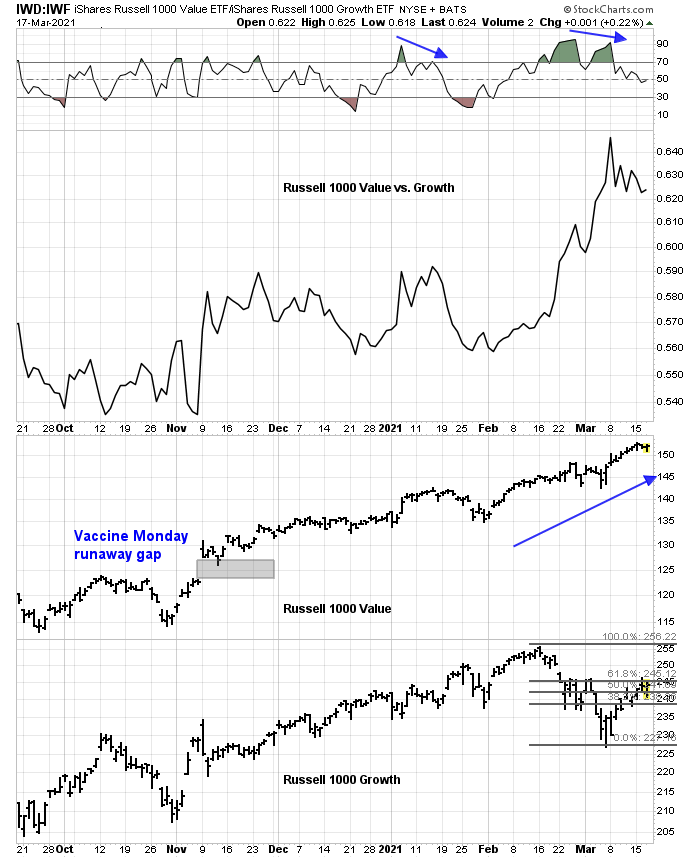
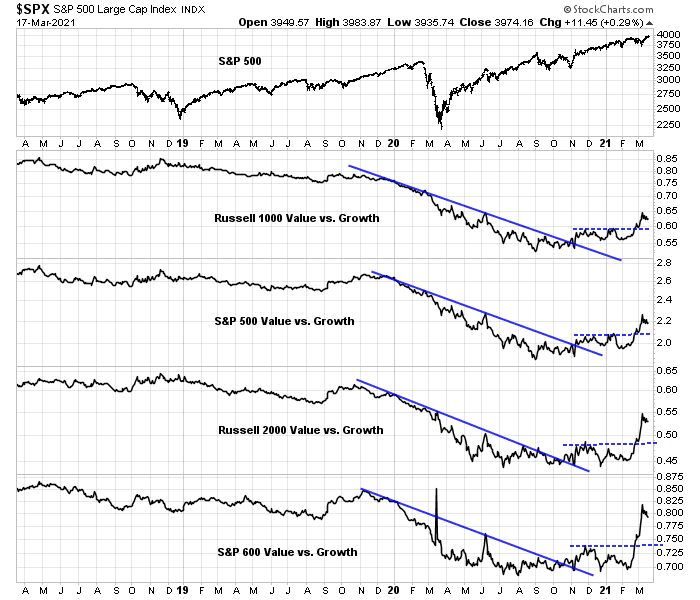
This chart of the Russell 1000 Value to Russell 1000 Growth ratio tells the story. After value stocks opened a “Vaccine Monday” runaway gap last November, value stocks have made their way higher against growth stocks. The ratio became extended and exhibited a negative 5-day RSI divergence in early January. Both value and growth stocks proceeded to pull back, with value the underperformer. The ratio exhibited another negative RSI divergence in early March. This time, growth stocks rallied with a vengeance while value stocks were mostly flat. The Russell 1000 Growth Index skidded but recovered and its advance is currently testing technical resistance defined by the 61.8% Fibonacci retracement level.
This account of internal rotation underscores my point that this is a tale of two markets. Indeed, it was the best of times and the worst of time for growth and value. There are no more bulls and bears. You can be a value bull and growth bear, or a growth bull and value bear.
Will the real bullish or bearish indicator please stand up
Sentiment models are generally useful when readings are extreme. But never in my decades of market analysis have I seen a set of both bullish and bearish extreme sentiment and technical conditions.
Consider the NAAIM buy signal that I highlighted last week. The NAAIM Exposure Index, which measures the sentiment of RIAs, plummeted to below its 26-week Bollinger Band. This has been a surefire trading buy model. Out of the 11 buy signals in its 14 year history, it has “failed” only once inasmuch as the market only traded sideways in early 2008.
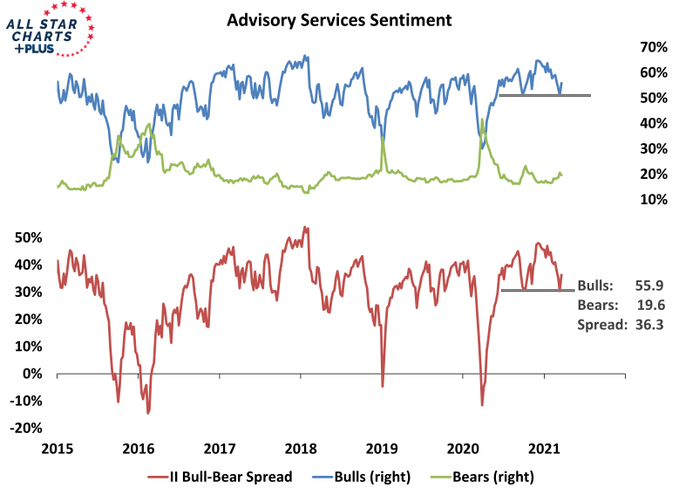
As well, Investors Intelligence sentiment conditions have stabilized and appear constructive for the bull case. II bulls expanded after making a bottom, and so did the bull-bear spread. These conditions indicate that a possible tradable bottom.
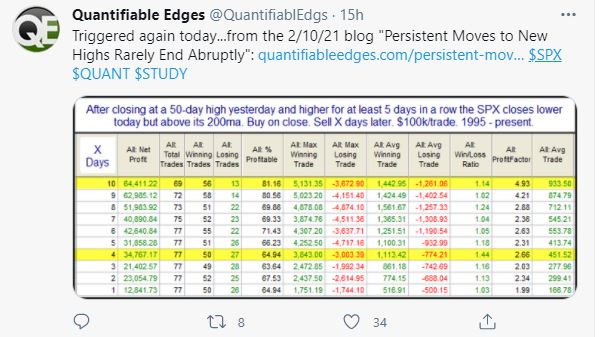
Rob Hanna at
Quantifiable Edges pointed out after yesterday’s close that the market had pulled back after exhibiting a strong run, indicating a bullish setup for further gains.
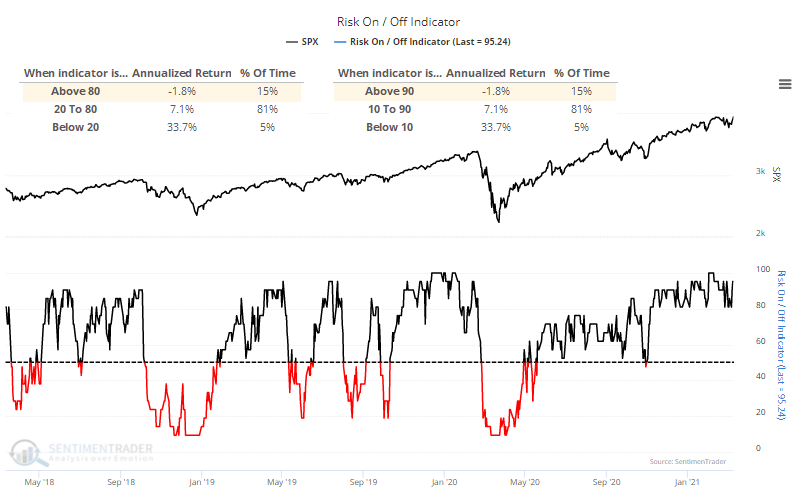
On the other hand, Jason Goepfert at
SentimenTrader observed that “Investors are nearing a record in Risk-On behavior”.
In addition, both the NYSE McClellan Oscillator (NYMO) and the 5-day RSI of the S&P 500 appear streched. Sustained bull legs usually don’t begin under extended conditions like this.
Technical indicators are usually either bullish or neutral, or bearish and neutral. It’s highly unusual to see so many at both bullish and bearish extremes. This is explained by the violent rotation between growth and value stocks and the market action is creating misperceptions among investors.
What’s the real story?
To resolve this confusion, it’s useful to think of the stock market in a new framework of growth and value stocks. There is no single market, there are two.
Consider the intermediate-term trend for the value/growth ratio. While growth has staged a counter-trend rally, the rebound appears to be petering out and the trend remains value friendly.
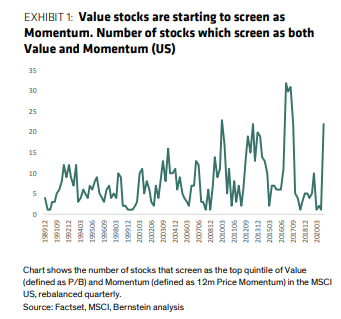
Another tailwind for value stocks is about to appear.
Bloomberg reported that price momentum will increasingly tilt toward value names.
Next Tuesday marks the 12-month anniversary of the MSCI AC World Value Index’s eight-year low, a key timeframe that many quantitative models use to screen for momentum shares to buy. May 6 would be the six-month anniversary of the relative low for value stocks against their growth and momentum peers — their outperformance began after the election of U.S. President Joe Biden.
The recent snapback in growth stocks was a golden opportunity for value investors to buy the dip. While it’s always difficult to look through the market noise on FOMC day, look to the trend as being your friend – and the trend is value stocks.
Finally, don’t be afraid of rising rates. The Rising Rates ETF (EQRR) is heavily weighted in value and cyclical sectors. EQRR remains in a well-defined uptrend, both on an absolute basis and relative to the S&P 500.
The Fed’s statement, dot plot, and the statements from Powell’s press conference all underscore the point that the market backdrop is reflation friendly. Long live the value and cyclical trade!
Addendum: As a point of clarification, a reader asked me to define what I mean by growth and value. In general, growth stocks can be found in technology, communication service, and AMZN and TSLA in the consumer discretionary sector. Value and cyclical stocks are in financials, industrials, energy, materials, and consumer discretionary excluding AMZN and TSLA.


Powell saying that the Fed will wait to ask on actual growth and unemployment numbers and NOT on projections indicates they will be behind the curve on tightening. This is not good for bonds which is a negative for Growth stocks. It’s positive for Value since they are economically sensitive and this policy will let the economy run hot after it recovers.
The thing that is tanking as Powell speaks is the US dollar. That is good for the Commodity Value stocks.
Good debunking of the ‘duration’ narrative as an explanation of the under-performance of growth stocks. It’s about the levle of confidence in cyclical earnings, not rates.
https://twitter.com/Jesse_Livermore/status/1372023075672309761
That doesn’t make me bullish on growth. Quarter-end rebalancing is coming (usually happens around March 23rd) and if there is further strength in growth stocks it will be used to lighten up on these positions (ok, that is the opinion of my crystal ball) But back to what happened, Powell again declined to embrace yield-curve control, the Fed is going to allow a steeper yield curve as long as the move is well-behaved and orderly.
Adding back to EEM.
Trimming back (further) on X.
QQEW finally doing its thing (ie, pulling back less than QQQ).
Trimming back on KRE/ KBE/ XLF.
Opening a position in AMZN.
Adding back to AA/ XLE/ IXC.
Beginning to close out positions.
X/ AA/ XLF/ KBE/ KRE/ VTV/ EFV all off here.
Closing QQEW here (surprisingly, for a small gain).
Closing RYSPX at the 730 window (@ a gain relative to the 730 opening price on Monday).
I’m starting to think Alex has it right. We may see a better buying opp next week.
Taking a minor loss in AMZN here.
Closed 50% of my index funds yesterday (VVIAX/ VTRIX/ VTSAX/ VEMAX). Will close the other half end of day.
All other positions off here. Joining Alex on the sidelines.
Closing 50% of my positions yesterday was just a matter of hedging my bets.
Closing all remaining positions today was different – I’m worried about a bull trap. Nothing worse than being trapped in positions – better to sell when I can than when I have to.
and just like that, the twitter thinks the market is going to crash.
If I read his comments correctly, then Doug Kass (who has been a bull on banks since the summer of 2020), sensed buying exhaustion in the sector yesterday.
Value may be the new momentum, but nothing goes up in a straight line. Cam recommends buying the dips – not the rips. So I think Alex called it correctly. We’ll probably see a better buying opp next week (maybe even later today).