Preface: Explaining our market timing models
We maintain several market timing models, each with differing time horizons. The “Ultimate Market Timing Model” is a long-term market timing model based on the research outlined in our post, Building the ultimate market timing model. This model tends to generate only a handful of signals each decade.
The Trend Asset Allocation Model is an asset allocation model that applies trend following principles based on the inputs of global stock and commodity price. This model has a shorter time horizon and tends to turn over about 4-6 times a year. In essence, it seeks to answer the question, “Is the trend in the global economy expansion (bullish) or contraction (bearish)?”
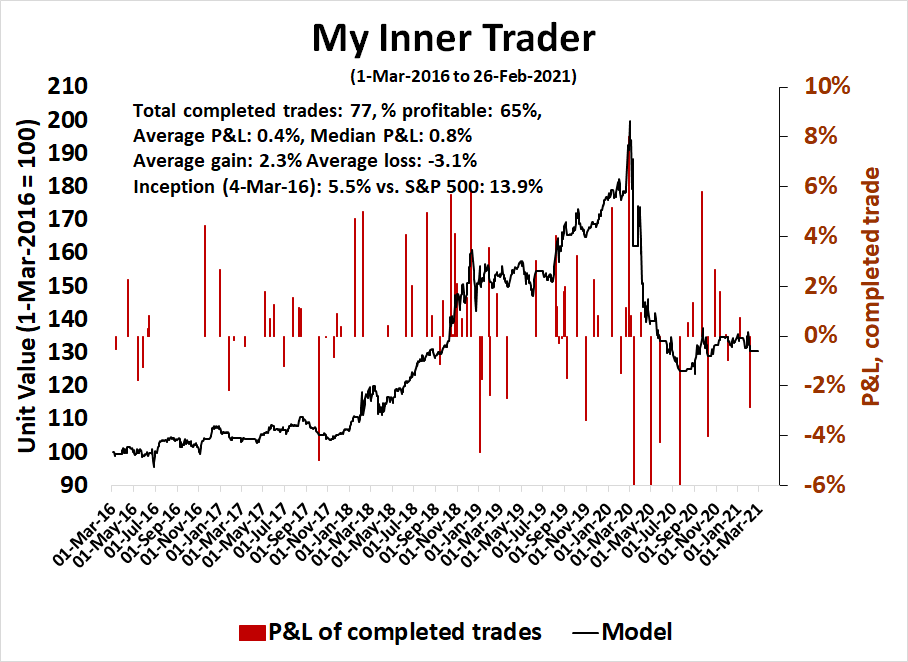
My inner trader uses a trading model, which is a blend of price momentum (is the Trend Model becoming more bullish, or bearish?) and overbought/oversold extremes (don’t buy if the trend is overbought, and vice versa). Subscribers receive real-time alerts of model changes, and a hypothetical trading record of the email alerts are updated weekly
here. The hypothetical trading record of the trading model of the real-time alerts that began in March 2016 is shown below.
- Ultimate market timing model: Buy equities
- Trend Model signal: Bullish
- Trading model: Bullish
Update schedule: I generally update model readings on my site on weekends and tweet mid-week observations at @humblestudent. Subscribers receive real-time alerts of trading model changes, and a hypothetical trading record of those email alerts is shown here.
Subscribers can access the latest signal in real-time here.
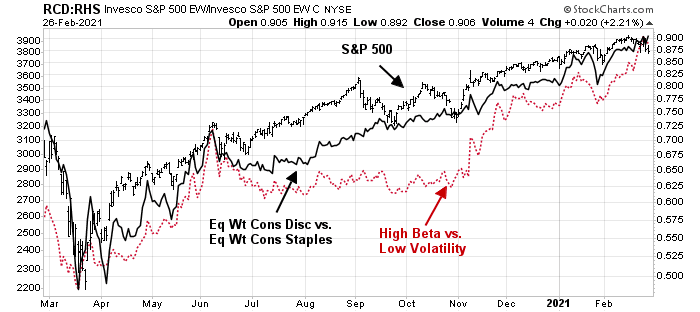
More signs of a Great Rotation
A great gulf
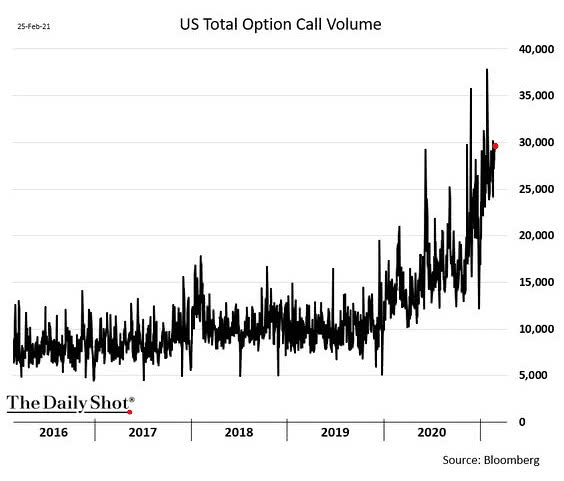
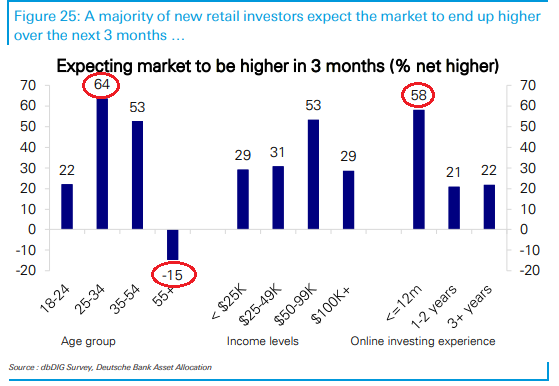
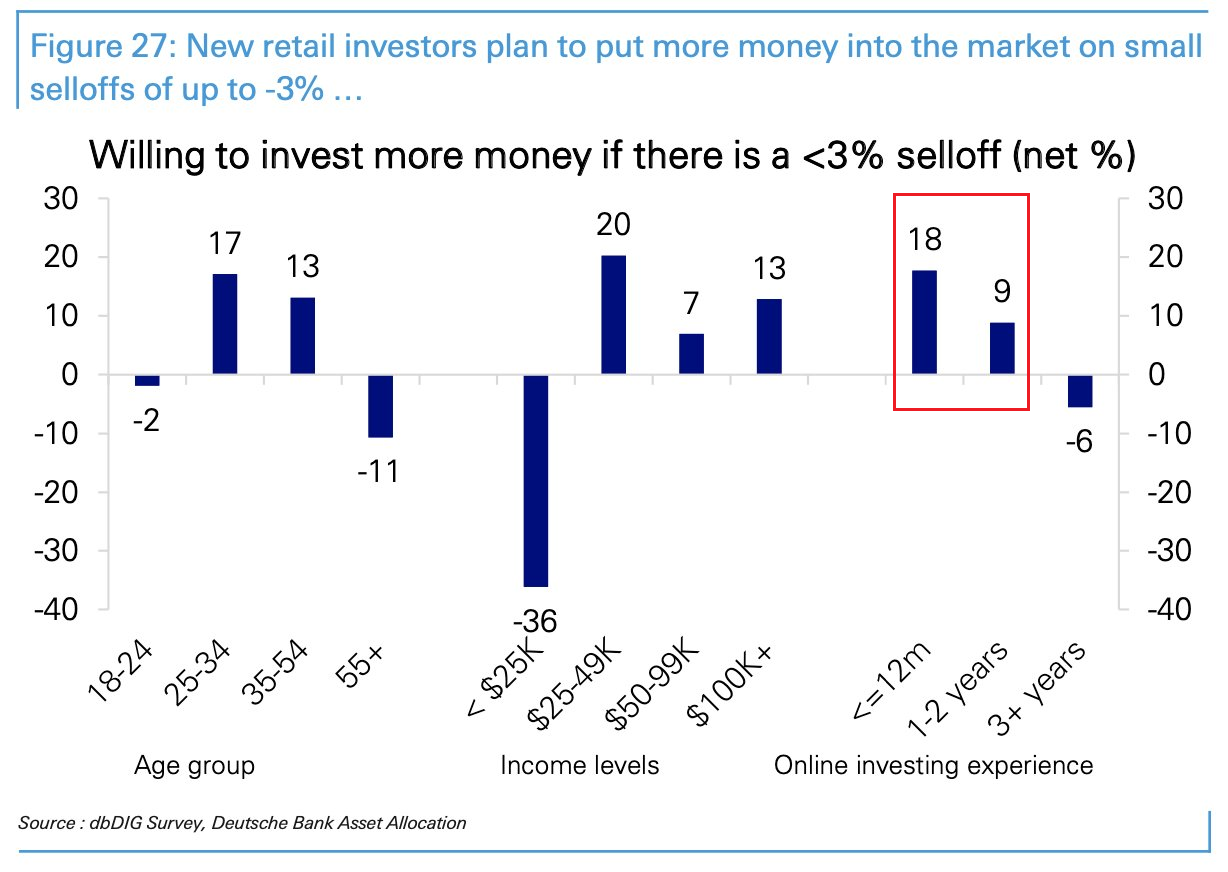
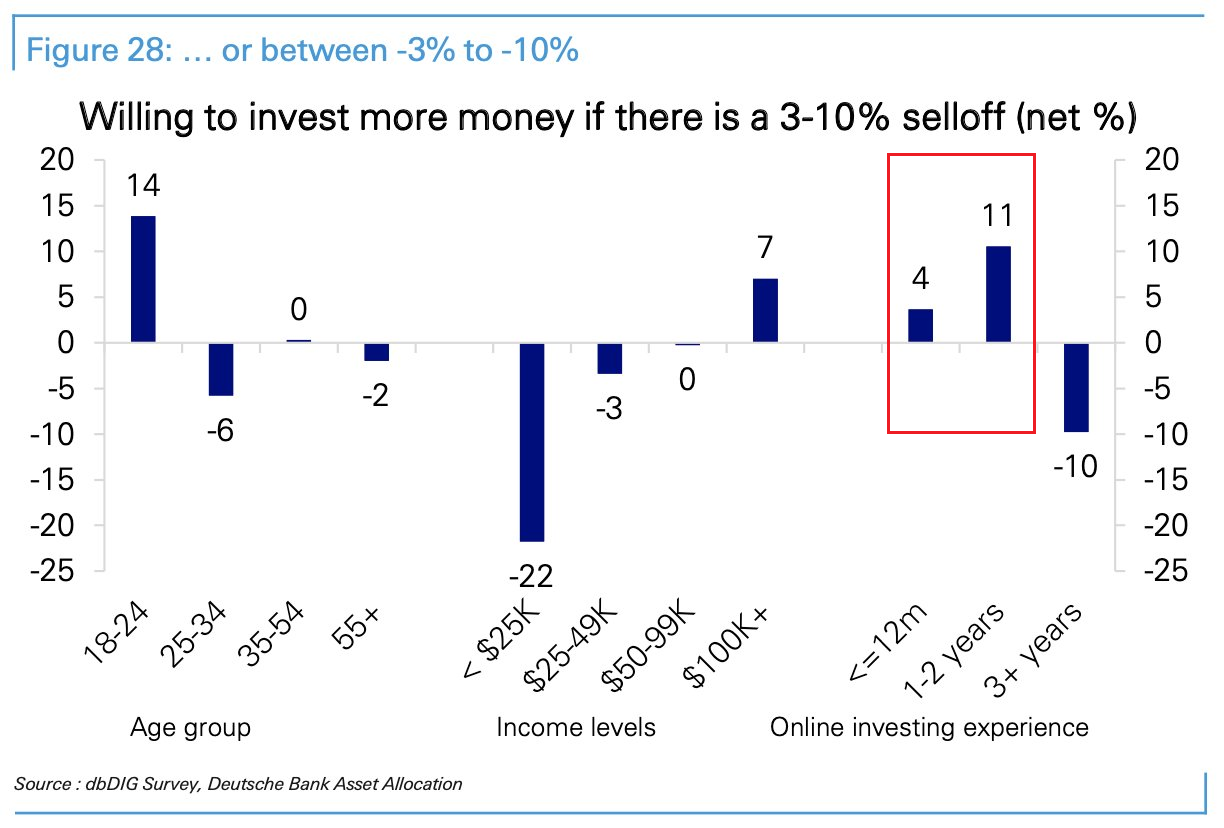
Waiting for a small investor shakeout

The 56-week pattern in play?
Here is how it works: any time the S&P 500 index (SPX) rises more than five percent within a 20-session stretch, 56-weeks later there is often a sell-off of varying proportions. This happens consistently enough that if you track through the data, you can calculate that the average return for the 40-day period at the end of 56 weeks is almost a full one percent lower than the average return for any other 40-day period over the past 26 years. The reason for bringing it up now is that, as shown in the chart below, the recent pullback came at the beginning of such a pattern. Even more interesting is that three more ending patterns are due to create selling in close proximity during the second quarter of 2021.
The 56-week pattern has a simple explanation. To take advantage of favorable tax treatment, many high-net worth investors and professional money managers prefer to hold positions longer than one year. What that means is that if a lot of them buy at the same time, it shows up in the market averages. A little more than a year later, there comes a point where a lot of money is ready to be taken out of one position and moved into another.
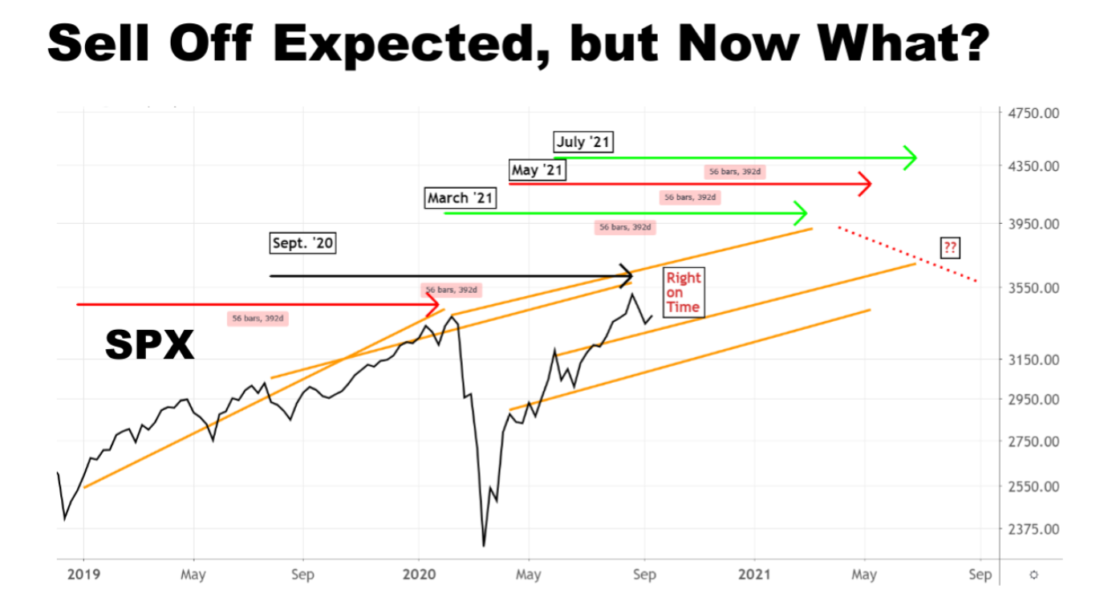
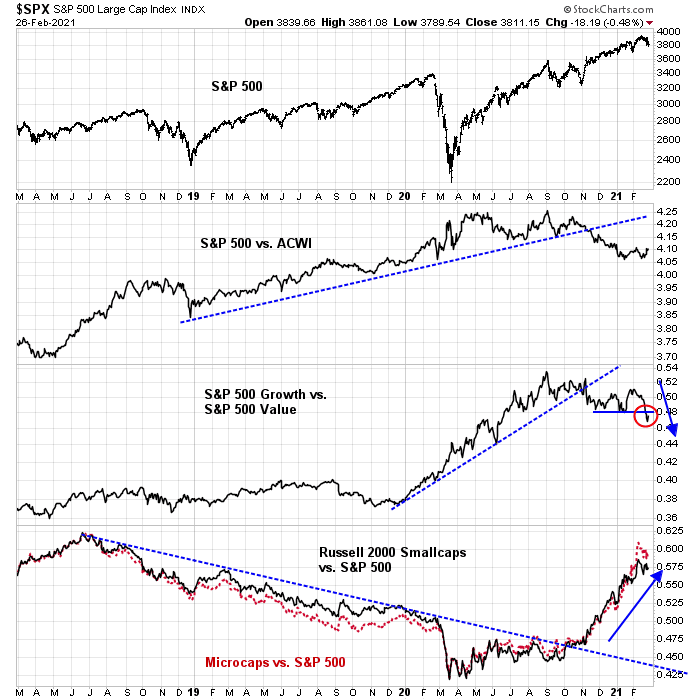
Scott’s analysis calls for market weakness in March, followed by hiccups in May and July. Let’s take this one at a time, starting with March. The market is undergoing an internal rotation from growth to value. Unless another bearish catalyst appears on the horizon (see the risks outlined in No reasons to be bearish?), the most likely outcome is a period of sideways choppiness with limited downside risk for the S&P 500.
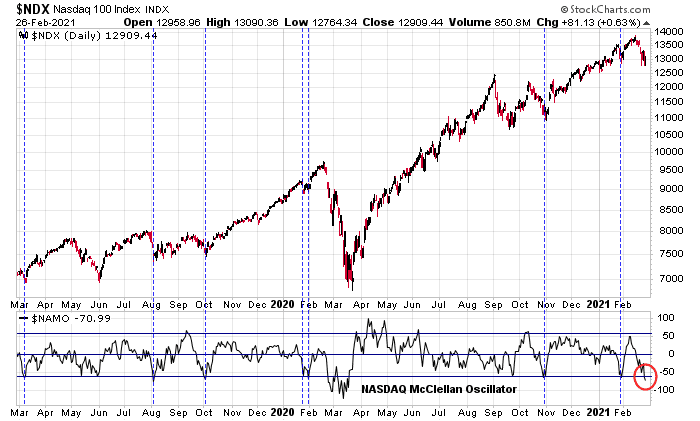
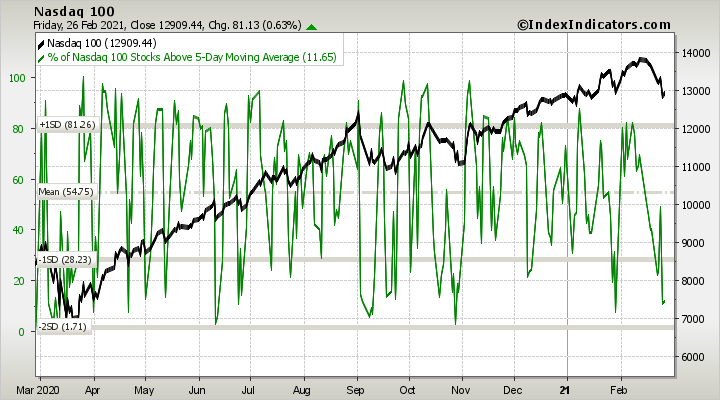
Tactically, the market may stage a relief rally in the coming days. Both the S&P 500 and NASDAQ 100 are highly oversold and due for a bounce early in the week.
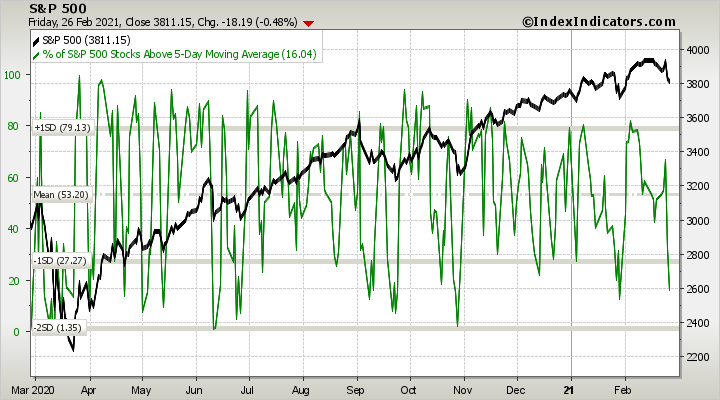
As well, NYMO has also flashed an oversold reading as the S&P 500 tests its 50 dma.

But don’t be fooled by any rally. We are in need of a small investor sentiment washout that hasn’t happened yet. These conditions argue for a period of choppiness and growth to value rotation in the coming weeks.
Disclosure: Long TQQQ
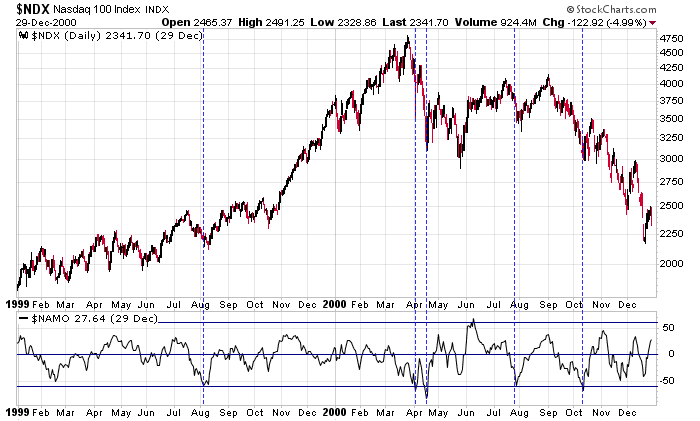
If we get a technology sell off and a washout of new retail investors sending growth stocks materially lower what is the most likely outcome/s for value stocks? Will the capital outflow from growth continue to find its way into value, maintaining or even boosting value stocks, or will a growth selloff spook the entire market? What happened back in 2000 when technology crashed, is this a relevant comparison?
From March of 2000 peak in markets, NASDAQ fell 50% in the first 9 months of the bear, Growth stocks in the S&P were down 27% and Value was up 5%.
Many institutions must stay 100% in stocks and therefore switch horses. Also when stocks fall, many investors rebalance from fixed income to stocks and they may prefer Value if Growth is tanking.
Of the top of my head, the peak to bottom loss in Nasdaq was 80% give or take. Let us put it on record.
Peak to bottom S&P 500 loss was around 56% (circa year 2003).
Nasdaq made a long bottom lasting most of the decade from 2000-2010.
Most other major indices/ETFs/Mutual funds/Value/growth/dogs/cats/cattle/chickens, lost at least around 60%, if they had market level exposure to technology. They were all correlated. Please be assured, of the “correlation” aspect.
At the present time, there are some non-correlated assets, chief amongst them being non-US equities because of their decade long under performance to US markets. Sure enough there are smaller segments of US markets like Energy and Financials that are in the “cheap” basket. Commodities are in this group. However, these are smaller segments of investment universe (Energy, Financials, Healthcare, commodities), and making a “diversified” portfolio using these creates a heavily concentrated portfolio of assets (much like Kathy Wood’s ARK funds).
Energy has become almost a non-investible asset because of erratic polices of OPEC. Energy has become a boom bust cycle, even worse than traditional semiconductor cycle. It is difficult to meaningfully invest in assets that routinely suffer 70-80% drawdown and sustained bear markets (example is energy from 2014-2020).
Healthcare is another anomalous industry which is subservient to losses in patents, erratic patent approvals, uncertain regulatory burden and political over reach. The mRNA technology would have never seen the light of the day were it not for Covid. Another example is Biomarin pharma. Its Hemophilia franchise is God sent for Hemophilliacs, but was disapproved by FDA on frivolous grounds (watch this space). Banking industry has been destroyed globally by regulators (how does one invest in these “value sectors”).
> is this a relevant comparison?
Circumstances not at all similar.
Sure, the growth stocks that went up the most in the last year may chop around for a while, who knows if TSLA will deliver on all the expectations built in.
But by 2000, the average ‘man in the street’ investor had been so rewired by the preceding years that was mentally impossible to accept that the tech party that had carried on over the previous years was well and truly over. Many rode the Titanic all the way to the bottom.
Now, investors have 2000 as a historical anchoring reference, and are humming along in the back of their minds, the Who…’We Won’t Get Fooled Again!’
Small investors will be getting a check from the government when the $1.9 Trillion plan is passed. That was a big boost to the Robinhood crowd last year and could mark the future low in the stocks they like.
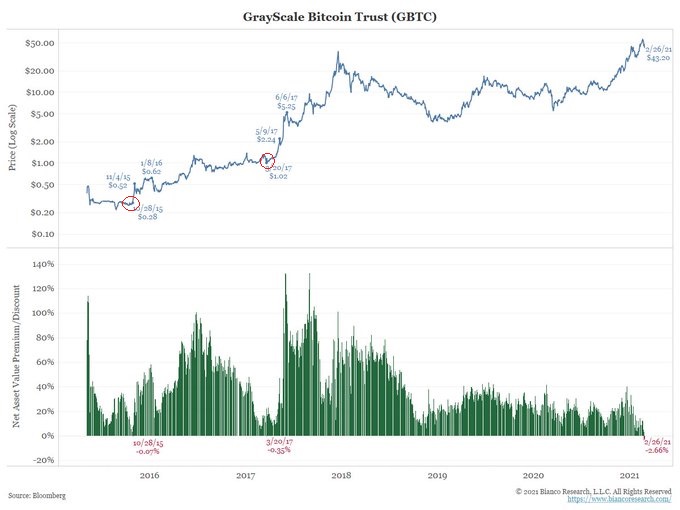
There have been a number of Bitcoin ETFs starting trading lately. These give investors a fairly exact trading price minute by minute. The old vehicles such a Grayscale are closed ended funds that can and did have huge swings above 9once 30%) and below asset value. It was used by institutions because it was safe from fraud. I expect the ETFs are attracting money away and hence don’t think the discount to asset value is the same sentiment signal as before.
I am now looking at markets in four narrative segments Regular Growth, Innovative Growth, Regular Value, Resource Related Value. So the herd is not just goats and ostriches now. It’s regular goats and mountain goats with Ostriches and Emus. LOL
The message is that each of these four has a life and a narrative of its own.
For example, Regular Value versus Resource Value. Value can be segmented between inflation-loving companies and inflation-hating companies. In the 1970’s high inflation era (I was there), inflation hating Value stocks like stores, supermarkets, banks, auto makers, utilities (you get the picture) underperformed because input price rises compressed margins and higher interest rates made dividends less attractive. On the other hand, resource Value stocks saw margins go up geometrically as their commodity went up in price many times faster than their input costs.
Let’s look at Growth. Innovative Growth has no profits and trades on the imagination of investors for future sales. This means investor sentiment swings are key. Innovative sentiment seems to be peaking. Regular Growth has real profits and investors can optimistically price stocks when sentiment is high but not stupidly so. The stocks have earning growth that bail out investors who pay too much. Their consistent future growth is discounted at the current interest rate and this means shifts in rates are a factor. The recent surge in rates is negative for Regular Growth.
We are in a bull as Cam says and this means picking what animals you want to own from the herd. The trick is not to be a chicken!
Thanks, Cam. Threading observations like the 56-week rule into your posts in a timely fashion is a hallmark of your analytical style, which is quite unique.
Following on my comments from night, which were incomplete as I was pulled away – I sense that having either worked with Bob Farrell or with a team that worked closely with him, you have a deeper appreciation of the stories/nuts and bolts behind his trading rules. Not many of us have the opportunity work with legends. In any case, my point is that being wrong for long stretches is normal. Sticking with time-tested rules/approaches and a process that you’ve developed and honed over time is the secret to accumulating wealth in the capital markets.
And that’s something that you both do well and communicate well to your readers.
I actually never worked with Bob Farrell, though I was on the team with Mary Ann Bartels, who was the Institutional Investor ranked ML’s chief technical analyst.
We were also co-managers of a European fund in a previous life.
Here’s one of Farrell’s rules that doesn’t get much play, but I identify with perfectly-
‘Fear and greed are stronger than long-term resolve’
We enjoyed a late dinner (no point in fighting commute traffic over the Bay Bridge) last night with my daughter and her fiance. They recently bought their first home, a small 2BR nestled in the Oakland Hills with views of both the Bay Bridge and Golden Gate. Here’s what we noticed while dining at the local Thai place.
(a) Businesses are thriving. Montclair is relatively secluded, so it’s mainly pedestrian traffic in the village and outdoor venues don’t create a problem.
(b) People appear to be quite happy and optimistic – including two relaxed cops on foot patrol. They’ve learned how to mask/ social distance with ease, and there’s a sense that while life isn’t exactly normal yet it soon will be the case.
(c) A woman was videotaping the contrails of a jet as it ascended, and the conversation topic at one table included traveling abroad.
(d) As we drove home, we noticed the freeways were flooded with normal weekend traffic.
I would agree with D.V. that the pandemic is mostly behind us.
As an aside – I couldn’t have asked for a better son-in-law. A project manager for Tesla who majored in…journalism! A guy really into creative culture of an earlier age. The bookshelves in the living room (it’s a small house) were lined with books I recognized from the Sixties/Seventies. A couple of novels by James Baldwin! A beat-up (but original) paperback copy of ‘On The Road.’ Miles was playing on a Technics turntable! He had to show my youngest son how to place the diamond needle on the LP. This house was a perfect fit – constructed in 1970 (with a nod from Sunset magazine), the previous owner(s) had not done any remodeling (left it ‘unmolested’ as he put it), and he’s free to restore many of the architectural elements (lots of wooden beams, if you remember that era).
My early days were spent working in a bookstore and playing jazz piano for a living (I dropped out of college three times). So I sympathize with the current YOLO movement.
https://www.cnbc.com/2021/02/26/bill-gates-on-when-well-stop-wearing-masks-clubhouse-interview.html
Can someone answer my question under discussions, ask me anything, titled “MLPs”? Thanks,
In a bull market too much knowledge and too much info is a liability. You just have to be roughly right, say 2-sigma or 67%, and you will be very successful and spared a lot of mental aggravation.
rx mentioned “On The Road.” The writer is Jack kerouac (Quebec origin). I never know this writer. A year and a half ago I took my kid to take SAT at local Bellarmine College Prep campus. I was wondering around and happened upon some pics in the library area. The pics piqued me because the person looks like actors in those old black-and-white Noir movies. So I searched the Internet and got to know he once worked in the railyard behind the campus. He had a friend settled in that area ( I think it is today’s Rose Garden area of West San Jose) and the circle of friends regularly gathered there. The railyard is attached to College Park rail station. I was always wondering why the area is called College Park. So I called one friend who was born and grew up in San Jose and got know the campus is the original campus of University of Pacific (now in Stockton).
Very interesting history. But I still have not read the book.
Bellarmine has a beautiful campus. Just a mile south of Santa Clara U, where two of my wife’s nephews went to school. I used to love driving down the tree-lined stretch of The Alameda between Taylor and Central San Jose – it felt like driving down Telegraph Avenue in Berkeley without the riffraff.
I would agree about being roughly right. Too much tweaking can damage both one’s portfolio and one’s state of mind. My wife and I have taken a relatively conservative approach to managing our net worth. Despite the conservatism (or IMO BECAUSE of the conservatism) we were able to achieve what Bob Brinker refers to as critical mass a few years ago. We’ve set aside a significant percentage in cash (in the form of CDs), which will be used for heath care/ LTC expenses if/when the time comes. The premiums for LTC insurance these days are quite high – so we’ve opted to insure ourselves instead – one benefit being the ability to transfer the funds to our children if the money remains unused.
I highly recommend reading the book. You can probably download the Kindle version for a nominal fee.
Still early going in the futures market, but it appears Cam made the right call. The market does a great job of exploiting recency bias, and I’m guessing most traders did not head into the weekend overweight the Nasdaq 100.
https://www.barrons.com/articles/global-stocks-rally-on-relief-over-bond-yields-51614592801?mod=hp_LEAD_1
“The Reserve Bank of Australia doubled its daily bond purchases to A$4 billion, sending yields on the Aussie 10 year sharply lower”. From this AM.
Printing presses will print, until morale improves!
Trimming half of my positions in PLTR/ QS/ NIO/ XLE/ JETS in the premarket session.
I’m going with the ST chop scenario that Cam foresees. So a tactical approach.
Trimming QQQ/ EEM/ FXI.
Trimming ASHR.
Closing PICK here.
Closing KRE.
Trimming VEU/ VTV.
Trimming XLF.
Closing ASHR.
My perspective right now is that we’ll sell off later in the day and retest a few levels.
Closing JETS.
Closing AAPL.
Closing QS/ NIO/ FCEL.
Adding back to PLTR.
Reopening XLE.
RYSPX closed @ the 730 am window up +2.17%. The plan is to close the other half of the position end of day if the index remains in this neighborhood. If instead it closes significantly lower, will add back half of the position size closed earlier.
Closing 50% of my position in RYSPX (Rydex SPX) at the 730 am window.
Closing my entire position in PLTR here.
Reports of the death of innovation stocks may have been greatly exaggerated, or at least premature. Nice 6%/ 7%/ 8% moves today in PLTR/ QS/ NIO/ FCEL. I have no idea whether the sector continues to rock or falls apart following a dead cat bounce. I’ll play the price levels based on what the market does.
Did big tech and mega caps and growth names wilt away today? Are the indices rallying without the help of big tech?
What am I missing?
Every 3-4% pullback has been aggressively bought into. If this was a number series, what happens after “n” such pull backs?
When was the last time anyone saw such a market?
https://www.yahoo.com/finance/news/this-closely-watched-stock-market-indicator-nears-a-sell-signal-183927948.html
Does anyone believe the above anymore? This is supposed smart money that failed to call the March 2020 bottom. Why should one believe them now?
Price prevails over all other technical signals. The way I read the tape today-> growth may have taken back the reins this week while cyclicals take a breather. That’s my base scenario. But it’s a tricky tape, and I prefer to take it one day at a time.
Closing all remaining positions either here or end of day. Not because I’m no longer a bull – but because I think today’s rally feels ‘extended’ and perhaps in need of a rest. It will be an overall one-day gain for the portfolio in the 2%+ range (~80% invested heading into today’s session with an overweight in the Nasdaq 100, driven by a conviction in Cam’s call last Friday + the deeply oversold readings last Friday). Hopefully the rest of you capitalized as well- TQQQ was a fantastic call, Cam!