Both the June CPI and PPI came in hot and well ahead of expectations. There was the inevitable debate about the transitory nature of the price increases. Looking longer-term, however, the conventional models for explaining inflation have been unsatisfactory.
Notwithstanding the numerous failures by Japanese policymakers, consider the US as another example. Let’s begin with fiscal policy. It is said that deficit spending would lead to currency devaluation and inflation in the manner of the Weimar Republic. Nothing could be further from the truth. The blue line represents federal government deficits as a percentage of GDP. Deficits began to balloon in the early 1980`s with the Reagan Revolution and continued during the Bush I era. Did inflation (purple line) explode upward?
Monetary policy had its own failure. Monetarist Theory, as popularized by Milton Friedman, was another model that backtested well but failed out of the box. Friedman postulated that the PQ=MV, where the Price X Quantity of goods and services (or GDP) = Money Supply X (Monetary) Velocity. Friedman theorized that, over the long run, monetary velocity is stable, and therefore money supply growth determines inflation. All central banks had to do was to control money growth in order to control inflation.
It worked until about 1980. Monetary velocity had been stable until about then. Money growth didn’t generate inflation because monetary velocity fluctuated wildly. Growth in money supply, as measured by M1, was often matched by declines in velocity. The Fed could engineer money growth and inject liquidity into the financial system without creating inflation.
In the face of the apparent failure of these conventional models, I offer an alternative vision of inflation and discuss the implications for investors.
“Hot” inflation prints
How transitory are the latest round of price increases? To be sure, inflation has been surprising to the upside everywhere.
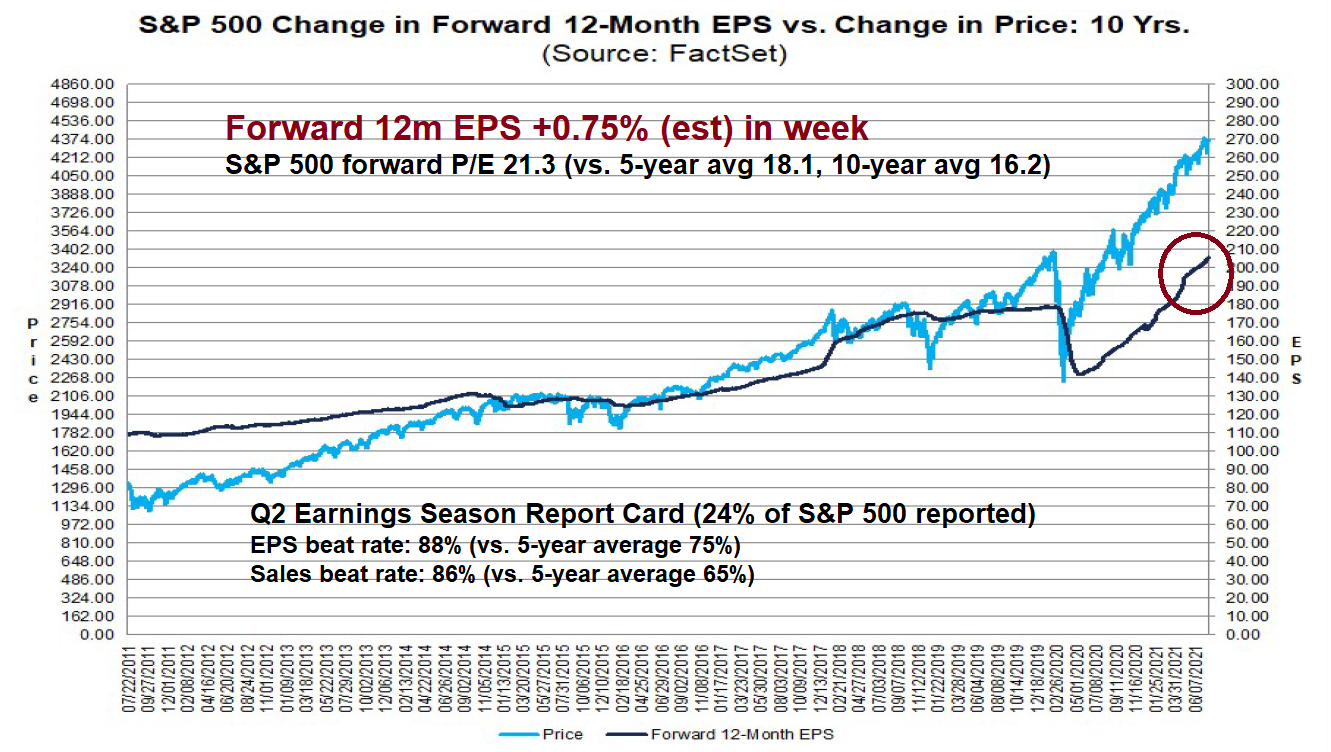
In the US, June CPI and PPI came in hot. Headline CPI printed at 5.4%, compared to consensus expectation of 4.9%; Core CPI was 4.5% (vs. 4.0% expected); PPI at 7.3% (6.8% expected); and Core PPI at 5.6% (vs. 5.1% expected). In the wake of the strong CPI report, the Council of Economic Advisers released an analysis showing that “a large part of the increase in Core CPI is due to cars and pandemic-affected services”, which is transitory.
The CEA is largely correct. An analysis of the double-digit increases in Core CPI came is attributable to temporary shortages or pandemic-related factors:
- Car rental 87.7%
- Used cars 45.2%
- Gasoline 45.1%
- Laundry machines 29.4%
- Airfare 24.6%
- Moving 17.3%
- Hotels 16.9%
Fortunately, Owners’ Equivalent Rent (OER) remains tame. As a reminder, OER has about a 25% weight in the CPI basket, but it has half that weight in PCE, the Fed’s preferred inflation gauge.
While the debate over the transitory nature of the current price spike will inevitably continue. None of it matters in the long-term for policymakers. What really matters to the sustainability of inflation is the level of wage increases.
The Reagan Revolution revisited
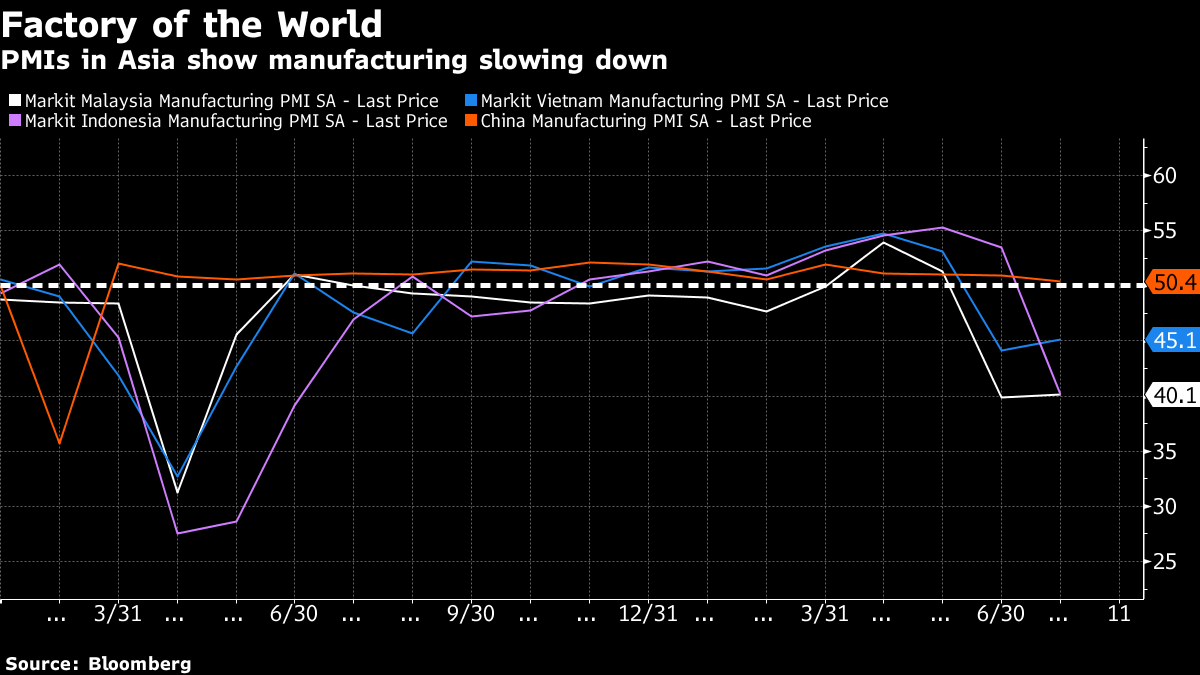
Remember the Reagan Revolution? When Ronald Reagan was elected in 1980, a regime change occurred in the returns to capital and labor. While productivity continued to rise, but real wages stagnated. The gains in productivity accrued to the suppliers of capital. In hindsight, the change is attributable to a series of microeconomic policy changes, such as deregulation, and most of all, free trade in the form of NAFTA and the transformation of China into the global factory for the world which forced down US wage rates.
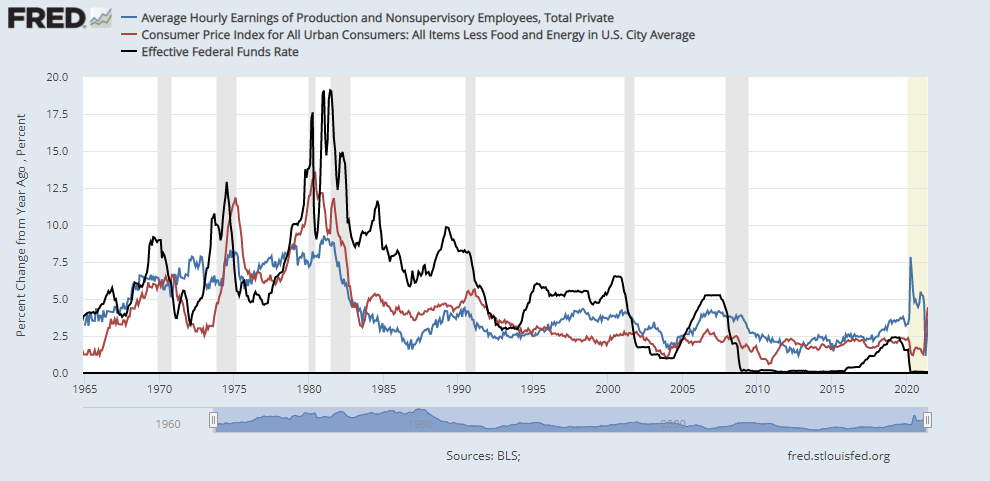
Monetary policy also played a key role in holding down inflation and wages. In the post-Reagan era, starting with Paul Volcker, the Fed sought to raise rates at the slightest hint of wage pressures. Between 1980 and the GFC, the Fed Funds rate (black line) stayed above annual increases in average hourly earnings (blue line). The Fed especially tightened when AHE rose above CPI (red line).
Inflation ran out of control in the 1970’s, and the Fed learned its lesson from that era. The way to stop the cycle ever-rising inflationary expectations is to break it through the wage link. If wage increases stay tame, inflation will stay under control.
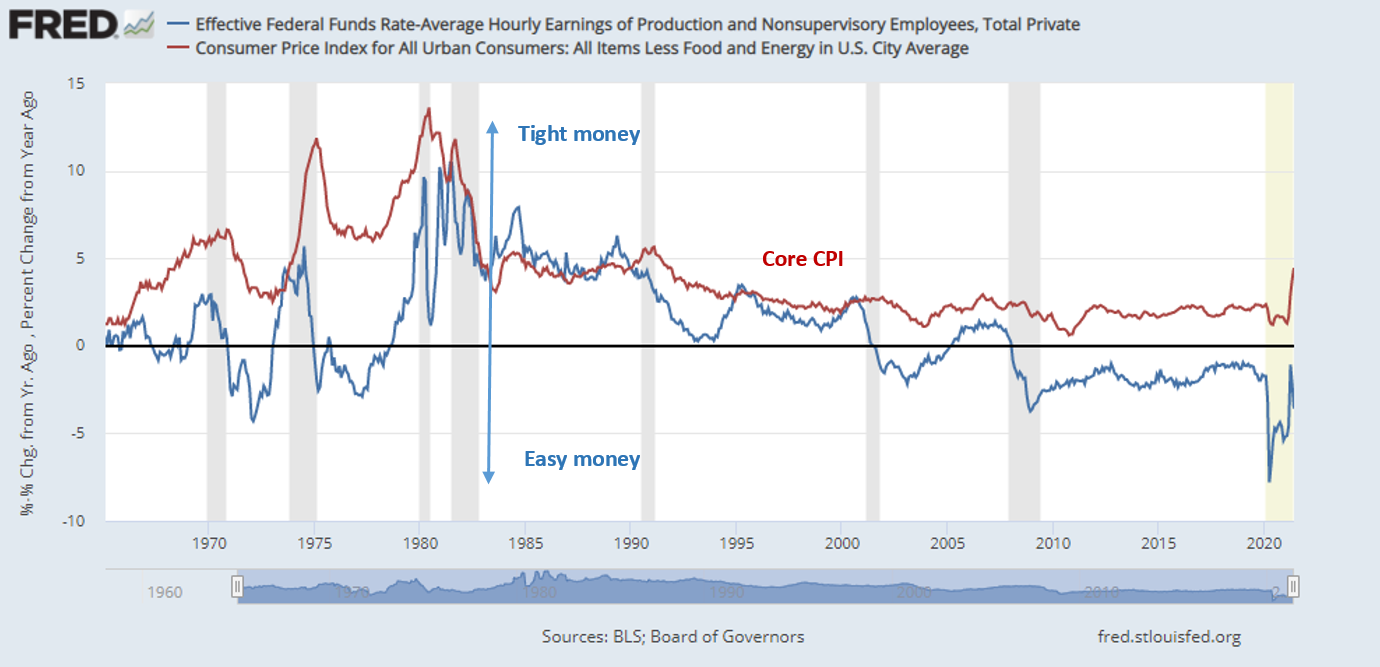
The following chart depicts the legacy of the Volcker Fed’s inflation-fighting policy. The blue line is the Fed Funds rate minus changes in Average Hourly Earnings. A positive number is a signal of tight monetary policy from a labor provider’s viewpoint, and a negative number is the opposite. Core CPI (red line) is provided as a reference point for inflation.
A Grand Experiment occurred in the wake of the GFC. Policymakers responded with a combination of very low-interest rates and quantitative easing. Inflation did not respond to conventional theory. It remained relatively tame and the US did not become the Weimar Republic, Zimbabwe, or Venezuela.
The Un-Volcker Fed
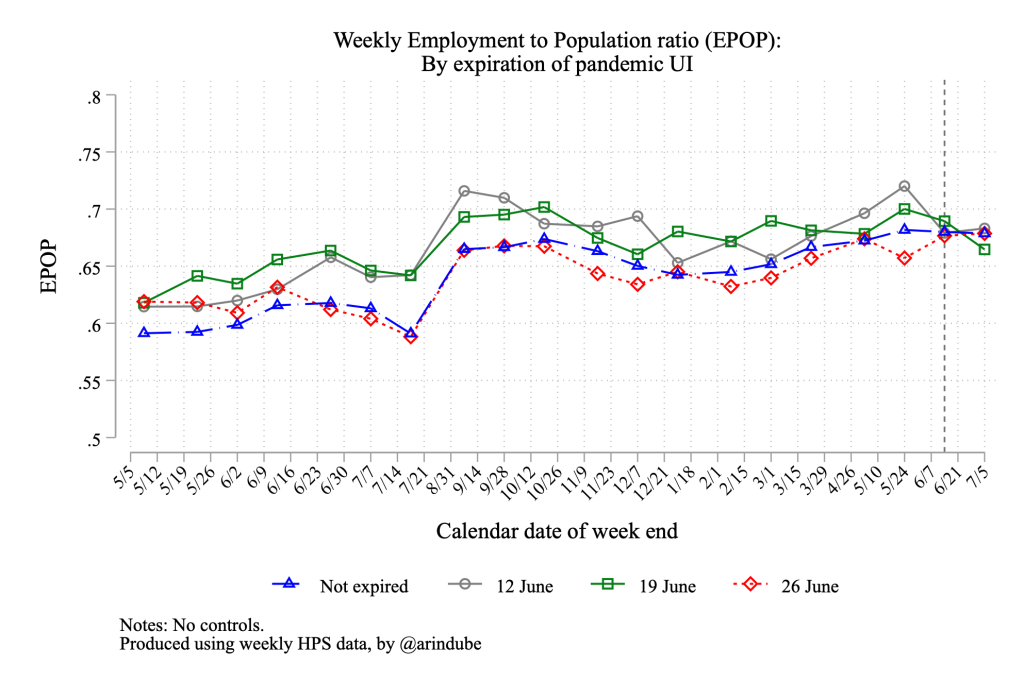
Most notably, the Powell Fed has continued the Yellen Fed’s focus on inequality. Its main tool is to run the economy hot so that labor shortages can put upward pressure on wage rates, which reduces inequality. While the Fed recognizes that this is a very crude tool and would prefer to see fiscal policy do the heavy lifting to reduce inequality, Powell’s testimony nevertheless emphasizes the Fed’s inequality focus.
Conditions in the labor market have continued to improve, but there is still a long way to go…However, the unemployment rate remained elevated in June at 5.9 percent, and this figure understates the shortfall in employment, particularly as participation in the labor market has not moved up from the low rates that have prevailed for most of the past year…
Pandemic-induced declines in employment last year were largest for workers with lower wages and for African Americans and Hispanics. Despite substantial improvements for all racial and ethnic groups, the hardest-hit groups still have the most ground left to regain.
Powell also gave a nod to the “Fed Listens” initiative, which is a way of reaching out to the community from a bottom-up basis.
We understand that our actions affect communities, families, and businesses across the country. Everything we do is in service to our public mission. The resumption of our Fed Listens initiative will further strengthen our ongoing efforts to learn from a broad range of groups about how they are recovering from the economic hardships brought on by the pandemic. We at the Federal Reserve will do everything we can to support the recovery and foster progress toward our statutory goals of maximum employment and stable prices.
Can you imagine such remarks from Volcker or Greenspan? The Powell Fed has explicitly downgraded the wage pressure-inflation link in its approach to monetary policy.
The pendulum swings back
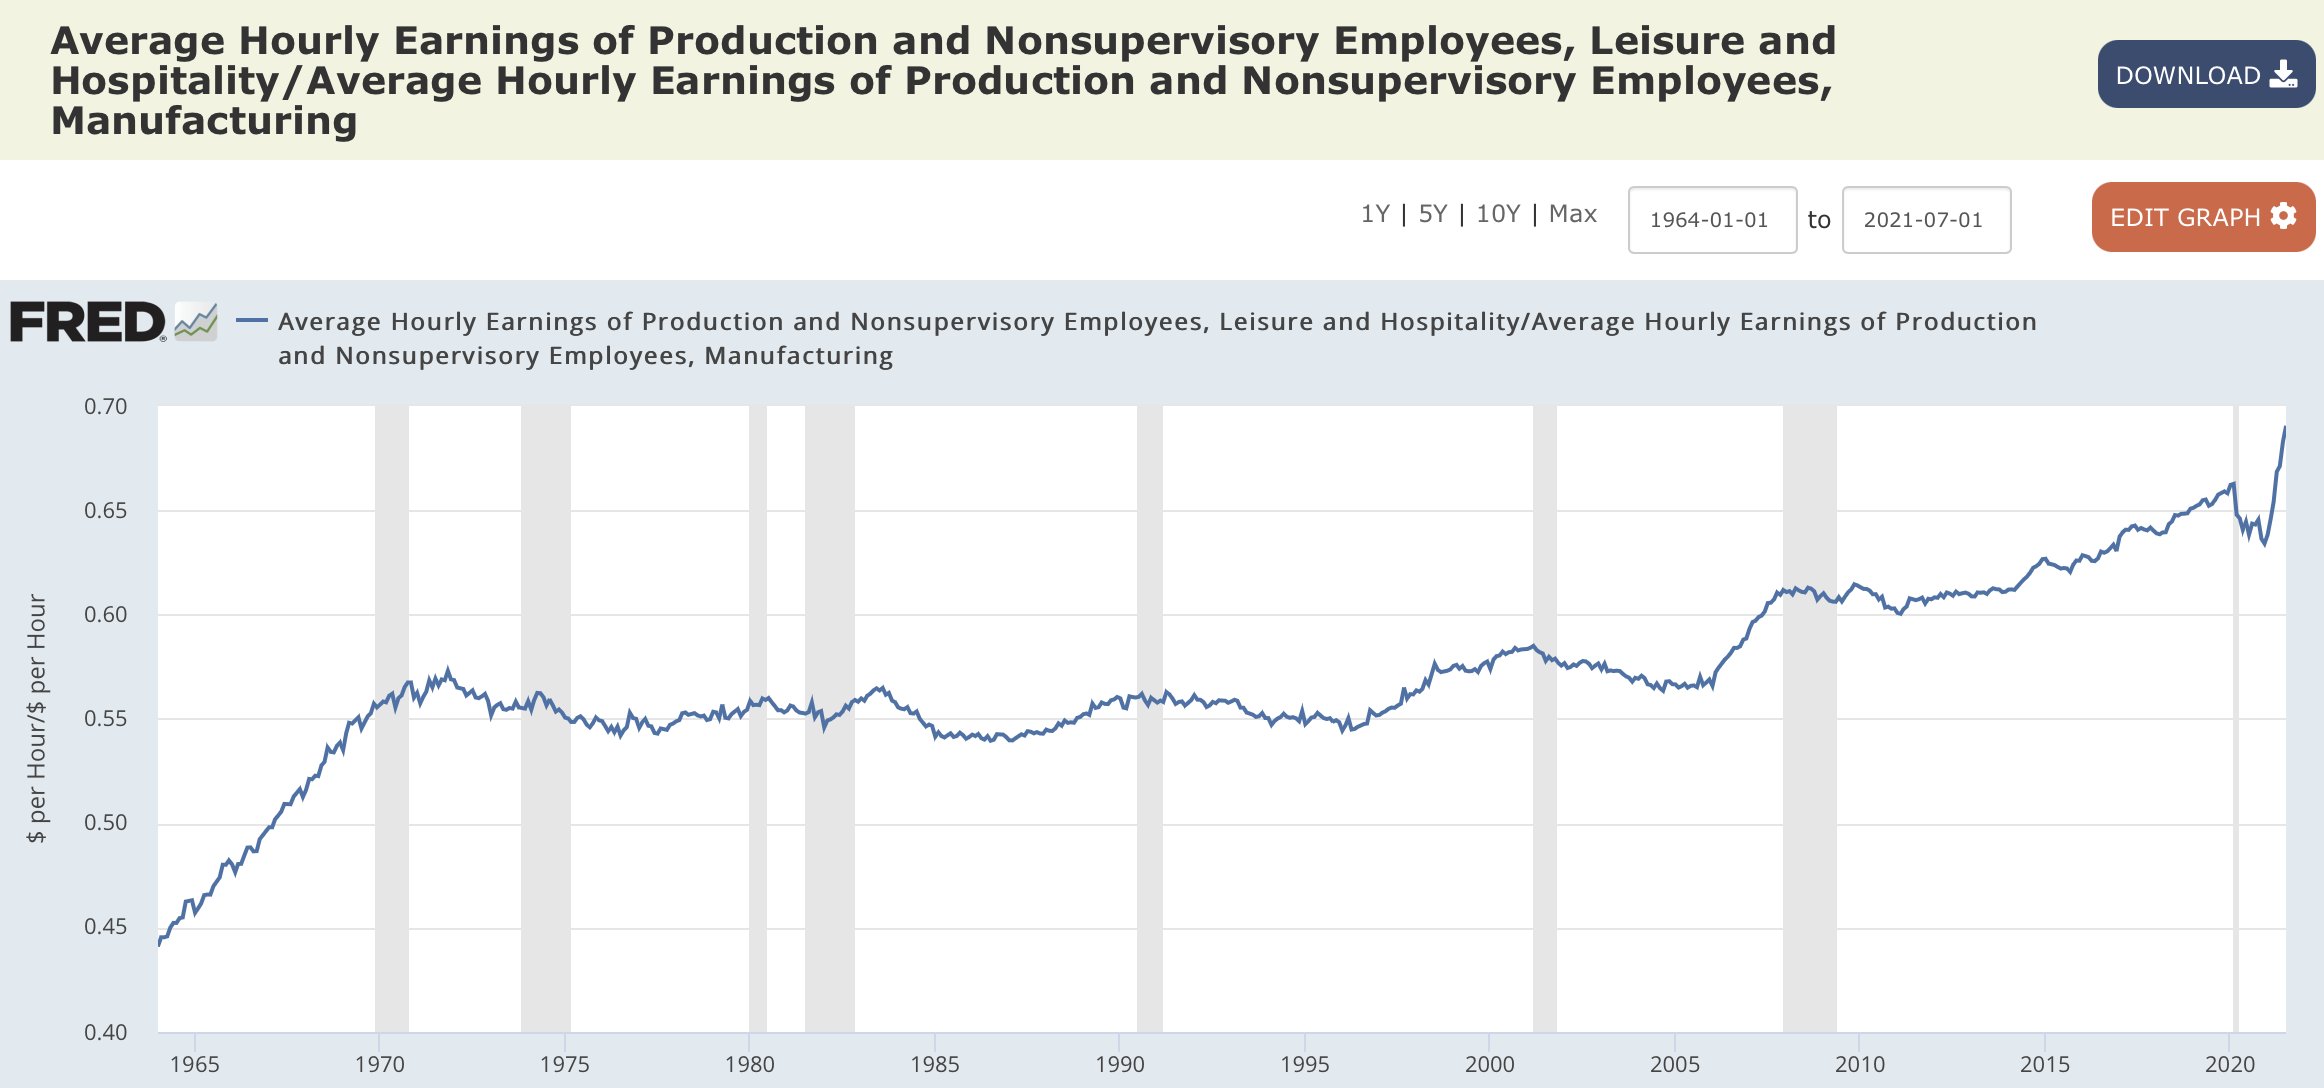
Having established that wages constitute an important component to the inflation equation, I believe the odds of rising wages which puts upward pressure on inflation is high. That’s because the pendulum of returns to the capital versus labor is about to swing back.
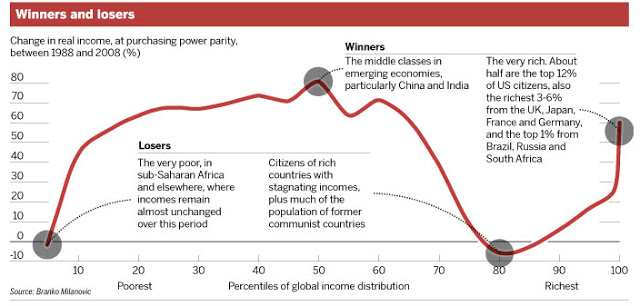
One key reason for falling wages in the developed world is labor arbitrage. The now-famous Milanovic “elephant” graph of global winners and losers tells the story. As the world globalized its supply chains between 1988 and 2008, the winners were the middle class of emerging market economies (and China in particular) and the very rich because they engineered and profited from the globalization trend. The main losers were the middle class in developed economies who saw their jobs offshored and bargaining power diminish.
The pendulum is swinging back. It began under the Trump Administration, whose tariff and Buy America policies arrested the offshoring trend. In addition, China was facing its own age demographic challenges and its supply of labor was diminishing. Biden has continued Trump’s Buy America initiatives. In addition, he has proposed an ambitious infrastructure spending program and government spending designed to address inequality. This policy mix should raise wages. Rising wages, especially in poor households, should buoy economic growth and government finances as payroll taxes rise and act to stabilize government debt ratios.
In the short run, there have been numerous accounts of labor shortages putting upward pressure on employee compensation. That’s not unusual. A group of academics published a
paper that studied the effects of pandemics on capital and labor markets after wars and pandemics found that wage pressures rise after pandemics, largely owing to a decrease in the labor supply.
Fast forward to 2021. The pandemic has decreased the labor supply from a combination of early retirement, the inability of women to work because of a lack of childcare, and dissatisfaction with working conditions. Lowly paid workers in hospitality and retail experienced increased customer abuse during the pandemic, and some white-collar workers who worked from home found frustration with their commuting time as they returned to their offices.
A recent incident at a Lincoln, Nebraska Burger King where the staff quit en mass recently went viral. Employees complained about working without breaks and in kitchens that were up to 90F.

“In the busy summer season, many firms haven’t been able to hire enough workers to efficiently run their businesses, which has restricted sales and output,” said NFIB Chief Economist Bill Dunkelberg. “In June, we saw a record high percent of owners raising compensation to help attract needed employees and job creation plans also remain at record highs. Owners are doing everything they can to get back to a full, productive staff.”
A net 39% (seasonally adjusted) of owners reported raising compensation (up five points), a record high. A net 26% plan to raise compensation in the next three months (up four points).
Up two points from May’s report, 63% of owners reported hiring or trying to hire in June. A seasonally adjusted net 28% of owners plan to create new jobs in the next three months.
Finding qualified workers remains a problem for small businesses as 89% of those hiring or trying to hire reported few or no “qualified” applicants for their open positions in June.
Wage gains are particularly acute in transportation, logistics, and hospitality industries. Moreover, recent wage increases by large employers like Amazon, Walmart, and McDonald’s are putting upward pressure on compensation for unskilled workers.
Wages are rising. A whole host of circumstances such as a pandemic-induced labor shortage and government policies are putting upward pressure on wages and, by implication, inflation.
Investment implications
Putting it all together, the historic imbalance between capital and labor has become extremely stretched and the pendulum is swinging back. For investors, this presents a number of challenges as the returns to capital compress and inflation rise.

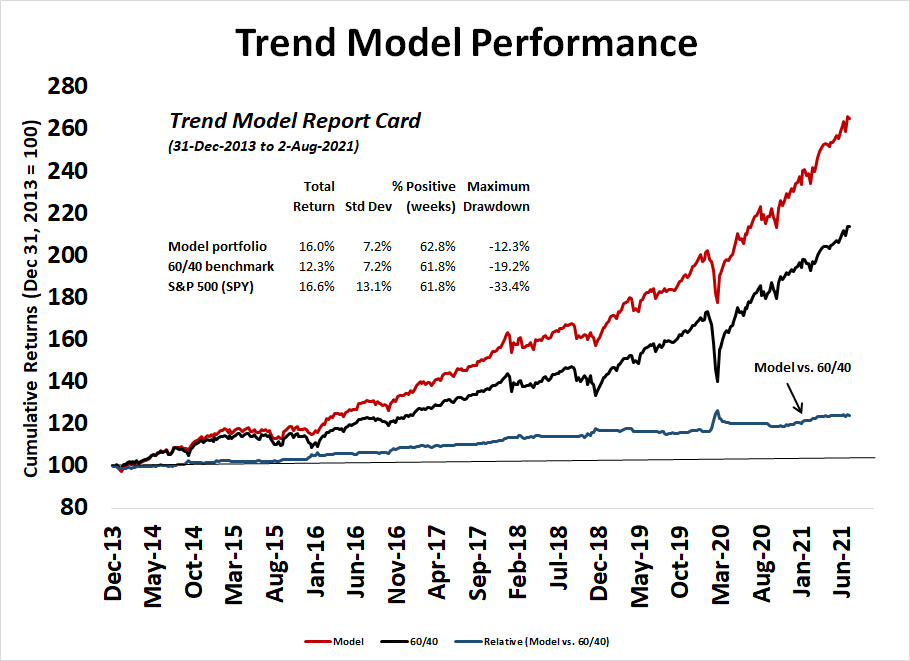
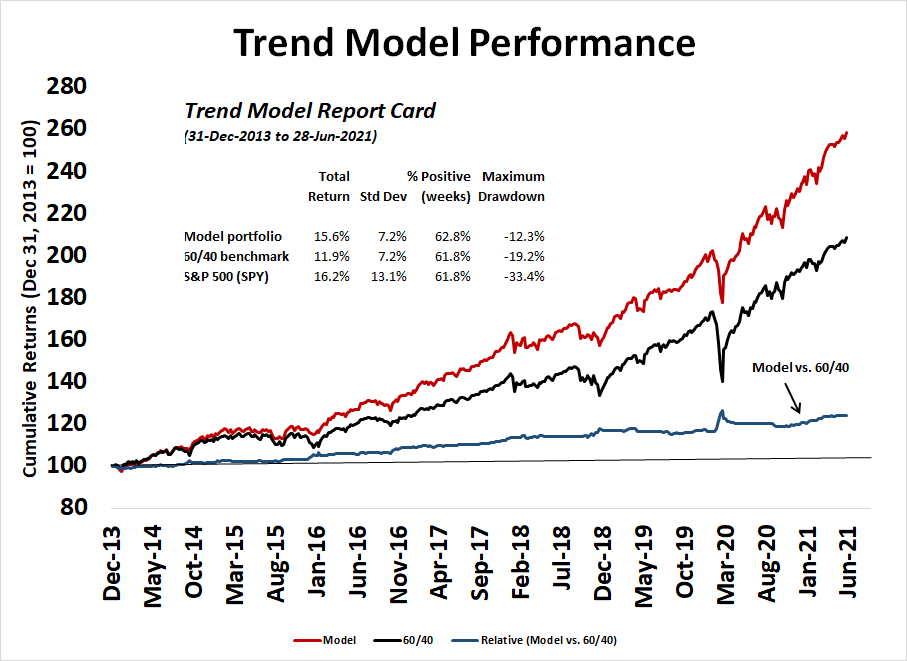
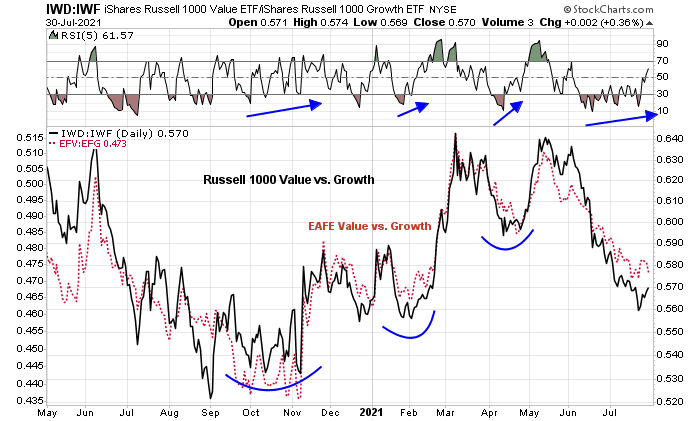
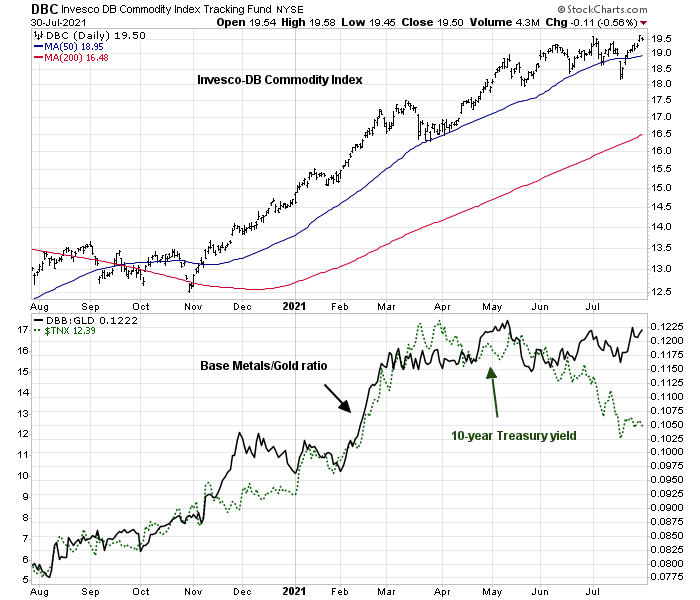
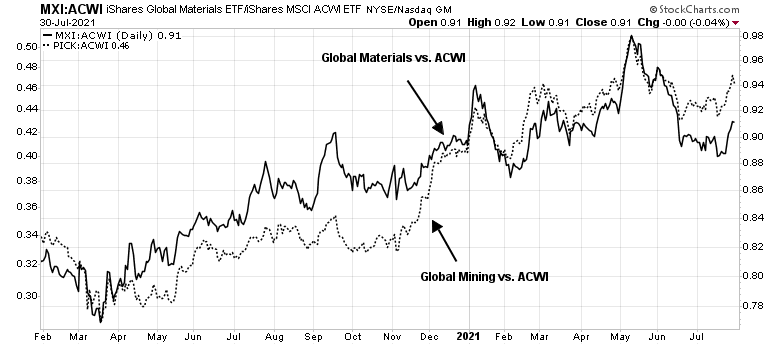
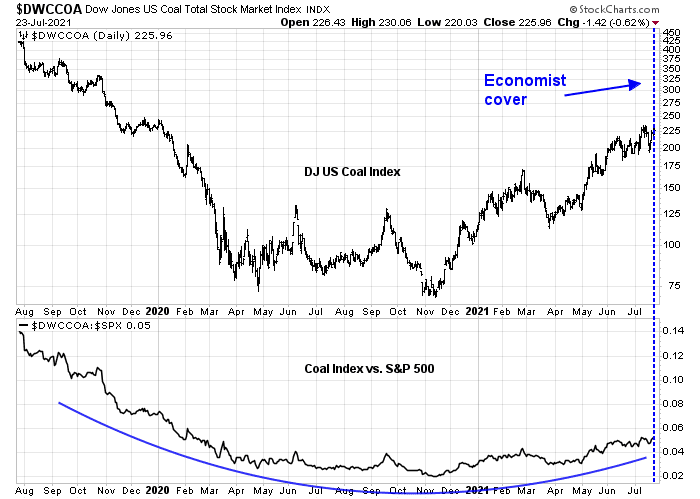
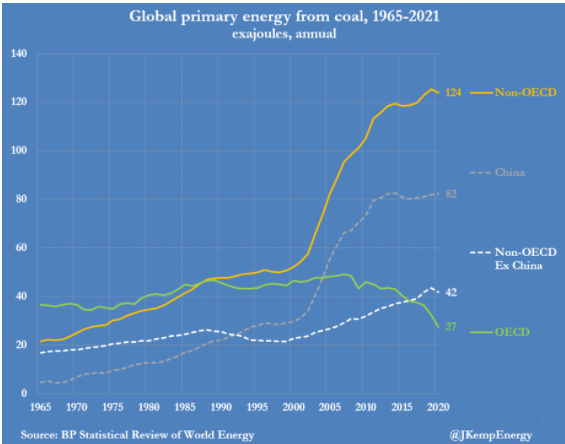
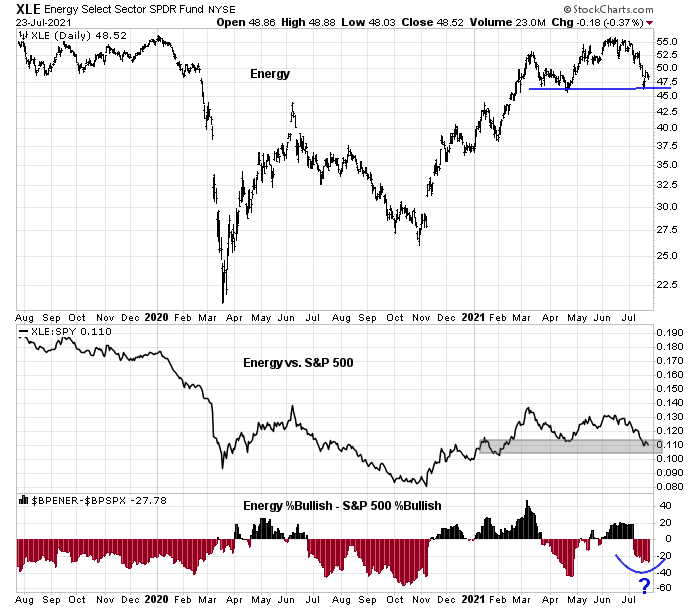
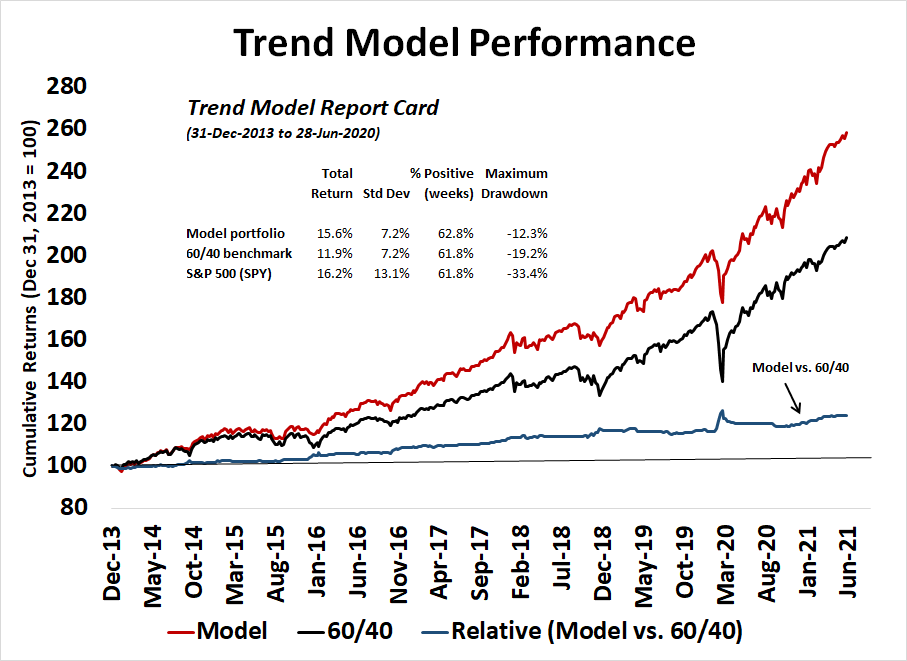
The conventional hedge against inflation is to buy shares of companies that can pass through price increases. This include companies with strong branding or able to extract monopolistic profits, commodities, and resource extraction companies in mining and energy. An unconventional and overlooked investment strategy is trend following, as outlined in a recent
paper, “The Best Strategies for Inflationary Times”.
Over the past three decades, a sustained surge in inflation has been absent in developed markets. As a result, investors face the challenge of having limited experience and no recent data to guide the repositioning of their portfolios in the face of heighted inflation risk. We provide some insight by analyzing both passive and active strategies across a variety of asset classes for the U.S., U.K., and Japan over the past 95 years. Unexpected inflation is bad news for traditional assets, such as bonds and equities, with local inflation having the greatest effect. Commodities have positive returns during inflation surges but there is considerable variation within the commodity complex. Among the dynamic strategies, we find that trend-following provides the most reliable protection during important inflation shocks. Active equity factor strategies also provide some degree of hedging ability. We also provide analysis of alternative asset classes such as fine art and discuss the economic rationale for including cryptocurrencies as part of a strategy to protect against inflation.