Preface: Explaining our market timing models
We maintain several market timing models, each with differing time horizons. The “Ultimate Market Timing Model” is a long-term market timing model based on the research outlined in our post, Building the ultimate market timing model. This model tends to generate only a handful of signals each decade.
The Trend Asset Allocation Model is an asset allocation model that applies trend following principles based on the inputs of global stock and commodity price. This model has a shorter time horizon and tends to turn over about 4-6 times a year. In essence, it seeks to answer the question, “Is the trend in the global economy expansion (bullish) or contraction (bearish)?”
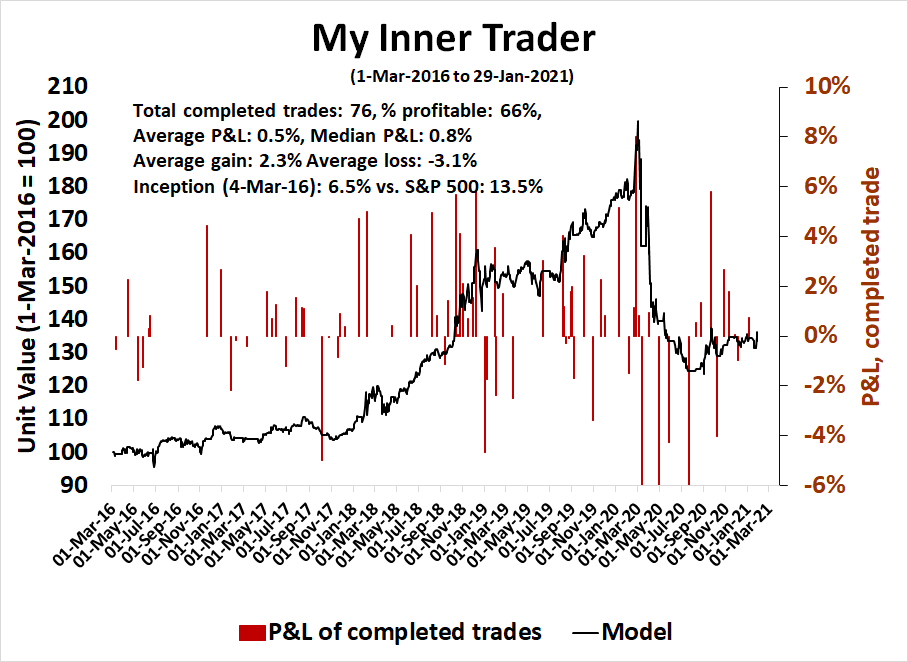
My inner trader uses a trading model, which is a blend of price momentum (is the Trend Model becoming more bullish, or bearish?) and overbought/oversold extremes (don’t buy if the trend is overbought, and vice versa). Subscribers receive real-time alerts of model changes, and a hypothetical trading record of the email alerts are updated weekly
here. The hypothetical trading record of the trading model of the real-time alerts that began in March 2016 is shown below.
The latest signals of each model are as follows:
- Ultimate market timing model: Buy equities
- Trend Model signal: Bullish
- Trading model: Bearish
Update schedule: I generally update model readings on my site on weekends and tweet mid-week observations at @humblestudent. Subscribers receive real-time alerts of trading model changes, and a hypothetical trading record of those email alerts is shown here.
Subscribers can access the latest signal in real-time here.
Here comes the pullback
I have been increasingly cautious about the tactical market outlook for the past few weeks (see
Take some chips off the table). Last week’s sudden air pocket certainly gave the bulls a fright. Is this the start of a correction, and how can investors and traders spot the bottom?
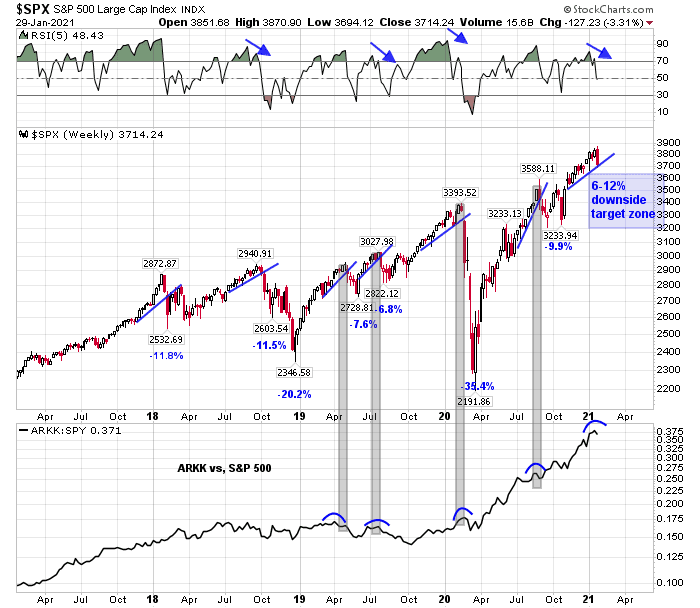
The daily S&P 500 chart shows that the S&P 500 has definitively violated its rising channel and it is now testing support at the 50-day moving average (dma). The VIX Index spiked above its upper Bollinger Band which signals an oversold condition. The VIX appears to be going on an upper BB ride indicating a more prolonged downdraft.
Looking longer-term, the weekly S&P 500 chart shows that the S&P 500 is just testing its rising trend line. There are nevertheless warnings from the negative 5-week RSI divergence and a rollover in relative strength in the popular ARK Innovation ETF (ARKK).
Should the market weaken in line with the historical experience of the last four years, it would translate into a pullback of 6-12% or 3200-3640 on the S&P 500.
Correction ahead
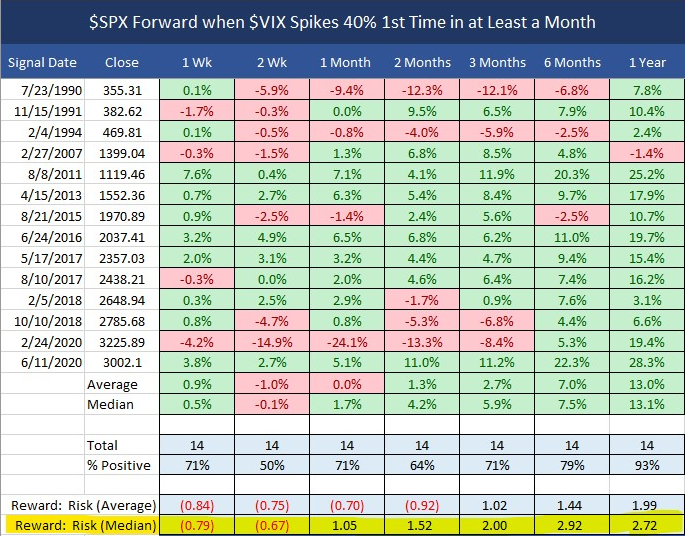
Last week’s downdraft may be a sign that the long-awaited correction may have begun. The VIX Index spiked over 40% last Wednesday, which is a relatively rare occurrence. If history is any guide the risk/reward of such episodes is not favorable. The market tends to recover in the first week but slides looking out 2-4 weeks.
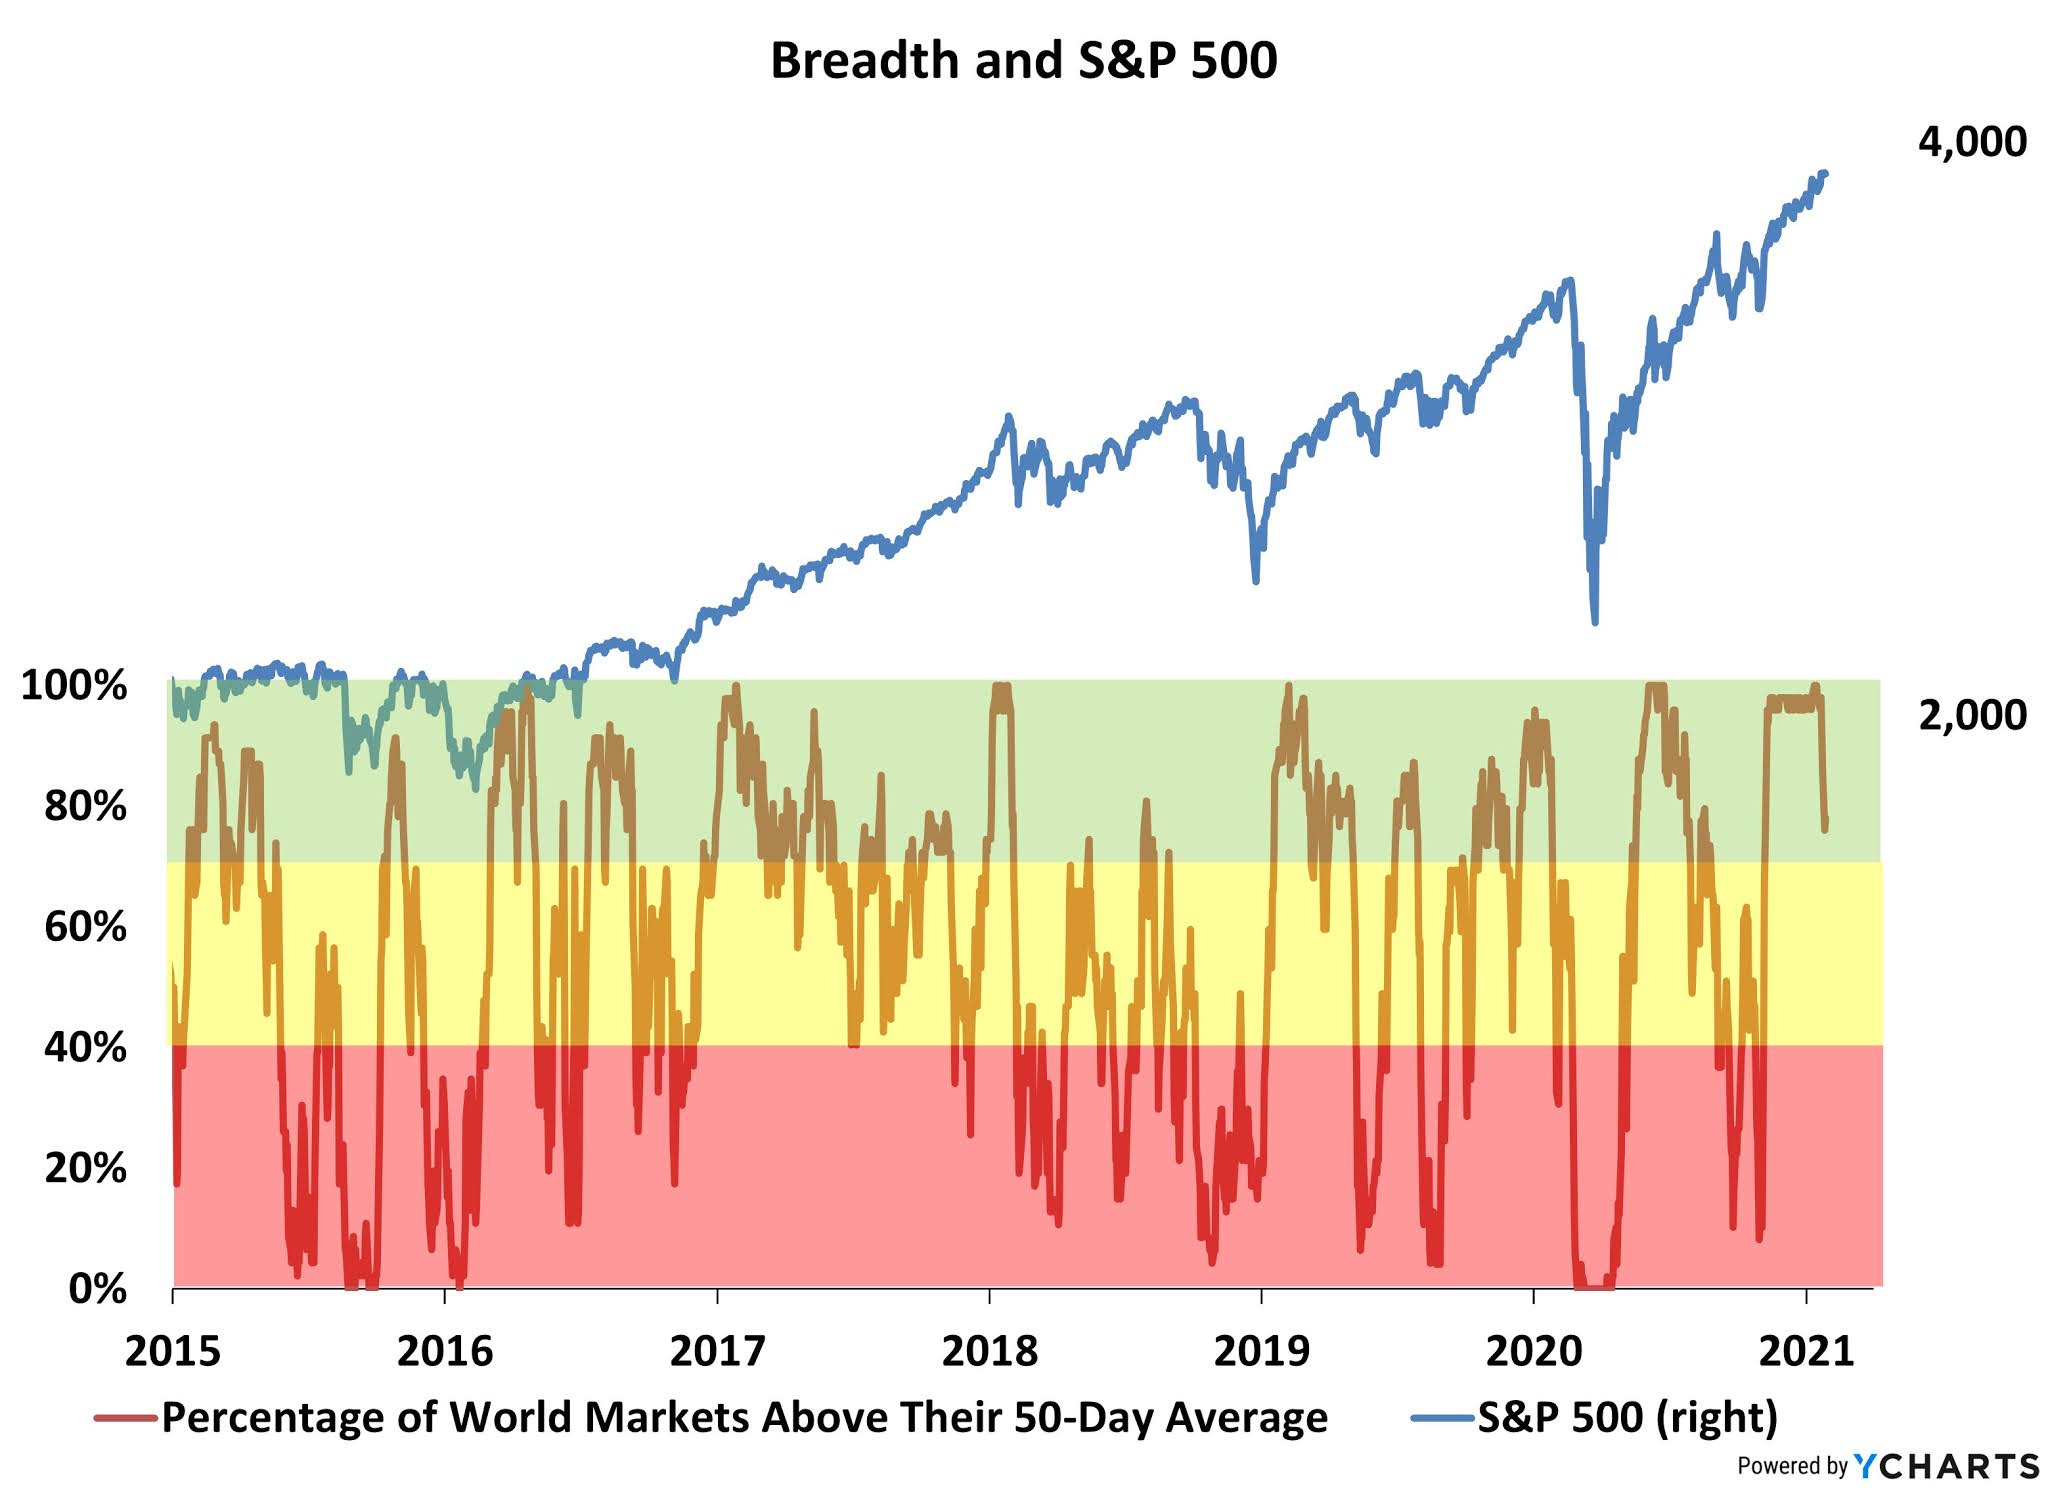
As well, global breadth and momentum are losing some steam. The percentage of world markets above their 50-day moving averages (dma) peaked and fell to 78%. While this reading is not below the 70% tactical sell signal just yet, it is a warning signal of waning momentum.
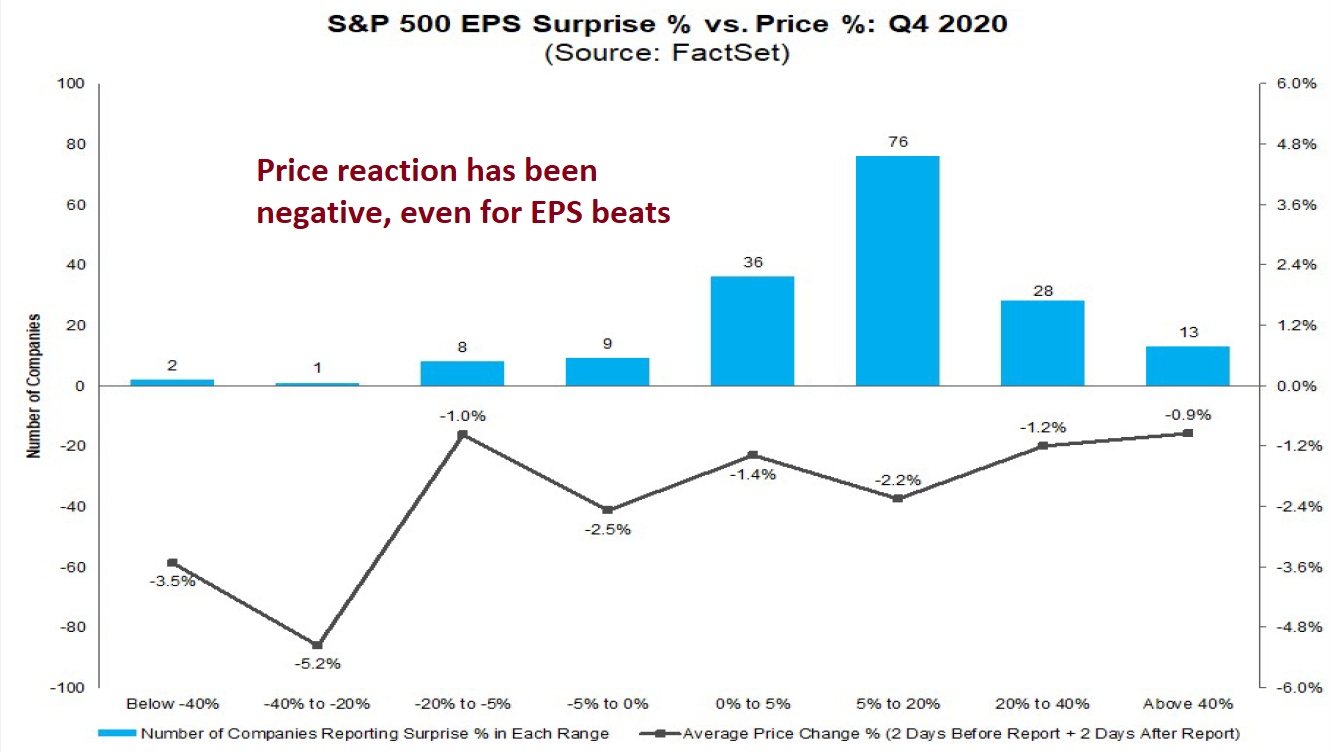
Another area of concern is the market response to Q4 earnings season. The market is not rewarding earnings beats. The inability of a market to respond to positive news is another red flag.
Signposts of a bottom
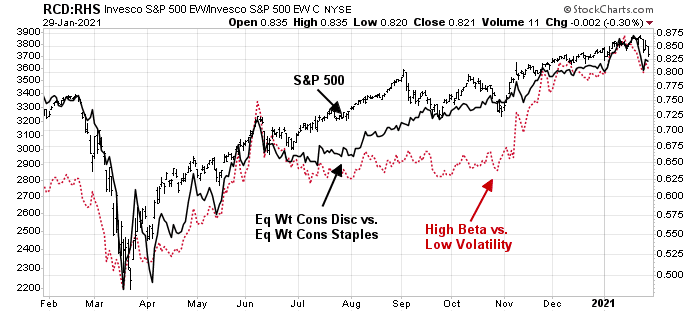
With that preface, these are some of the signposts of a corrective bottom. First, watch for positive or negative divergences in risk appetite. Equity risk appetite can be measured by the ratio of high beta to low volatility stocks, and the equal-weighted consumer discretionary to consumer staple stocks. Right now, they are exhibiting minor negative divergences.
Credit market risk appetite, which can be measured by the relative price performance of high yield (junk) bonds to their duration-equivalent Treasuries and leveraged loans to USTs, are also showing minor negative divergences.
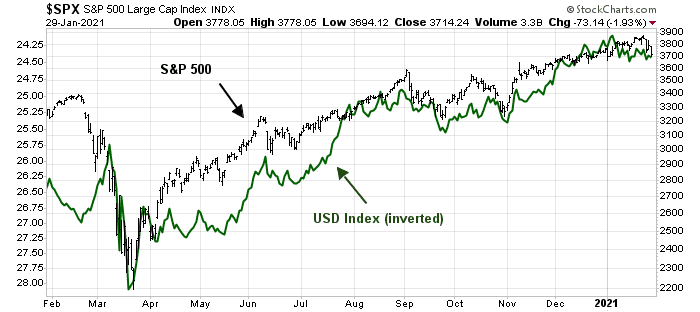
Foreign exchange (FX) market risk appetite can be measured by the inverse of the USD Index, which is also slightly underperforming the S&P 500.
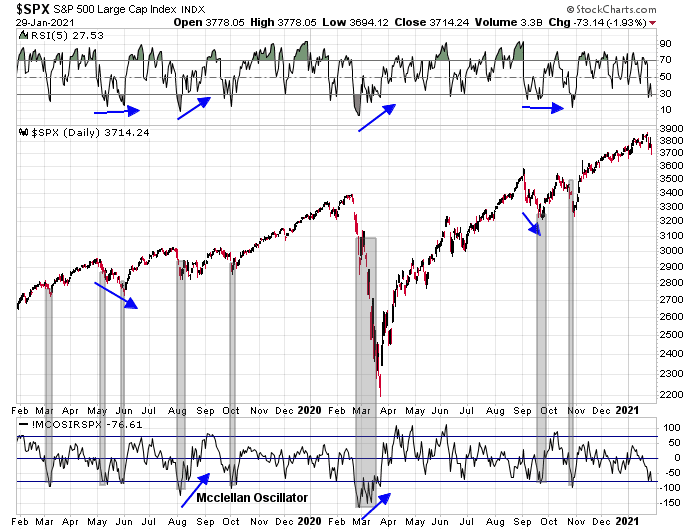
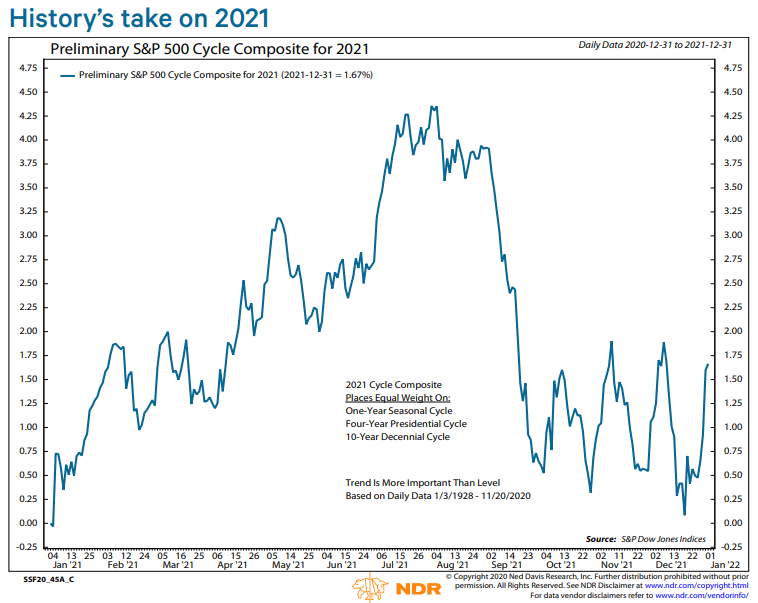
Last week’s initial downdraft took the market to a sufficiently oversold condition on the S&P 500 McClellan Oscillator to signal the start of a correction. However, the weekly chart shown at the top of this publication indicates that the magnitude of past pullbacks has mostly been in the 7-12% range. Last week’s peak-to-trough drawdown was about -4%. If history is any guide, there is more downside risk over the next few weeks.
The most likely pattern is a period of choppiness as the market tries to find a bottom. While V-shaped bottoms are always possible, W-shaped bottoms tend to be the norm. In such instances, look for positive divergences after a re-test of the initial low, such as a flat reading or higher low on RSI or the McClellan Oscillator.
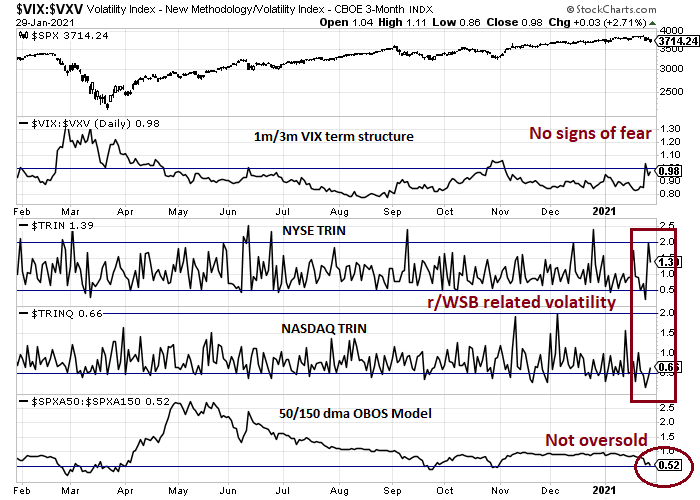
Should the market be engulfed by a selling panic, my Trifecta Bottom Spotting Model should flash a buy signal. The three components of this model are:
- The term structure of the VIX Index: An inverted term structure is a signal of option market fear.
- NYSE TRIN: A spike above 2 is an indication of a price-insensitive forced liquidation, or a “margin clerk” market.
- Intermediate-term overbought-oversold indicator: A reading below 0.5 is a signal of an oversold market.
If all three models flash buy signals within a 2-3 days of each other, I call that a Trifecta buy signal. Sometimes just an exacta (two model) signal is good enough for a bottom.
The market flashed an exacta buy signal last Thursday when the VIX term structure inverted and TRIN rose above 2. In all likelihood, that signal should be discounted because of the brief nature of the term structure inversion, and a mean reversion of TRIN. TRIN showed the unusual condition of skidding below 0.5 last Wednesday when the S&P 500 fell -2.6%, indicating a buying stampede. The “buying stampede” and subsequent volatility of TRIN are attributable to the WallStreetBets crowd forcing short-covering of highly shorted stocks like GameStop. This interpretation is confirmed by the buying stampede readings of NASDAQ TRIN and the lack of a NASDAQ TRIN spike during the same period.
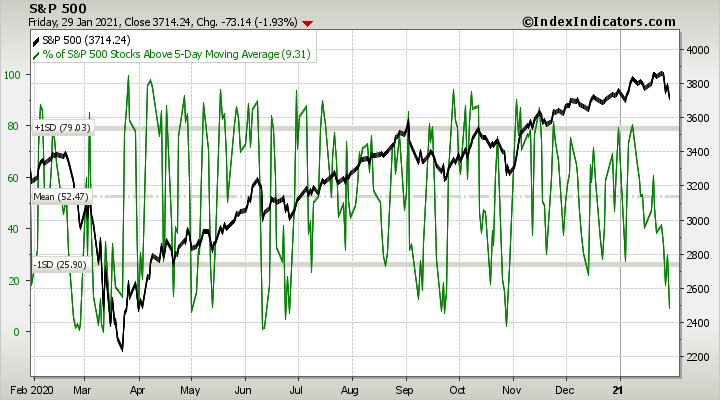
Lastly, timing the following tools from
Index Indicators can be useful in timing exact bottoms. Watch for oversold conditions on the percentage of S&P 500 stocks above their 5 dma.
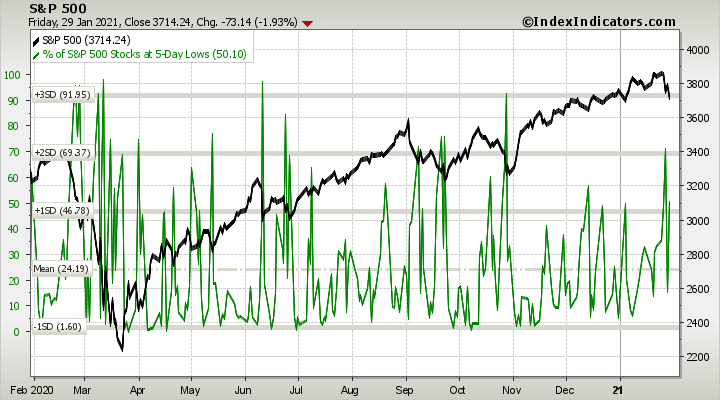
Also, keep an eye on the percentage of S&P 500 stocks at their 5-day lows.
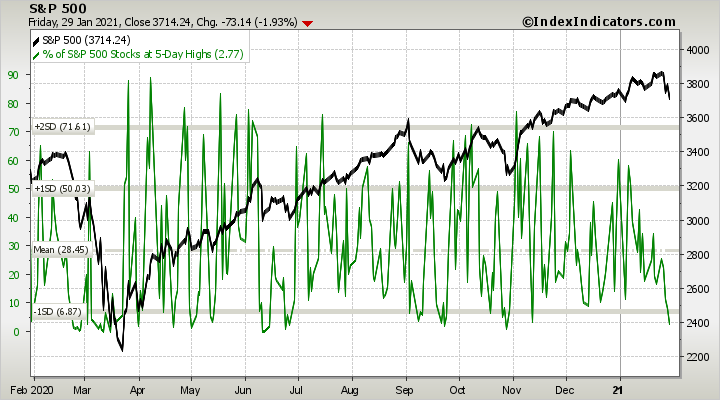
W-shaped bottoms will be choppy. The percentage of S&P 500 stocks at their 5-day highs can also be helpful for timing short-term entries and exits for traders who want to reload their short positions. From a tactical perspective, the market is setting up for a bounce early in the week, but too much technical damage has been done and the pullback isn’t over. Any strength would be a good opportunity for traders to short the market in accordance with their risk appetite and preferences.
In conclusion, the market is likely just starting a pullback in the 6-12% range. My base case scenario calls for some choppiness over the next few weeks, which is consistent with NDR’s seasonal analysis.
To summarize, spotting a corrective bottom involves keeping an eye on the following:
- Positive and negative divergence in risk appetite indicators;
- Positive and negative divergences in breadth and momentum indicators like the McClellan Oscillator and RSI;
- The Trifecta Bottom Spotting Model; and
- Short-term breadth indicators to time the approximate date of the bottom.
My inner investor is bullishly positioned, but he has selectively sold call options against existing long positions in order to mitigate short-term downside risk. My inner trader is short the S&P 500.
Disclosure: Long SPXU


Cam-
‘As well, global breadth and momentum are losing some steam. The percentage of world markets above their 50-day moving averages (dma) peaked and fell to 78%. While this reading is not above the 70% tactical sell signal just yet, it is a warning signal of waning momentum.’
I’m guessing you meant ‘While this reading is not *below* the 70% tactical sell signal just yet?’
You are correct. Sorry for the confusion.
I’m seeing the similar warnings. Watching for a tradable bottom on Monday.
I would agree that a -5% to -10% is likely within the next few weeks.
Hoping to see an oversold bounce on Monday/Tuesday, but I wouldn’t (and haven’t) bet the farm on it. If we open in the hole on Monday, I might move position size up as far as 50%. On the other hand, if we gap down hard I may opt to just get out of the way.
The biggest challenge right now is finding a substitute for bonds/bond funds. IMO, yields can spike (and spike quickly) at any time. The best I’m able to come up with is cash.
Having a hard time staying on top of the virus ‘variants,’ which I suspect will become an ‘issue’ in the coming months.
(a) Two of the variants exhibit an unusually large number of mutations. Not a big deal in and of itself, but both of these variants were associated with an increase in the number of cases in their countries of origin – B.1.1.1.7 in the UK and 501Y.V2 in South Africa – both about 50% more transmissible than SARS-Cov-2.
(b) Most of the variants exhibit significant alterations in the spike protein which represents the main target for most vaccines. Will that pose a significant threat to the global economy?
(c) The variants are also associated with a higher degree of mortality – perhaps 30% higher. Will that become a significant issue?
(d) The CDC recently warned that the UK variant will be the dominant strain in the U.S. by March and could drive a spring surge in cases.
(e) A third variant, 20J/501Y.V3, has been identified in Brazil. What’s troubling is that an estimated 75% of the population had been infected with SARS-CoV-2 as of October, but by mid-December, the area was hit again with a substantial surge in cases. Probably the biggest issue of all.
Booster vaccines will probably be needed to keep up with the mutations.
As Ravindra pointed out earlier, science will win in the end. But it’s too soon to declare victory, and another surge could push back the global recovery by an unpredictable length of time.
Under the surface tons of stocks of good companies already are corrected or in individual bear markets (>20% down). So I guess if the indices correct more, then the mega-caps should take most of the blow. Again it pays to examine how each individual stock behaves during correction. Correction is like a screening process. It weeds out losers and also-rans.
Great interview with Tom Lee on Fast Money last week, who thinks multiples on the SPX could hit the thirties, and feels that the equity market will become the new bond market for investors interested in income/yield.
Thus perhaps Tom Lee has already answered my earlier question. Equities are the new bond substitute!
https://www.youtube.com/watch?v=JZAPK_hvvhs
https://twitter.com/i/status/1354197825844817924
The above is the video I originally tried to link – although the first link is worth a listen as well.
Spot silver +6%. It’s one thing to manipulate the price of a single stock – trying to jack up the price of a major commodity isn’t the same thing. There are of course many traders taking advantage of the opening bid.
From +1.89 to +1.06.
I think commercial speculators shorted the open, and with the added assistance of newly-trapped ‘bulls’ will now succeed into driving prices into the red.
They’re doing a good job. Closing shorts ~ +0.97 and letting prices rise a bit to attract FOMO buyers.
A very detailed analysis and observations about the variants. I take comfort that our scientists are on top of it. We must do our part. For ourselves, our families and our communities.
https://twitter.com/k_g_andersen/status/1355689990487896065?s=21
Meanwhile, DJIA futures have recovered half of early session losses. It wouldn’t surprise me to once again see a green open, although it’s my opinion that it turns green well before then.
ES low was 3656 (thus far) – that makes it a -5.5% pullback from YTD highs. Is that close enough to -6%?
(a) Miscalculated the silver trade by a long shot! However, I have no skin in that game.
(b) US indexes indicated ~ +1% higher. The plan? Trim on intraday strength, add/open on intraday pullbacks.
Not entirely sure why, but with 5 minutes ’til the open of the regular session, I’m now leaning bearish.
All positions that I’m able to close have been closed.
PLTR/ NIO/ FCEL/ QS on mid-morning pullbacks.
Out of all positions.
The bearish action this morning is a decent tell. The so-called unrelenting bid under stocks may be coming to an end.
Moving on to Plan C. No longer interested in reopening or adding.
I’ve set up orders to close VTIAX/ VTSAX/ VEMAX end of day.
Nice recovery in most indexes off the morning lows.
Not enough to change my plans.
Since Mr. Hui is still on a short signal, I’ll increase my short position if the S&P finishes above the 3780 mark.
That’s not a bad level to initiate or reload shorts.