Preface: Explaining our market timing models
We maintain several market timing models, each with differing time horizons. The “Ultimate Market Timing Model” is a long-term market timing model based on the research outlined in our post, Building the ultimate market timing model. This model tends to generate only a handful of signals each decade.
The Trend Asset Allocation Model is an asset allocation model that applies trend following principles based on the inputs of global stock and commodity price. This model has a shorter time horizon and tends to turn over about 4-6 times a year. In essence, it seeks to answer the question, “Is the trend in the global economy expansion (bullish) or contraction (bearish)?”
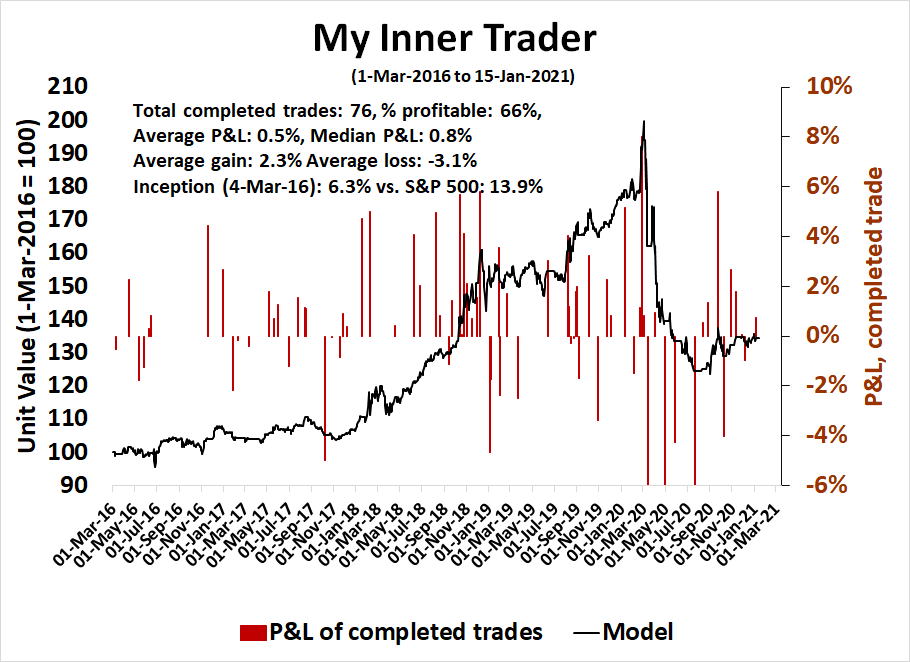
My inner trader uses a trading model, which is a blend of price momentum (is the Trend Model becoming more bullish, or bearish?) and overbought/oversold extremes (don’t buy if the trend is overbought, and vice versa). Subscribers receive real-time alerts of model changes, and a hypothetical trading record of the email alerts are updated weekly
here. The hypothetical trading record of the trading model of the real-time alerts that began in March 2016 is shown below.
The latest signals of each model are as follows:
- Ultimate market timing model: Buy equities
- Trend Model signal: Bullish
- Trading model: Bearish
Update schedule: I generally update model readings on my site on weekends and tweet mid-week observations at @humblestudent. Subscribers receive real-time alerts of trading model changes, and a hypothetical trading record of those email alerts is shown here.
Subscribers can access the latest signal in real-time here.
Not what you see at market bottoms
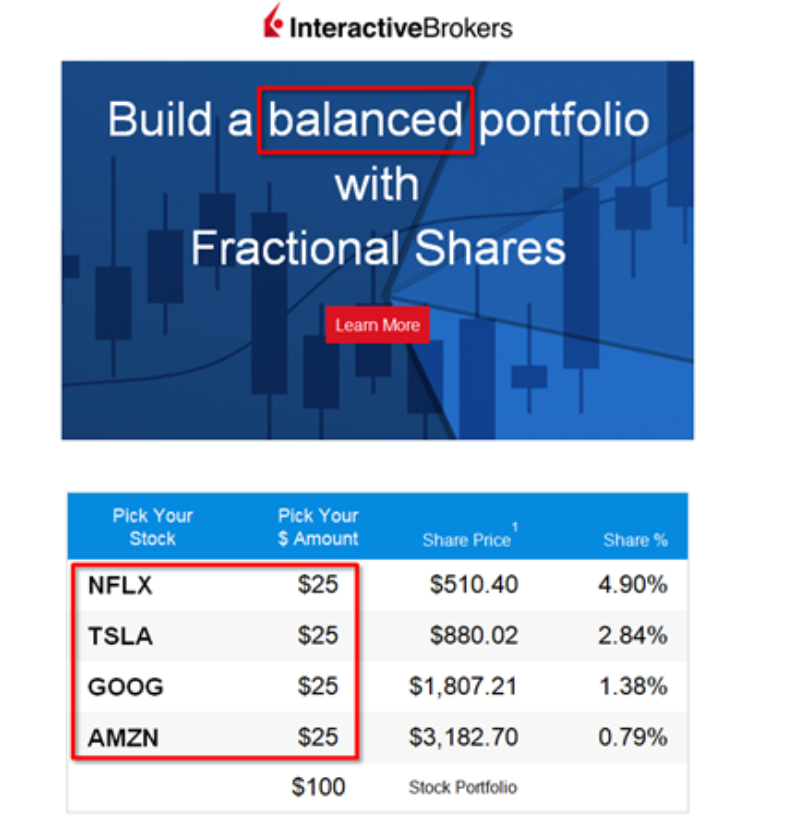
I have been writing about the extended nature of sentiment for several weeks. Macro Charts highlighted an email from Interactive Brokers on how to build a “balanced” portfolio using fractional shares, consisting of Netflix, Tesla, Alphabet, and Amazon. Either someone forgot the basics of financial planning in constructing a balanced portfolio, or we are back to the go-go days of the dot-com and Nifty Fifty bubbles.
While it is true that sentiment models are less effective at calling tops than bottoms, there are sufficient signs that investors and traders should be reducing equity risk and taking some chips off the table.

Momentum rolls over
While it is true that bullish sentiment can remain elevated for quite some time, a useful rule of thumb is to wait for downside breaks in technical indicators before turning cautious. Recently, the NYSE McClellan Summation Index (NYSI) rolled over from an overbought extreme, indicating a loss of momentum. Most of these episodes have resolved with market stalls (red vertical lines) while only a small minority have seen the market continue to advance (blue lines).

A bad breadth warning
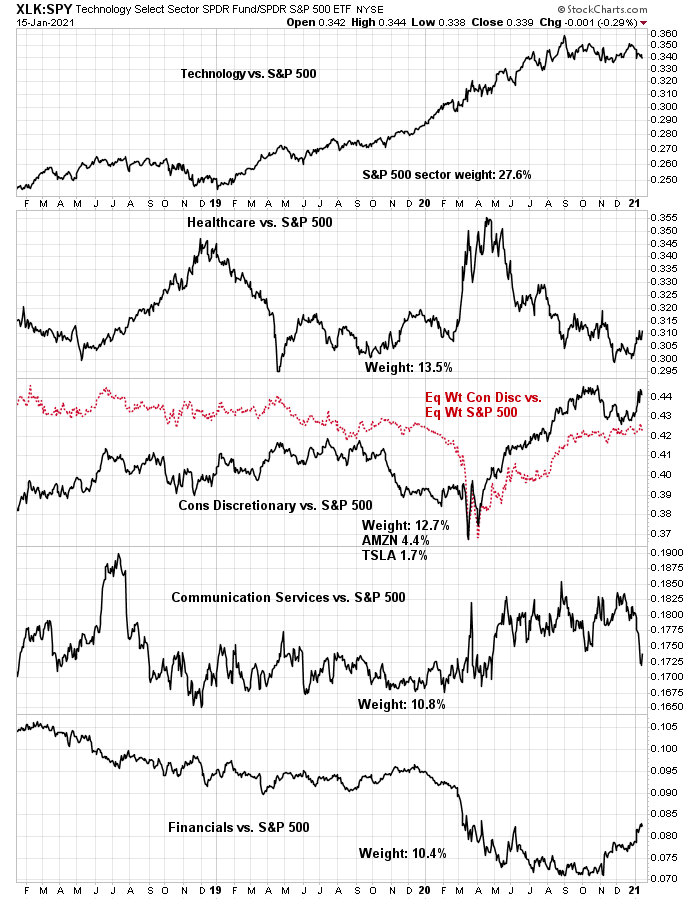
An analysis of relative performance of the top five sectors of the S&P 500 also reveals the headwinds the index is facing. These sectors comprise over 75% of index weight, and the market would have difficulty rising without the participation of a majority of these sectors. Currently, only the smallest of the top five, financials, is displaying positive relative strength. All of the other sectors are either trading sideways or falling relative to the S&P 500.
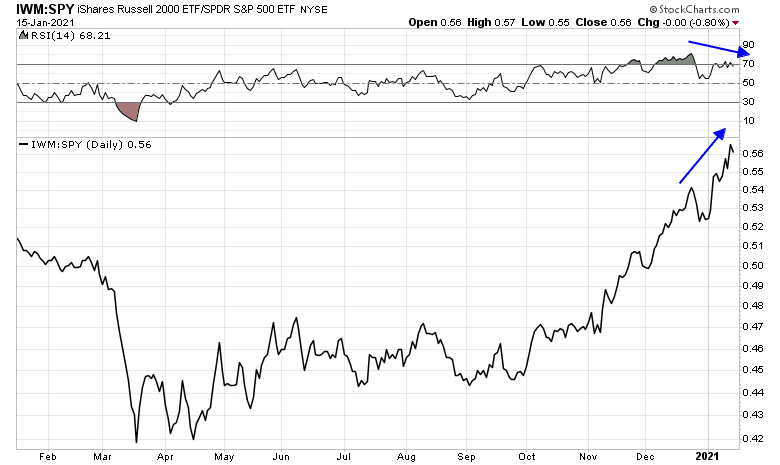
Negative RSI divergences
In addition, negative RSI divergences are showing up in market leaders even as they make new relative highs. Since the March low, small cap stocks have been on fire, but the relative performance of the Russell 2000 to S&P 500 is exhibiting an RSI negative divergence even as the ratio makes new highs.
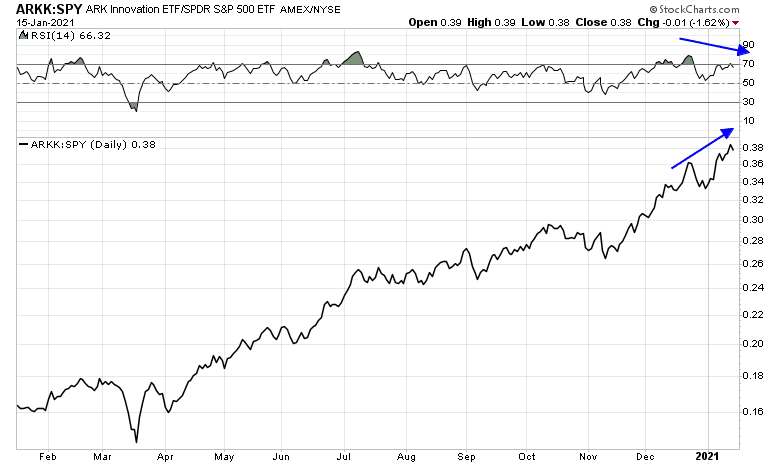
The enthusiasm for the ARK Innovation ETF (ARKK) is highly reminiscent of the mania surrounding the Janus 20 Fund during the dot com era. Similar to the Russell 2000, the ARKK to SPY ratio is also exhibiting a negative RSI divergence, which is another warning for the bulls.
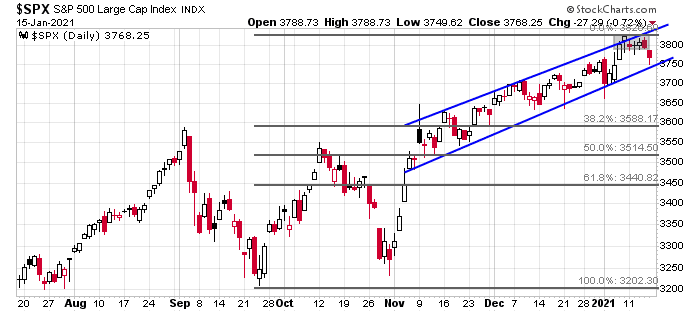
Lastly, you can tell the character of a market based on how it reacts to news. The S&P 500 broke short-term support (shaded box) even as Biden unveiled a $1.9 trillion fiscal support package, and Fed chairman Jerome Powell reiterated the Fed’s dovish commitment to maintain the pace of asset purchases. In addition, earnings beats by Citigroup and JPMorgan were met with red ink for their share prices. These reactions are indicative of a heavy tape and a market that’s ready to fall. In the short-term, the path of least resistance is down. Primary support can be found at the rising trend line at about 3750, with secondary support at the Fibonacci retracement levels of 3588 and 3515.
Also keep an eye on the USD. The USD Index is undergoing a counter-trend rally by rising through a short-term downtrend (dotted line), but the long-term downtrend (solid line) remains intact. Initial resistance can be found at about 91, with key secondary resistance at 92. The USD is an important risk appetite indicator. It has been inversely correlated with both the S&P 500 and emerging markets (bottom panel).

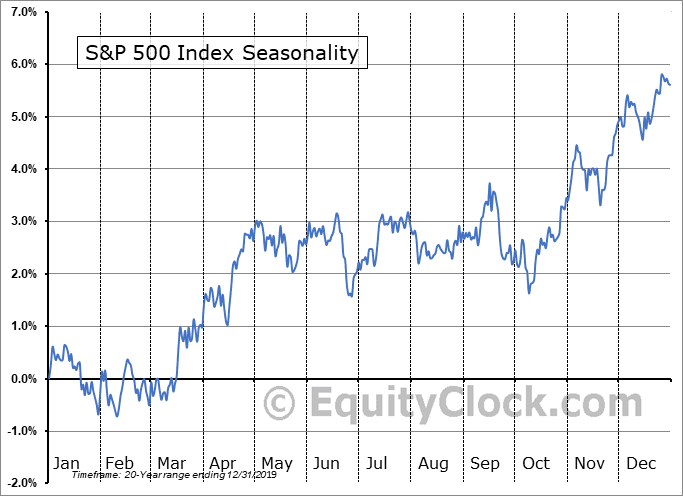
In conclusion, the seasonal Santa Claus rally that began in December is living on borrowed time. This market is vulnerable to a 5-10% setback, and it can correct at any time. While it’s impossible to call the exact timing of a short-term top, the weight of the evidence suggests that it’s time to tactically reduce equity risk and take some chips off the table. We are into a period of negative seasonality and choppiness until early March.
Subscribers received an email alert that my inner trader had initiated a short position in the S&P 500. Keep in mind, however, that the primary trend is still bullish, and the utility of trading short positions in a bull market is less useful.
My inner investor remains overweight equities. He has selectively sold covered call options against long positions as a way of reducing risk.
Disclosure: Long SPXU
The biggest question about a pullback is whether the extreme, bubble happenings with IPOs, small trader option trading, short squeezes and SPACs is shaping up as a major top and collapse similar to the Tech/Dot.com Bubble peak of the year 2000. Will the markets implode if the speculation collapses? That would suck our long term portfolio holdings down too,
My guess is yes, the speculative bust could be at anytime. What should one do with a huge amount of the investment world in La-La land ready for a dose of cold water?
Investech had a great chart in this month’s issue of the first nine months of the bear market from the peak in March, 2000. It showed the NASDAQ down 50%, the S&P 500 Growth down 28% and the S&P 500 Value UP (yes UP) 4% in the first nine months.
If you are worried about a year 2000 type of Tech/Growth Crash then own Value is the lesson. It’s the best chance to safely gauge the ongoing market environment when the shit hits the fan.
How could it be that the Growth half plunges massively in the year 2000 when Value goes up?
In my opinion it’s the dynamic of institutional money management. A pension fund will give the manager a mandate to own stocks. A mutual fund manager also is told to stay fully invested. So in the year 2000 when Growth is unwinding from its bubble, managers would be shifting from Growth to Value. They can’t go to cash. When the pension fund sends them more money to rebalance to bring equities back up to their mandated level, they would buy Value because the Growth narrative had turned toxic.
The same dynamic might happen this year if the Growth bubble pops. Value has a high yield and a much lower PE. Hell a lot of the popular growth stocks have no E. Expect a lot of shifting to and an absence of selling of Value.
Growth in 2000 was an internet mania of companies with no revenues and sky high valuations. Growth in 2021 is largely companies with growing revenues, strong cash flows and competitive advantages. There is a speculative aspect but it’s not a significant portion. So, context of growth in 2000 vs 2021 is important. Similarly with value companies. In 2000, they were cash flow positive with reasonable prospects. Today, value companies need to adapt to the new world. Intel, largest component in VLUE, has to figure out its competitive position. AT&T, second largest, has ton of debt to pay off with revenue growth in jeopardy.
Details and context are critical.
So, are you saying that in your opinion, growth will continue to outperform value in the foreseeable future?
I think focus on growth vs. value may lead to inferior choices. There are significant macro trends in place for next 10-20 years. Climate Change has a global focus and investment dollars. Many recognizable areas are battery technologies, EV, Clean Energy, Renewables etc. These are secular growth opportunities. 5G is another area with a long runway. Not only how consumers use it but in industrial setting and Internet of Things. In Health and Sciences – gene sequencing, editing and splicing to develop personalized treatments. I could go on and on.
So called Value investing may be a trade or a trend for a while but longer term investments must be in secular growth areas.
I approach this issue in a bar bell fashion. Verizon, for example, is a solid dividend payer with growth potential from 5G. It’s in my portfolio. So are others to balance the volatility in other areas.
A very individual choice.
Another approach is based on business cycle and sectors that perform better in various phases.
Dichotomy of growth and value is intellectually less interesting.
Ravida, very good points and a reason the outcomes may not be as big but I think there is a similar dynamic at play to some degree.
Howard Marks of Oaktree Capital recently expressed his opinion that ‘dichotomy between value and growth is artificial’. FWIW
The nice thing about the markets is that all predictions about it will be proven right or wrong. We’ll all be proven wrong much of the time. I’m pretty forgiving of the wrong calls of others – not so much my own. If I’m wrong, usually I’ll immediately shift gears and come up with the next plan.
Right now, I think the pain trade remains higher. Too many traders are either expecting or hoping for a move lower. The market generally doesn’t make it that easy. The hard trade last Thursday and Friday was to go long and/or remain long ahead of a 3-day weekend with a sell-the-news reaction to Biden’s speech + headlines warning of violent protests and a poorly-organized effort to distribute Covid vaccines. It’s the hard trade that pays off best if one is willing to hold through the uncertainty. As always, I could be wrong. In which case, I’ll move on to the next plan.
Adding to existing positions + opening or reopening a few others premarket.
Indications are we open higher – but probably not as high as we close. JMO.
Trimming EEM premarket.
Trimming NIO/ PLTR.
Adding to KRE.
Reopening EWZ.
Adding OIH.
Adding a position in VTV.
Discovered a new ETF-> PAVE, which tracks the entire infrastructure sector. Starter position.
Paring back on XME here.
Adding back to EEM.
Trimming VT.
Based on what I see right now (the SPX encountering headwinds at 3800)-> Plan A is to close all positions end of day.
I would reconsider only if the SPY closes above 381.49 on decent volume.
Closing all positions in individual stocks and ETFs here.
Will be closing positions in RYSPX (+ a couple of smaller positions opened Friday in RYDHX [Rydex DJIA] and RYOCX [Rydex version of QQQ]) end of day.
+2% ytd. Nothing to write home about – but it works for me.
I would only consider doing the opposite — short if it closes above 3800.
It seems a shot squeeze is in process. The most shorted have gained the most over the last few weeks.
Is there an ETF to go Long these stocks?
Check out SPHB. I don’t know if it fits the criteria for you.
Thanks for the suggestion.
I was specifically looking to go Long the stocks with the highest Short Interest as a % of the float.
Should have remained long. Sanjay may be right – not only about individual stocks, but also the indexes. Too many traders looking for a correction that will only materialize when the market is ready.
One plus re the past two weeks is that in the process of digging deep for alternative traders and/or digging myself out of a hole – I’m less concerned about the curve balls. Regardless of what we face each day, we’ll find ways to make money. -3
Taking a swing @ XLF/KRE on the opening pullback.
FCEL.
RIOT. QS.
All positions closed – very minor overall gain.
I’m entirely neutral at this point. It’s not the kind of day to be chasing anything, and for a longer-term reentry I would need a pullback.
DIX under 40 but short squeeze in process.
The market excels at inflicting pain, which is why the pain trade works so often.
I closed many positions yesterday just in time – PLTR/ NIO/ XME/ KRE/ XLF/ RIOT/ ETCG.
On the other hand, I closed many more way too early – VT/ EEM/ RYSPX/ RYDHX/ RYOCX.
It appears that buying the kitchen sink (VT) was the right approach.
So I’m experiencing a degree of pain just sitting in cash.
Psychologically, what’s helping right now is to page back mentally to last September. I’ve been using September 25, 2020 as a starting point for many of my calculations – that’s because I had more or less locked in many gains near the early September highs, and then sidestepped the succeeeding -10% decline. Thus the perspective that not only helps the most but is also in many ways the most accurate benchmark to use? Comparing my portfolio return since September 25 to the return of the SPY since September 2. I come up with +10.35% for the portfolio versus +8.17% for the SPY (unadjusted for dividends). If we adjust for dividends, given the +1.52% yield for SPY that still puts me in a decent place.
That’s one way I deal with pain – and there will be a degree of pain when trading the markets just about every day.
At this point, I’m only to come up with one attractive entry. Will reopen a position in RYGBX (Rydex Long Bond) end of day.
I have just tried to pick very small short position in SPX.
Rumor has it SPXU symbol changing to FCKU.
Top?
Top? For how long 🙁
Even HSGFX eventually bottomed out – after ten to eleven years of calling the top.