Preface: Explaining our market timing models
We maintain several market timing models, each with differing time horizons. The “Ultimate Market Timing Model” is a long-term market timing model based on the research outlined in our post, Building the ultimate market timing model. This model tends to generate only a handful of signals each decade.
The Trend Asset Allocation Model is an asset allocation model that applies trend following principles based on the inputs of global stock and commodity price. This model has a shorter time horizon and tends to turn over about 4-6 times a year. In essence, it seeks to answer the question, “Is the trend in the global economy expansion (bullish) or contraction (bearish)?”
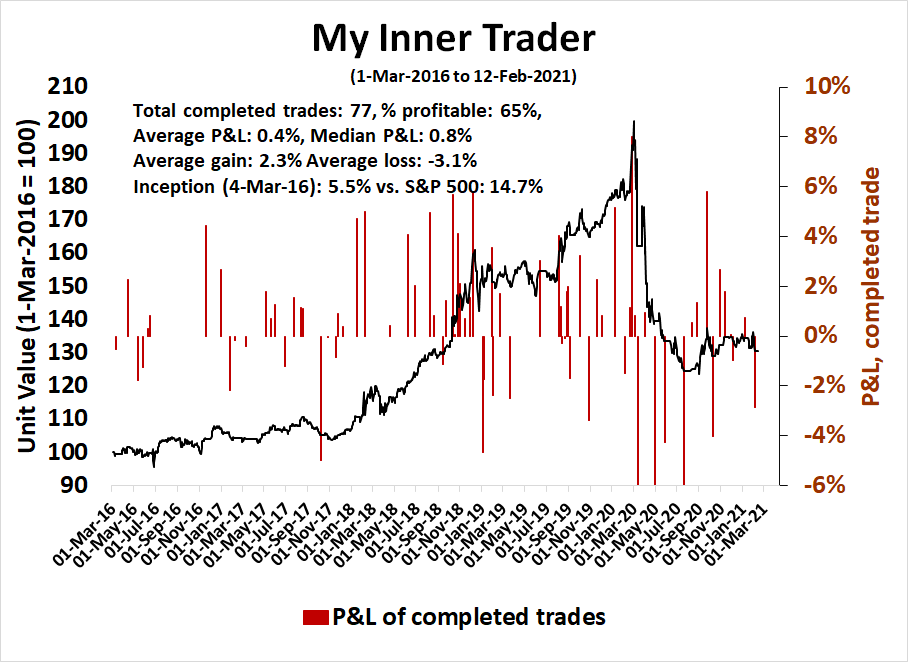
My inner trader uses a trading model, which is a blend of price momentum (is the Trend Model becoming more bullish, or bearish?) and overbought/oversold extremes (don’t buy if the trend is overbought, and vice versa). Subscribers receive real-time alerts of model changes, and a hypothetical trading record of the email alerts are updated weekly
here. The hypothetical trading record of the trading model of the real-time alerts that began in March 2016 is shown below.
The latest signals of each model are as follows:
- Ultimate market timing model: Buy equities
- Trend Model signal: Bullish
- Trading model: Neutral
Update schedule: I generally update model readings on my site on weekends and tweet mid-week observations at @humblestudent. Subscribers receive real-time alerts of trading model changes, and a hypothetical trading record of those email alerts is shown here.
Subscribers can access the latest signal in real-time here.
Still scaling the heights
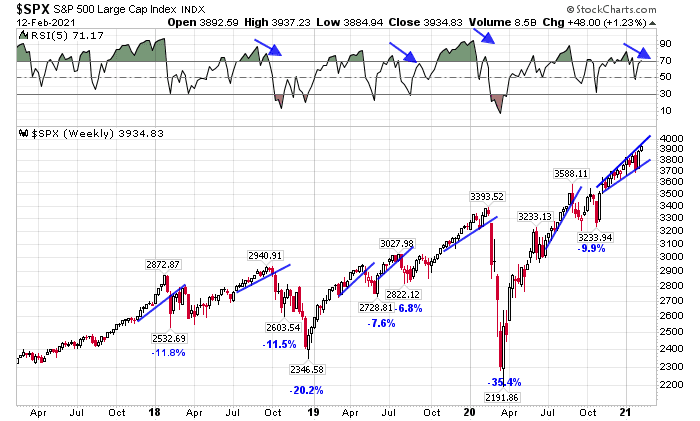
The S&P 500 remains in an uptrend on the weekly chart. After pulling back and successfully testing the lower bound of a rising megaphone trend line three weeks ago, the index rose to test resistance as defined by the upper megaphone trend line.
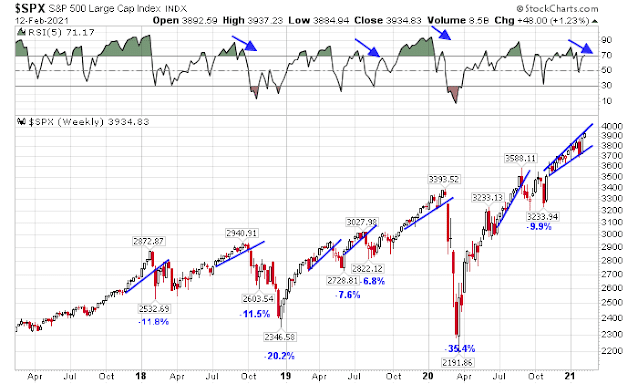
Should the market break out to the upside, it would represent a blow-off top of unknown magnitude. On the other hand, bulls should be warned that the market is exhibiting a negative divergence on the 5-week RSI. Should the market break the lower megaphone trend line, the experience of the past four years suggests a pullback in the 6-12% range.
Does this market action represent the start of a renewed bull or the last gasp of a dying bull? Here is what I am watching.
Earnings, earnings, earnings!
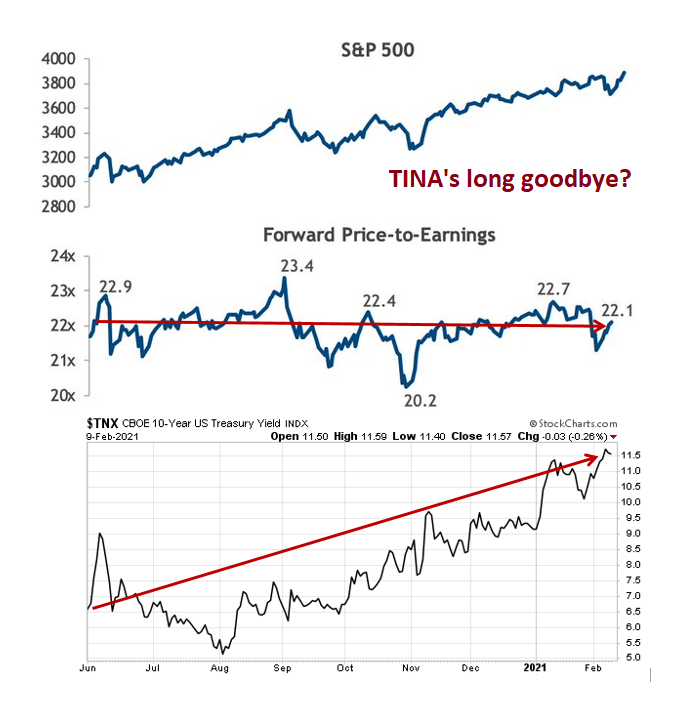
Keith Lerner at Truist Advisory Services observed that the S&P 500 has been rising since last June, but the market’s forward P/E ratio has been steady. This indicates that forward EPS estimates have been rising in line with stock prices, which is constructive for the bull case. What he neglected to mention is that the 10-year Treasury yield has risen about 0.5% during the same period, which makes fixed-income instruments more competitive with equities. In order for stock prices to rise, EPS estimates need to rise at the same pace or more than the stock index. Otherwise, the strength of the TINA (There Is No Alternative to stocks) investment theme will fade.
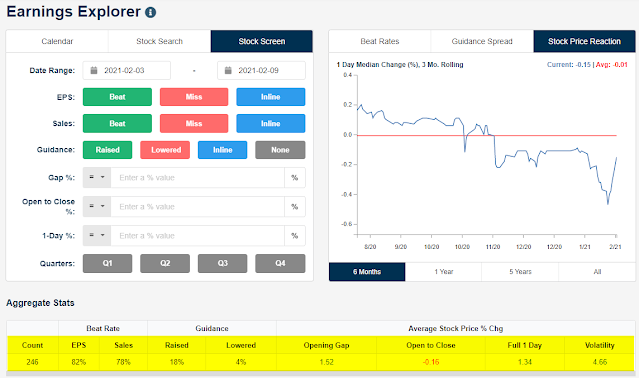
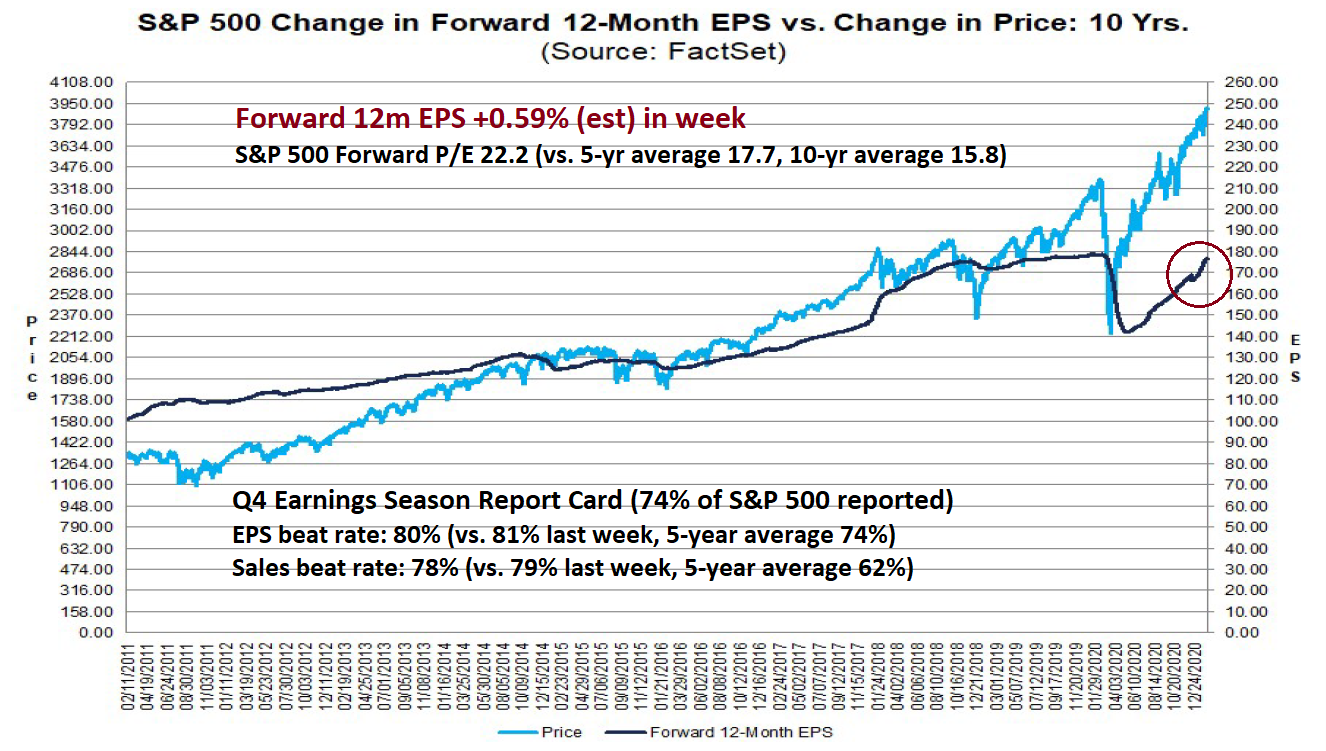
To the relief of the bulls, earnings estimates have been rising. The EPS and sales beat rates of the Q4 earnings season have been ahead of historical averages.
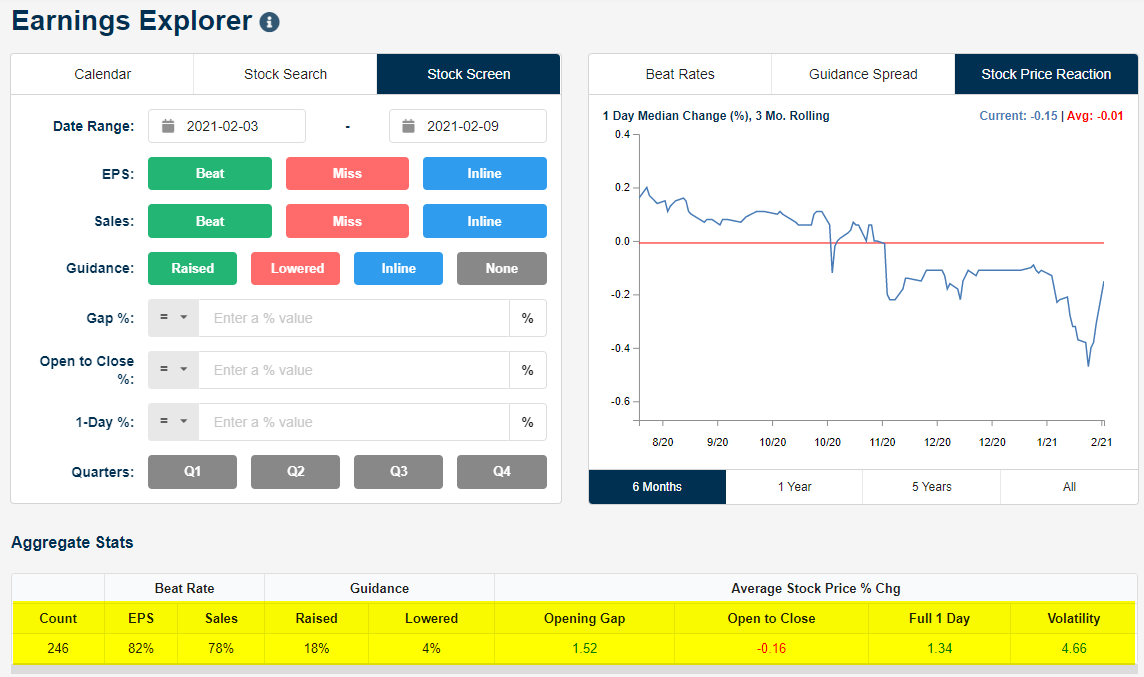
However, there is some question as to how much of the Q4 earnings beats have been priced in. For the first half of earnings season, the market was not rewarding earnings beats but the situation turned around in the last week.
Bespoke reported that stock prices had been falling in reaction to earnings reports but improved sharply in the week ending February 9, 2021. The one-day price reaction to earnings report for that week was a positive 1.34%, which was considerably better than the earlier periods.
Sentiment: Elevated but off the boil
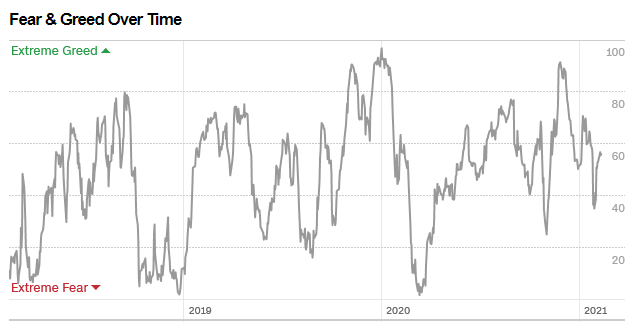
Sentiment model conditions are still excessively bullish but they are mostly off the boil. The Fear & Greed Index is recovering after falling, but readings are still in neutral territory and not excessively bullish.
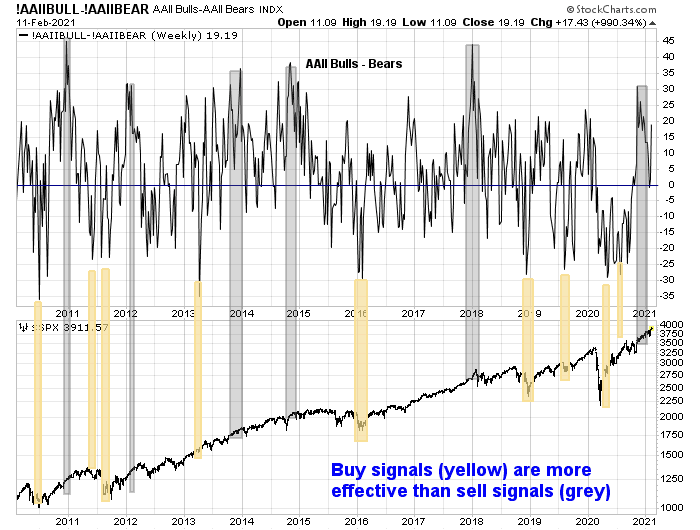
AAII sentiment has also recycled back to net bullish, but conditions are not extreme enough to be alarming. In any case, overly bullish AAII sentiment has not shown itself to be a timely sell signal in the past.
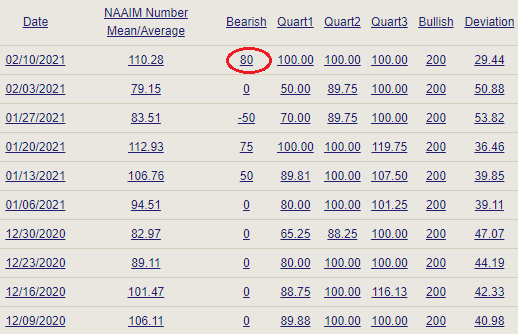
One area of concern arises out of the
NAAIM Exposure Index, which is a survey of RIAs managing client funds. The latest survey shows that the most bearish respondents are 80% long the market, which is astounding.
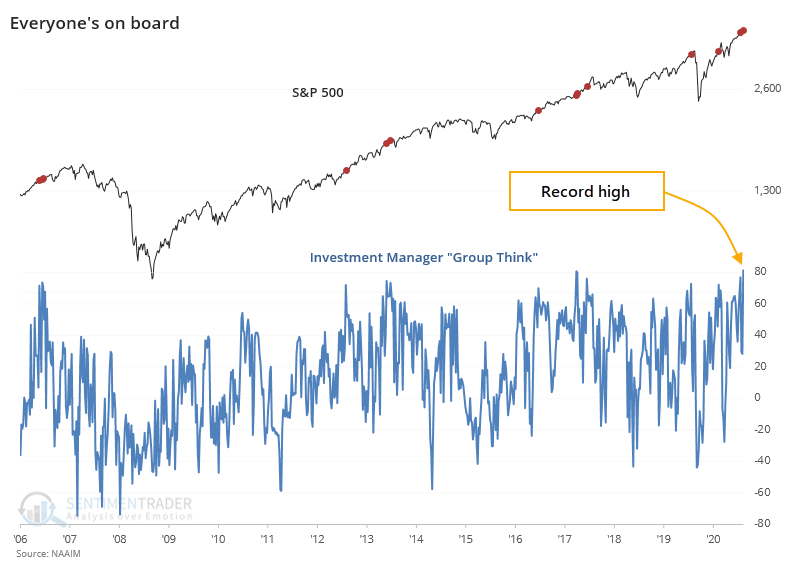
However,
SentimenTrader pointed out that while these readings are concerning, they have not constituted actionable sell signals in the past.
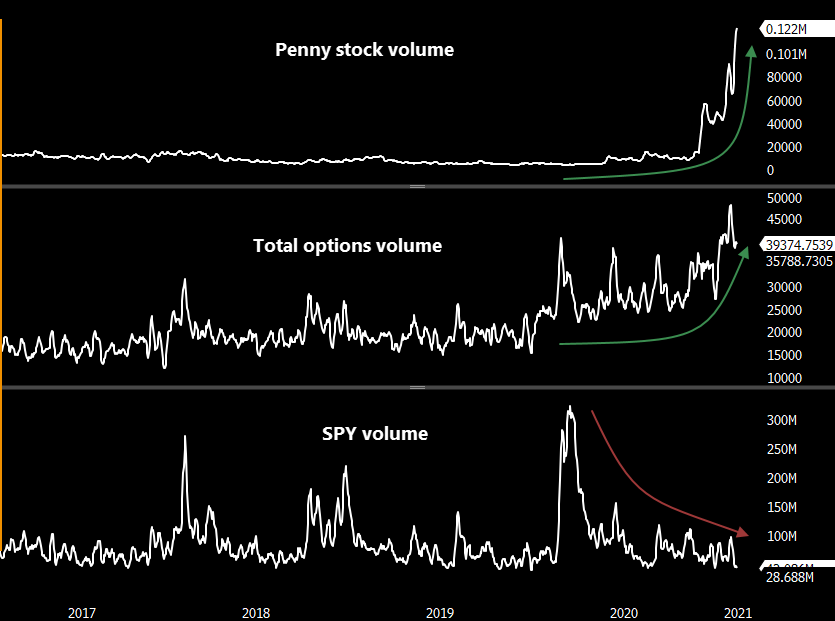
In addition, the surge in penny stock and option trading volume along with a collapse in SPY volume has a bubbly feel of a stampede of inexperienced small retail traders. One investment professional
reported, “Schwab is receiving so many requests to turn on options trading that their usual 24-48 hour application turnaround is now 7-10 days.” Bubbles can persist for a long time but bubbly conditions don’t constitute immediate sell signals.
These sentiment conditions as worrisome. The market can pull back at any time, but conditions are not excessive enough to preclude additional price gains.
Market internals: A second wind
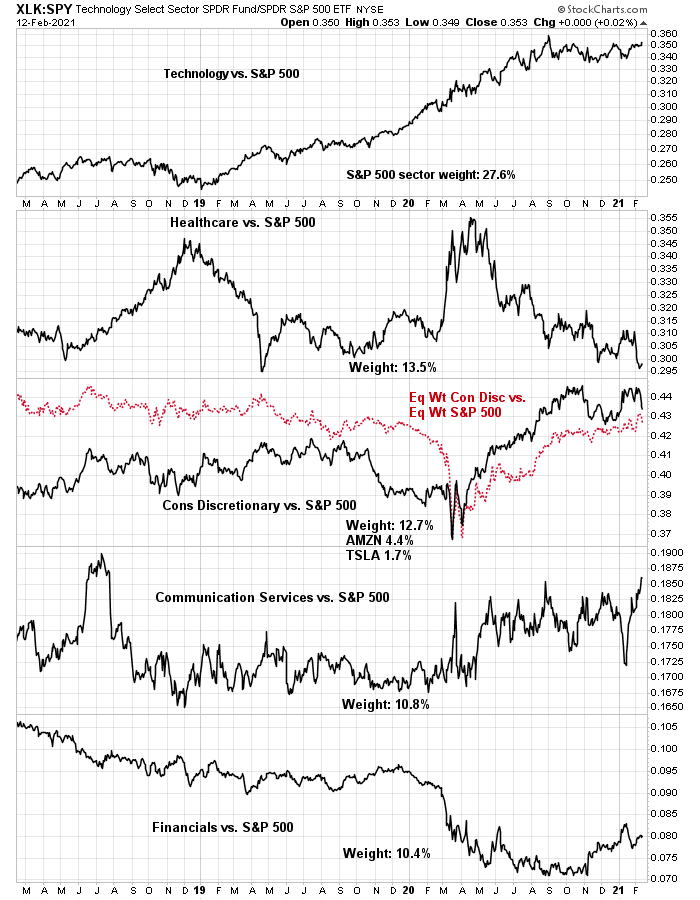
A glance at the market internals of the top five sectors shows the bulls getting a second wind. These sectors represent about 75% of S&P 500 index weight, and it would be impossible for the market to advance or decline without the participation of a majority of these sectors. The relative performance of the Big Tech sectors (technology, communication services, and selected consumer discretionary stocks) are all turning up, along with financial stocks.
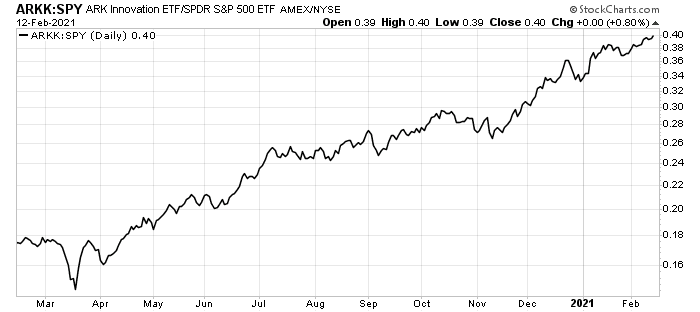
In addition, the performance of the high-octane and speculative stocks, as proxied by ARK Innovation ETF, is beating the market.
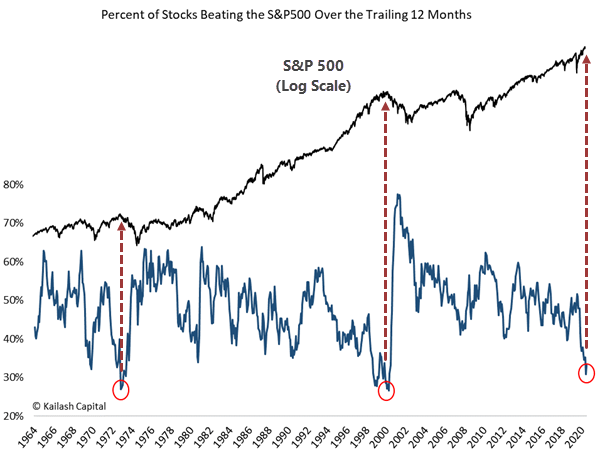
On the other hand, leadership is narrowing, and that’s a concern from a longer-term perspective. The percentage of stocks beating the S&P 500 has dropped to historic lows.
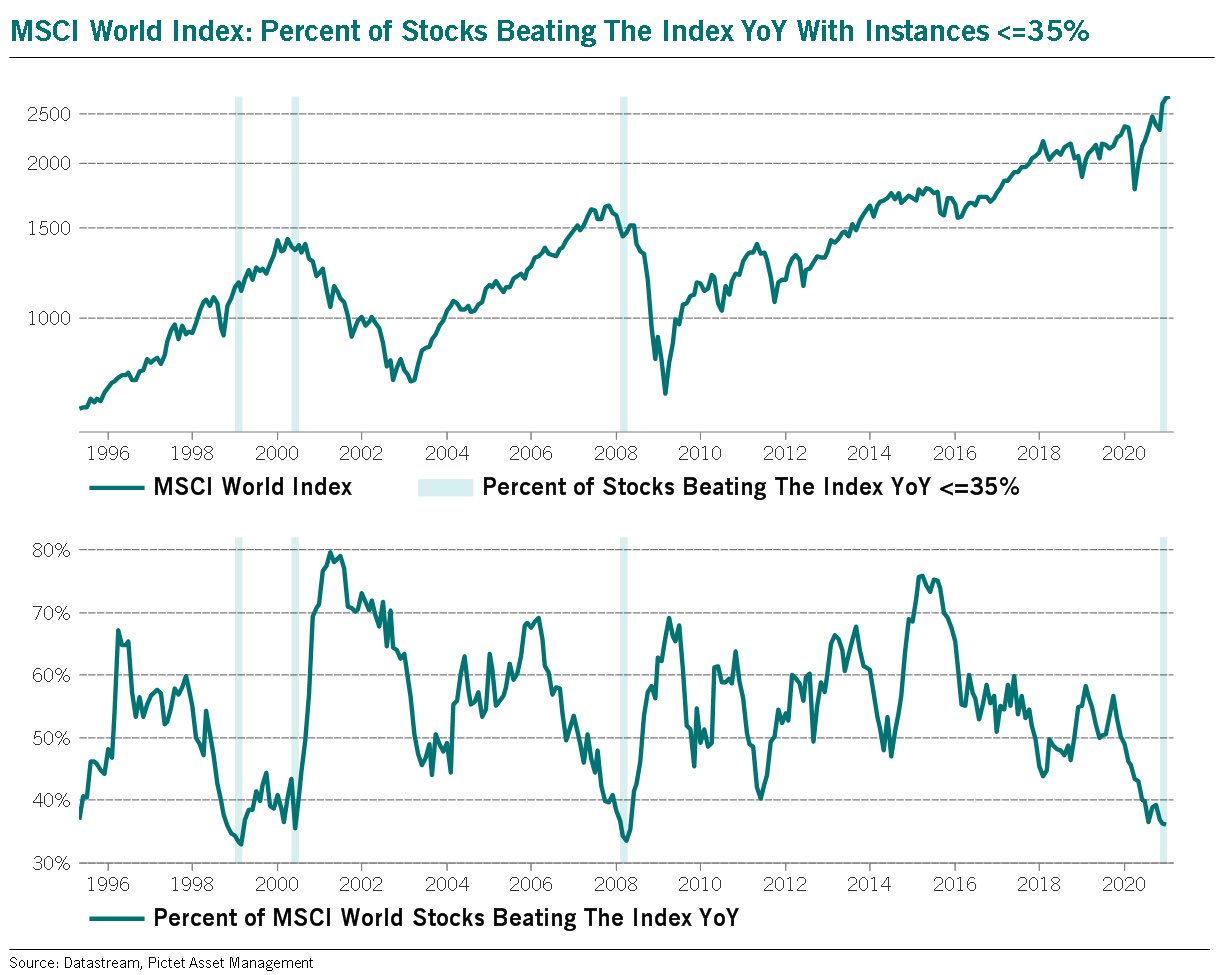
A similar pattern of narrow leadership can be also observed globally.
Waiting for resolution
Where does that leave us? The bulls can point to renewed bullish technical conditions that are supportive of additional gains. Sentiment conditions, while elevated, can rise further before reaching crowded long readings.
The bears can highlight selected technical warnings, such as the negative divergence on the 5-week RSI and narrowing leadership. In addition, the combination of SPAC mania and retail meme trading are characteristics of a speculative top that does not end well (see
Rip the bandaid off now, or later?).
I interpret these conditions as a market that is extended and can correct at any time. However. the market can grind higher in the short-term. Investment-oriented accounts should raise some cash and reduce some risk at these levels. Traders should wait for definitive signs of either an upside breakout of the megaphone, which would indicate a bullish blow-off top, or a breakdown below megaphone support, which signals a correction, before acting.
This is another great post and analysis of the S&P 500. As you know, I believe we are in a period where Value and Growth are on uncorrelated paths. Watching the two together is like having a herd of goats and ostriches.
Let me try to parse out out Value and Growth in a very shallow but possibly enlightening way using the above information in each section.
SCALING THE HEIGHTS
Value: Value had a small correction in the second half of January in the new bull market that started with the Vaccine announcement November 9. It is now making new highs on the back of strong upward revisions of earnings as the pandemic comes under control.
Growth: FAANG+ stocks seem to be making their last gasp in an environment of bubble-like growth investor enthusiasm. Interest rates and inflation indicators are rising which is a negative for Growth stocks.
EARNINGS,EARNINGS,EARNINGS
Value: Earnings revisions for economically sensitive Value companies are soaring as the timeline for leaving the pandemic behind us is shortened. The projected PE for the Value group is therefore falling hard from the June to November level.
Growth: Projected earnings for Growth companies have been muted as government taxation policies on the group are a worry and the ‘Stay at Home’ meme is fading. The project PE is rising as these Growth stocks have been going up with earnings projections flat.
SENTIMENT: ELEVATED BUT OFF THE BOIL
Value: No signs of excess as higher projected earnings are met with little enthusiasm. There are early signs of a growing narrative around inflation and a positive dialog around inflation benefiting industries and stocks. This is far from the intense bubble conditions towards these inflation-loving areas that happened in historic periods of inflation.
Growth: The Robinhood crowd are showing signs of fatigue as new targets only briefly rise before falling back. The next relief check from the government could give them some more ammunition but that could be the end of it. There is a danger in extrapolating this frenzied amateur commission-free trading to the overall market as it is a narrow new phenomena. SPACs are still in hot demand and in the news. But the signs of a speculative bubble popping in ‘Stay at Home’ stocks seem to be in the air.
MARKET INTERNALS: A SECOND WIND
Value: Value sectors are showing signs of starting a new secular uptrend starting on November 9, Vaccine Day. They have very low weight in the S&P at the moment but will be a continuing positive force going forward. Note on the chart of the ‘percentage of stocks beating the S&P 500’ that the extreme low was hit in the year 1973 when the ‘Nifty 50’ growth stocks peaked and a huge secular rally in Value inflation-loving stocks in that inflation decade to follow. Then the next extreme low was the year 2000 when the tech and the NASDAQ peaked and Value stocks started a massive secular run. It the current extreme low marketing the starting of another secular Value and inflation run?
Growth: The large Growth industry weightings are showing either a bull market topping structure in their charts or a consolidation before another leg up. The later will give the overall index a ‘Second Wind.’ This might be their last gasp. If the situation is similar to the year 2000 tech and dot.com bust, previously ignored Value stocks will do well even as popular Growth stocks fall.
WAITING FOR RESOLUTION
The bears are very experienced Value gurus who see the excesses of the Growth stocks as a sign that the whole market is at a peak. Historically, markets were correlated and everything peaked together. But the bears don’t understand that the EXTREME difference in performance between Value and Growth over the last five years has them incredibly uncorrelated.
The bulls are Value investors who see economic conditions and earnings surging as we leave the pandemic behind. They are skeptical of the government’s ability to control inflation after such a huge injection of government borrowed support money. They see no value in bonds and very high relative value in economically sensitive Value stocks.
And the bulls are also ‘New Era’ Growth investors who believe the pandemic has brought the future, disrupted world closer and the seemingly high valuation of the growth beneficiaries will be justified. They might be right.
I hope this explains how I see the market as two separate worlds, goats and ostriches. Looking at the together is a labor of randomness.
Ken,
Thank you again for all your insights.
What’ll be the impact of inflation on the cyclical stocks? I can see the numerator (both revenue and earnings) rising as these companies will have pricing power in an expansionary environment. But so will the numerator (discount rates) as inflation rises?
How will the stocks react as the overall market tanks led by growth / FAANG names?
Thank you again.
In the extreme example of inflation in the 1970’s inflation loving Value stocks like resources went up huge as their margins grew fast than the interest rates offset with lower PEs. Companies that could expand margins did well.
Companies that saw margins hurt by higher input costs including Value stocks did not do well. Take the auto companies for example. The cost of parts rose and consumers balked at the higher car prices. Grocery chains saw it more difficult to pass on higher food prices.
The DJII went sideways at 1000 in the 16 years from 1966 to the highs of in inflation in 1982 when the Canadian Index filled with resource stocks went up fivefold.
The earnings and dividends of the DJII stocks went up big in those 16 years but interest rates rising from 5% to 15% sent PEs down from 15X to 7X to offset them.
You want cyclical earnings that go up without an offsetting rise in interest rates that lead to lower PEs. With commodity stocks that’s easy because margins skyrocket with higher commodity prices. With other cyclical stocks it’s a finer calculation.
One thing very different in the 1970s from now is labor costs. In the 1970s labor union contracts were very strong and had inflation-matching increases built into contracts. So as inflation went up for commodity inputs it also went up for labor.
Today it is different. Labor wages do not keep up to inflation and even the inflation stats are not reflective of other input and selling amounts. So many labor intensive companies could do better in the future inflation scene.
Excellent insight! Very helpful. That’s the kind of response I am looking for.
Thank you again.
Thanks, Ken. I think you’re on the right track. There are any number of asset correlation programs out there, and I picked one at random. I started with the following tickers, although someone here may come up with better suggestions-> SPY EFV XLE PICK XLF VTV EEM QQQ XME GDX. The correlation coefficients for the period from November 1 to February 12 are in fact noticeably lower than for the few months prior. All positive, of course (TLT would probably show a negative correlation), but in the event of a pullback in the SPX the decline in a portfolio positioned in value/energy/commodities/metals would be significantly smaller.
There are so many contradictions in this market.
Value versus growth, yes I get it that growth has outpaced value and value should have it’s day, but when the bear strikes the baby goes out with the bathwater. So if value drops by 40% while growth takes an 80% hit, yeah value did better, and low vol might even do better on a relative basis.
Is cash safe? probably in the short run, but watching a meltup while sitting on cash is difficult, even Drukenmeir (hope I spelled it right) got fooled in the Dotcom bubble.
Why is bitcoin so strong while gold is languishing, I would get it is both were shooting for the moon with BTC stronger, but this is not the case….maybe because gold is real and market pricing forces put a lid on things.
But when the bear really strikes gold will likely go down, like it did in 2000 and 2008….forced liquidation to cover other losses? Will this happen to BTC and then the price does not support the miners, if nobody mines BTC what is the value?
Human nature does not change and governments want control..we see it in currency control, taxes, you name it, when will they see BTC as a threat? It may or may not happen, maybe quantum computers will save BTC by reducing mining costs, or destroy it. Whatever happens, human nature will always be there and maybe this will be why we get a meltup.
Looking at the chart above, the one of S&P scaling the heights looks like a broadening pattern (I would call it megaphone, but there may be specific criteria missing), but if the S&P is breaking out of a pattern that dates back to 2018, this breakout will last more than a week.
If you look at $COMPQ for the Dotcom period one sees a very similar pattern. What is interesting is that in the Dotcom $COMPQ had a lower low in 98 than 10 months earlier late 97 early 98…this time around SPX had a lower low in 20 than in dec 18, while $COMPQ did not. Maybe all this Tech stuff which is so overpriced will lag value in the rush to the top and so this time it is SPX that will melt up and QQQ or whatever one follows will be more like the SPX back in 1999,2000. But if it does then we get insane numbers for the S&P, like 5000, give or take.
The S&P made a rising wedge (ending diagonal) in the Dotcom while the $COMPQ went parabolic. So stick this thought in a corner somewhere, if in the next 6 months to a year we see the QQQ making a wedge while the S&P goes nuts, history may be rhyming.
Or this is just speculative BS.
Dotcom the thinking of the new era of the digital revolution, now we have unlimited money printing.
Talking about goats and ostriches, bears can eat both, we do.
I hope we get a meltup so I can cash in on my Cameco lol
You may not see a melt up in Cameco but junior uranium miners such as DNN, URG may as well melt up.
I wish there was a comment upvote button, but since there isn’t let me just say I always read the great comments and appreciate them. There have been many excellent comments from Ken and others on the last several posts so thank you all!
This is a great post about the dilemma we face this week, as the market can either melt up or correct from here. I know a few weeks ago I said I would scale back at the 3920 megaphone resistance, but I am currently leaning towards the melt up scenario, as thus far at least, we seem to be flagging and building energy for a push above /ES 4000. I am having trouble staying objective as I am definitely starting to feel a bit euphoric about the markets, which is usually an indicator that I am about to get burned. Certainly this is the right spot to de-risk a bit no matter which way the market actually breaks.
Based on what I am reading, the market can easily tack on another 10-15% if it breaks from the megaphone resistance decisively.
The question is what sectors, style (FAANG, SPACs, micro-caps) or sectors (cyclicals, energy, metals) will rise the most if the index were to rise?
Jarad- I experience similar inklings at potential turning points in the market, where a fleeting thought will cross my mind (‘I’m doing well and it may be a good time ‘de-risk.’). What’s funny is that most of the time I will end up making the wrong call. If I opt to cash out, the market continues to rally. If I opt to remain fully-invested, the market will correct and I end up wishing I had ‘listened’ to my inner voice.
Rather than second-guess each of my decisions, I’ve arrived at the conclusion that regardless of how hard we try, those who attempt to time the market will find themselves outsmarted by the market most of the time!
I find it very helpful to keep the macro context in mind when reviewing historical performance. Each period has a very different set of fiscal, monetary, political and economic backdrop. In 2000, companies with little or no revenues were part of the bubble that burst. In 2020, companies with moats, revenues and growth, strong cash flows were the big winners. Are they part of a bubble?
Here is a perspective from Michael Hunstad, Head of Quantitative Strategies at Northern Trust:
The Pfizer vaccine announcement in early November ignited not only a surge in stocks, but also some of the sharpest style and sector rotations in history. Global stocks had double digit returns in the fourth quarter, but the range among different types of equities was high. In every major market, low quality stocks, those with low or no profits and high volatility, significantly outperformed as a combination of vaccine euphoria and unprecedented government aid signaled a substantial reduction in their risk. So the question is, do we buy these so-called junk stocks or has the rally run its course?
Developed and emerging market stocks returned more than 15% in the fourth quarter. However, there were still winners and losers. Rising economic growth expectations drove up both interest rates and oil prices, which buoyed cyclical sectors, such as financials and energy. In contrast, defensive sectors, such as consumer staples and utilities, posted negative returns, in some cases, trailing cyclicals by 20%.
In the end, the most expensive, lowest quality stocks saw the biggest moves. Shockingly, across both large and small caps, some of the best performers had falling earnings or outright losses. In small cap markets, for example, companies with no profits rose more than 40% in the fourth quarter alone. Similarly, the riskiest securities in all markets posted the highest gains, with high volatility stocks outperforming low volatility stocks by a wide margin. This is what a junk rally looks like.
It’s important to know that these junk rallies, while severe, tend to be brief. History has shown market momentum will push these rotations full circle, and we started to see that in January. 2021, higher quality stocks have outperformed low quality, while value and size have both posted solid gains. This pattern of extreme initial moves to junk stocks, and then a gradual shift to quality, has played out before. We saw this during the global financial crisis in 2009.
The market has a lot of shifting momentum, and these rotations will likely continue. That’s why it’s critical to neutralize your portfolio sector exposures, because the roller coaster of cyclicals versus defensives can be sharp and painful. Moreover, while it’s tempting to jump on the junk rally bandwagon, we’re already starting to see this trade deteriorate. We urge an abundance of caution and reiterate our conviction in high quality for the long run.
I hear you but there is a big difference between a new tech IPO that never had earnings and a good company that has gone from profits to losses in a pandemic. Is Denny’s junk because they’re losing money and go up 40% when a vaccine arrives to save their ass? Some of these statistics lie. At the bottom of every recession, the mining stocks are losing money and therefore have infinite PEs. That is when they bottom and lift off strongly when the economy is still sick but heading up. Years later when they are making big money and their PEs are lower than the market’s, they peak as the business cycle peaks. In other words buy them when they look like junk and sell them when they look like hold.
Stocks like Denny’s never had a downswing like the Covid before. Huge numbers of formally steady growers became cyclical, with losses, like them. Are they junk now that a more normal business environment is ahead of us? I only use them as an illustration. You get my point.
You have to look in your crystal ball and ask yourself how this pandemic has really changed things. Some restaurants have done much better than others. The ones where you sit down and dine on wine and food prepared on site from scratch have had a harder time than Taco Bell. Being in a chain or being solo also makes a difference.
So after the pandemic, what will have permanently changed? But the miners should have their day, and commodities are dirt cheap compared to equities. My biggest concern is whether there is a major drop in the next year or 2 that will wipe out gains since 2009, in which case cash is good, or will it just grind up for another 10 years which would make no sense but could still happen. My thinking is that with SPACs, and unicorn IPOs like Uber that we are getting closer to the end of this bull. Uber will never make big bucks and when self navigating cars become accepted by the regulators, it’s not like Uber or LYFT have a lock on that. I think that those who make the cars will dominate the space.
So what new trends will survive?
Impossible to know so therefore I say use momentum to invest in the leaders and avoid the laggards.
It’s fun to predict but how can we know all the competing factors is a changing world?
I have put together a good momentum and factor report on my website this week that anyone can have. Email me if you want a copy. Ask Cam for my email address if you don’t have it.
I saw it, it is huge….only I’m a little bit stupid, so I can’t figure it out. Yes I will read the momentum book again.
The momentum strategy is objective, there is no room for confirmation bias.
I have emailed you a couple of times and got no response…I don’t know if the emails got lost or you are too busy.
Have to do my taxes..ugh…then I can reread that book
It is a consensus view that when we return to some new normal, contact service sub sectors like restaurant, hospitality, travel, entertainment, casinos, sports etc. will see a surge in demand. Most of that has been priced in the valuation of all such companies whether they have a good business model post pandemic or not. Will Denny’s return to its growth days remains to be seen. But Disney has built up subscriptions model to grow while waiting for its theme parks, cruise ships, movies to take off.
A bucket of stocks based on some financial metrics and labeled ‘value’ is full of mines, IMO.
Another approach is looking at business cycle and sectors that do well in early, mid, and late phases and choose companies that will do well. Labels of value and growth are not necessarily useful.
I think mining companies will do well in an expansion. In particular, areas where there is both policy and investment tailwinds should do really well. Clean Energy efforts call for batteries. An ETF like ‘LIT’ or ‘BATT’ focuses your investment dollars on that macro backdrop.
Hi
I use Quicken for stocks and other tracking. However, it does not have the ability to get good snapshots of assets across different accounts.
Can someone recommend a good tracking software? I used to use FOLIOfn, that allowed stocks by “groups” like dividend stocks, growth, energy and so on. FOLIOfn has been sold and hence I am trying to find another program. Thanks.
Hi D.V.,
If you find a useful tool, I would be interested in learning about it.
Thanks!
Exactly what is the problem you are trying to find a solution to? Please be descriptive. Thanks.
My portfolio has several parts. Core holdings, income holdings, thematic growth holdings, trial balloons, and trading. I want to look at these as separate groups for allocation, return and risk management. I currently download into a spreadsheet and manage but it is time consuming and not easily updated. I am looking for an app where I can upload data and manage as groups.
TIA
Thanks. I have the same problem as you, several sleeves of assets, pretty much as you have described. I will keep you posted.
Ravindra
I have not found a good program that does what you have described (and I am also looking for).
A spreadsheet/database is one solution. This needs to be used with a program like Quicken (or directly from a brokerage house like say Ameritrade). Download a .csv file into Google Spreadsheets (this will give you stock prices on the fly). Download this spreadsheet into a database like Airtable, for slicing and dicing the portfolio mix. A .csv can be downloaded directly into Airtable also, but Airtable does not update stock prices on the fly that I know of.
Morningstar subscription gives you a portfolio option. However, MS does not link to brokerage houses to download stocks on the fly.
Quicken does a good job but it does not put together multiple accounts in one list of stocks.
We’re quite overbought on the broad indexes and even most sector ETFs. I don’t think this is the time to be opening positions, and unless you’re a buy-and-hold guy it may be time to trim.
In the meantime, it’s a great time to be day trading some of the small-caps. Will be trading around QS/ BNGO/ UAVS/ AYRO/ SOLO/ VISL.
PLTR selling off post-earnings may pull back to an attractive reentry.
The Ostriches: Mining ETF (PICK) up 5% US BANKS ETF up 4% Energy ETF up 3%
The Herd SPY flat
The Goats: Tech, Healthcare, REITs, Consumer, Utilities all down.
Where the herd goes from here is random. I’d rather analyze the Goats and Ostriches separately.
I have wondered what the S&P 500 would look like if it was a brand new index! I agree with the notion that it’s probably better to look at goats and ostriches or whatever other lense one prefers.
Sitting at 75% cash right now and waiting for lower prices. I’m holding the following:
MSFT, AMZN, GOOGL, MDB (10%)
XLE, DBA, XLE, VOO (10%)
Crypto – MARA, EBON (5%)
None of the positions are leveraged. Waiting on a 10+% correction to add on.
TLRY/ BNGO.
QS.
TLRY closed. That pretty much makes my day. Psychologically, it makes the rest of the day much easier.
Starter position in TLT @ 145.8x,
Out of QS.
OEG.
Back in QS.
Adding UAVS.
It may take another day or two for PLTR to create a durable low – but I definitely have the stock on a longer-term watch list.
Taking a loss on OEG.
Out of QS.
Adding a second tranche to TLT.
Taking losses on BNGO/ UAVS. Nicely eclipsed, however, by gains on TLRY/ QS.
If I had to recommend a single best trade for today, it would probably be TLT.
They’ve been tossing bonds out of windows.
What does Walter Deemer like to say – when the time comes to buy, you won’t want to. Well, I definitely don’t want to buy bonds, and in fact buying bonds for more than a trade right now sounds like a really bad idea – but the asset class is quite oversold right now.
My last two trades in RYGBX resulted in a +0.95% gain followed by a -1.86% loss. My TLT position is currently -0.18% underwater. Anyone who went long after the March 2020 flash crash is underwater.
Adding a position in RYGBX at the close – and worried about it!
good call. Watching the 10/30 for an entry point
D.V.
Thanks for the suggestions. I will try Google spreadsheet approach.