Preface: Explaining our market timing models
We maintain several market timing models, each with differing time horizons. The “Ultimate Market Timing Model” is a long-term market timing model based on the research outlined in our post, Building the ultimate market timing model. This model tends to generate only a handful of signals each decade.
The Trend Asset Allocation Model is an asset allocation model that applies trend following principles based on the inputs of global stock and commodity price. This model has a shorter time horizon and tends to turn over about 4-6 times a year. In essence, it seeks to answer the question, “Is the trend in the global economy expansion (bullish) or contraction (bearish)?”
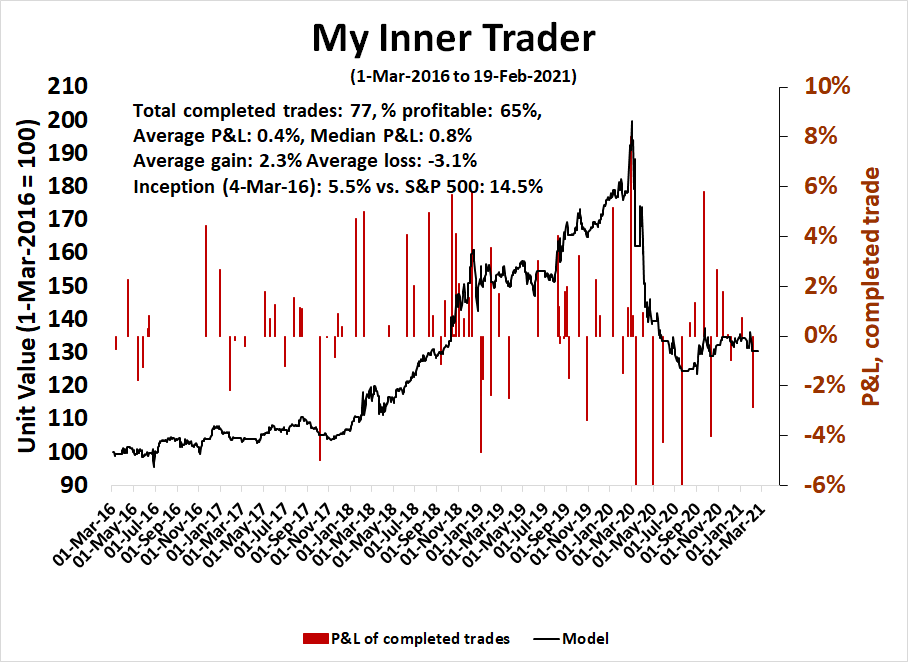
My inner trader uses a trading model, which is a blend of price momentum (is the Trend Model becoming more bullish, or bearish?) and overbought/oversold extremes (don’t buy if the trend is overbought, and vice versa). Subscribers receive real-time alerts of model changes, and a hypothetical trading record of the email alerts are updated weekly
here. The hypothetical trading record of the trading model of the real-time alerts that began in March 2016 is shown below.
The latest signals of each model are as follows:
- Ultimate market timing model: Buy equities
- Trend Model signal: Bullish
- Trading model: Neutral
Update schedule: I generally update model readings on my site on weekends and tweet mid-week observations at @humblestudent. Subscribers receive real-time alerts of trading model changes, and a hypothetical trading record of those email alerts is shown here.
Subscribers can access the latest signal in real-time here.
In need of a washout
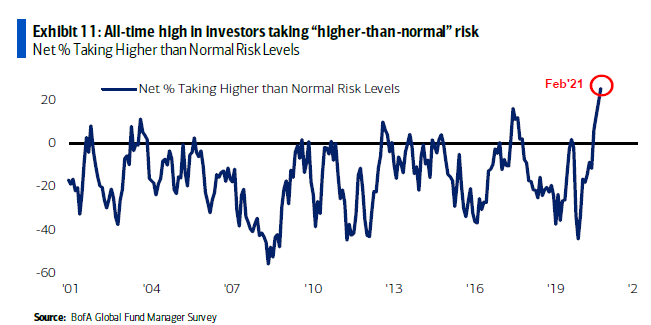
While I am a long-term equity bull, sentiment models are extremely stretched in this market and in desperate need of a reset. The latest BoA Global Fund Manager survey shows that institutional risk appetite is at historically high levels.

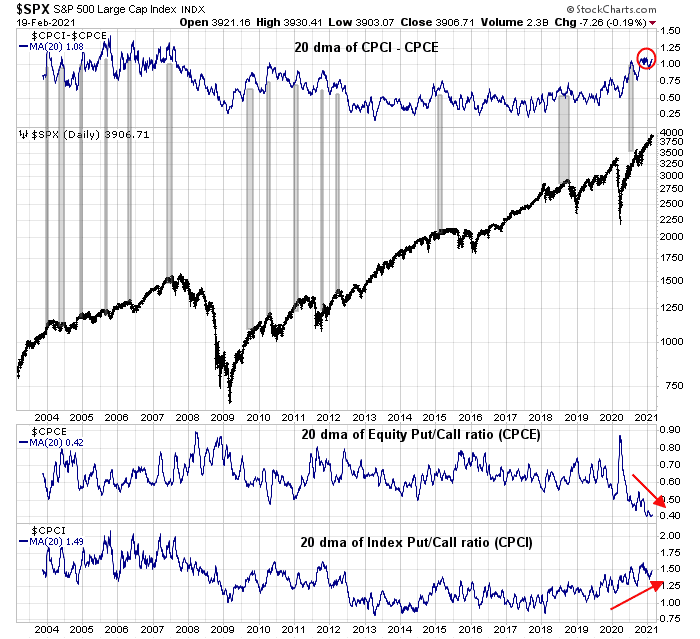
Retail risk appetite is even more stretched. The CBOE equity put/call ratio (CPCE), which tends to measure retail sentiment, is extremely low indicating excessive bullishness. By contrast, the index put/call ratio (CPCI), which measures institutional hedging activity, has been rising indicating cautiousness. Such high spreads between CPCE and CPCI have resolved themselves with market pullbacks in the past.
This is insane! When’s the sentiment reset?
The end of the retail frenzy?
In many ways, you can tell that we are nearing the end of the retail trading frenzy when Congress holds hearings into the GameStop Affair. Bloomberg TV also took steps to educate its viewers on WallStreetBets lingo.
The
WSJ also featured the profile of a 25 year-old security guard who took out a $20,000 loan to play GameStop and lost. These are all typical signs of a mania that’s nearing its end.
The bear case
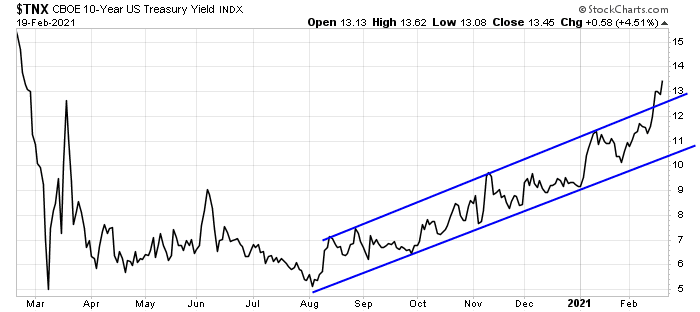
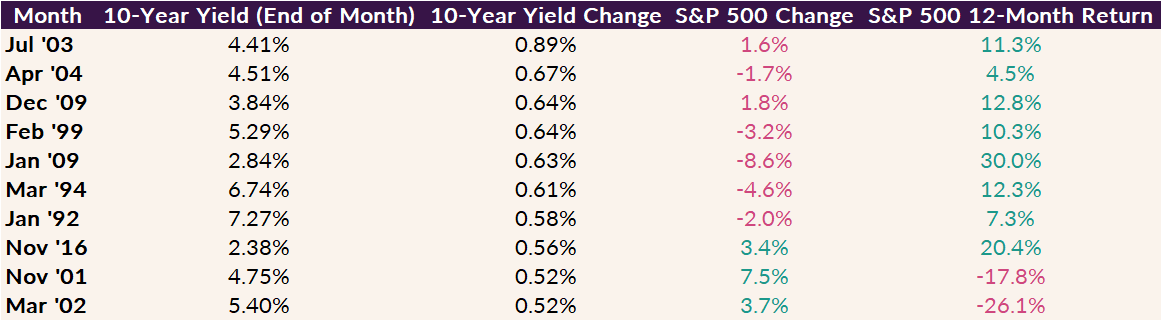
Here are some bearish factors to consider. The 10-year Treasury yield has taken off like a rocket and even rose through a rising trend line.
Ally strategist
Callie Cox found that “Quick jumps in the 10-year yield tend to freak out stocks, but stocks tend to do well in the 12 months after….because big jumps in yield often happen at the tail end of recessions or early on in economic recoveries”, which describe current circumstances well.
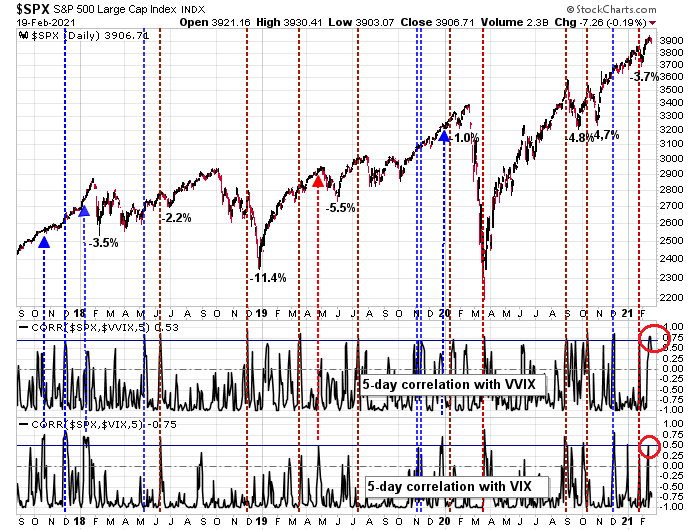
As well, simultaneous high correlations between the S&P 500, the VIX Index, and VVIX, which is the volatility of the VIX, have tended to resolve with pullbacks in the 3-5% range in the past.
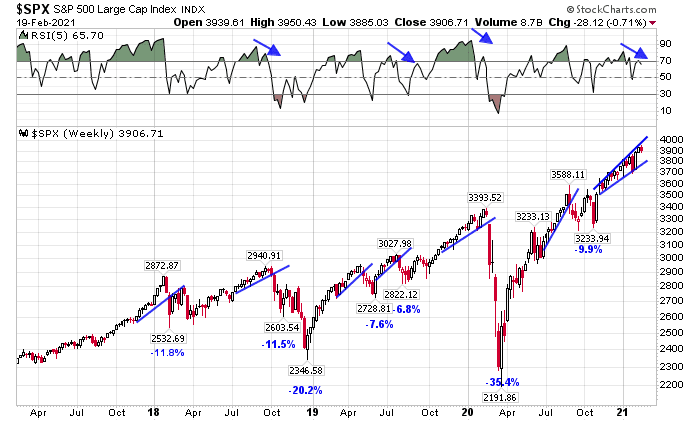
The weekly S&P 500 chart is exhibiting a negative 5-week RSI divergence. But this is not an immediate and actionable sell signal. These divergences can persist for several weeks before they resolve themselves.
Earnings Season: What’s priced in?
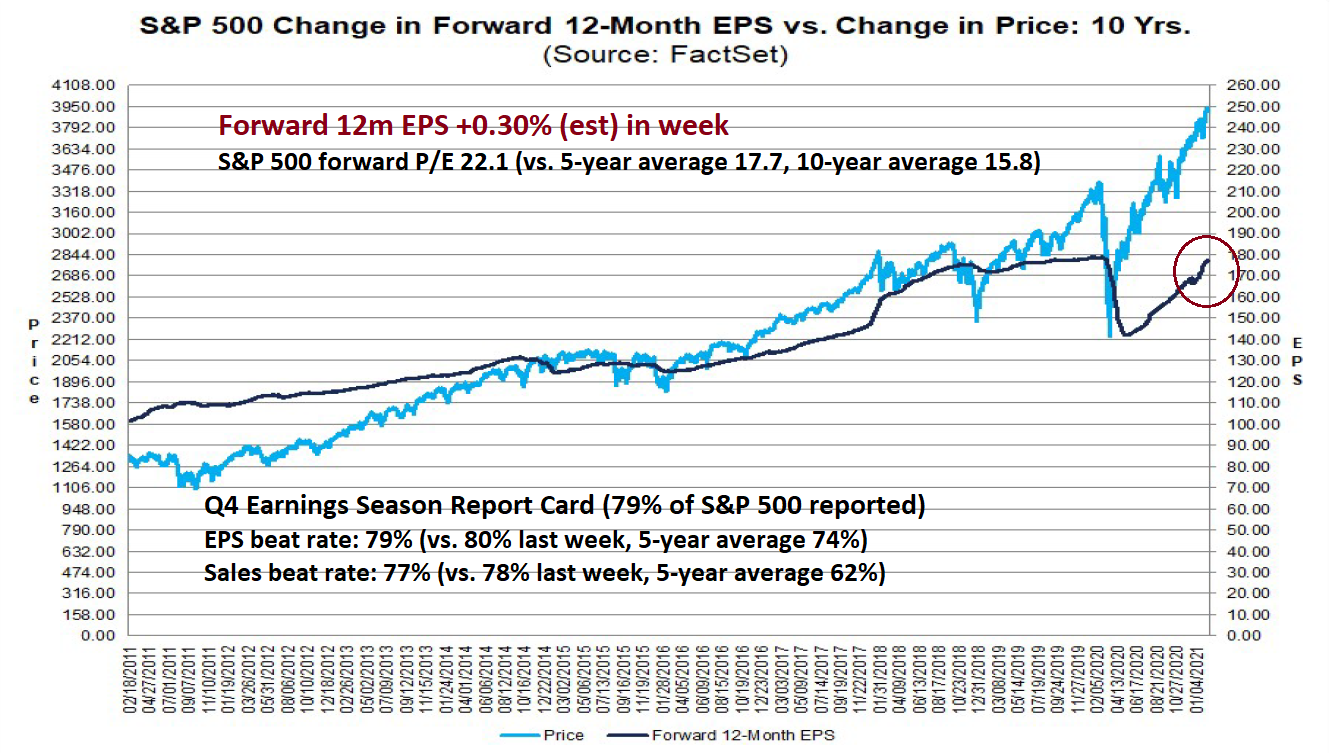
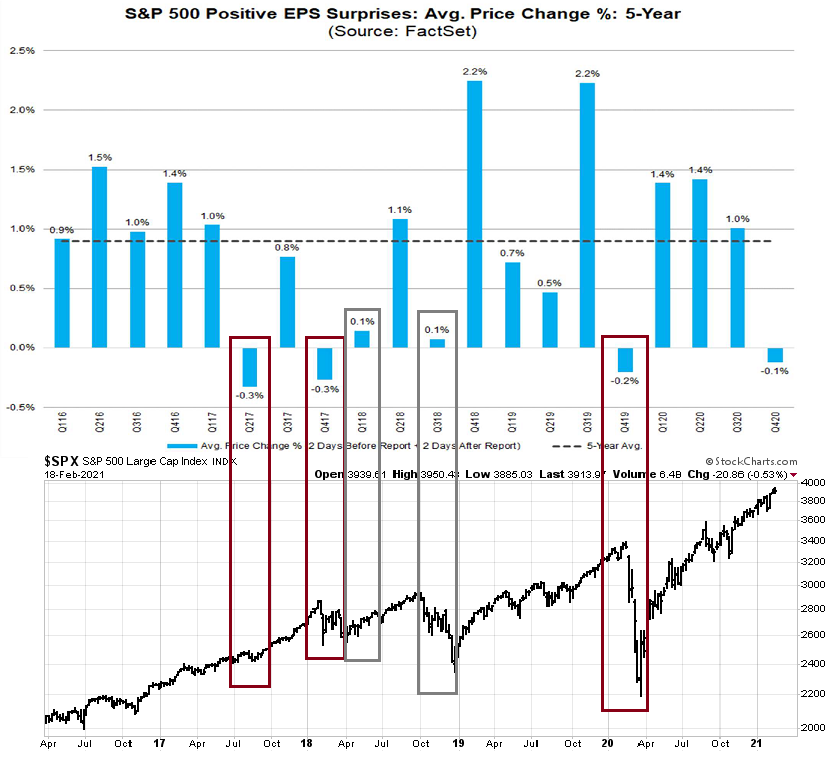
Another concern is the market’s reaction to Q4 earnings season. According to FactSet, 79% of the S&P 500 has reported, and both the EPS and sales beat rates are well above their historical averages. In response, analysts are revising their EPS estimates upwards. These developments should be equity bullish. As the historical record shows, earnings estimates have moved coincidentally with stock prices.
The disturbing development is the market response to positive earnings surprises. Stocks have not reacted well to earnings beats, which calls into question what the market has already priced in. In the past, the market either pull back or experience difficulty advancing under similar conditions.
The bull case
On the other hand, the bulls can make the case that the path of least resistance is up. Despite a combination of frothy sentiment and extreme positioning, market internals do not support the case for a pullback. Most technical indicators are confirming the signs of market strength.
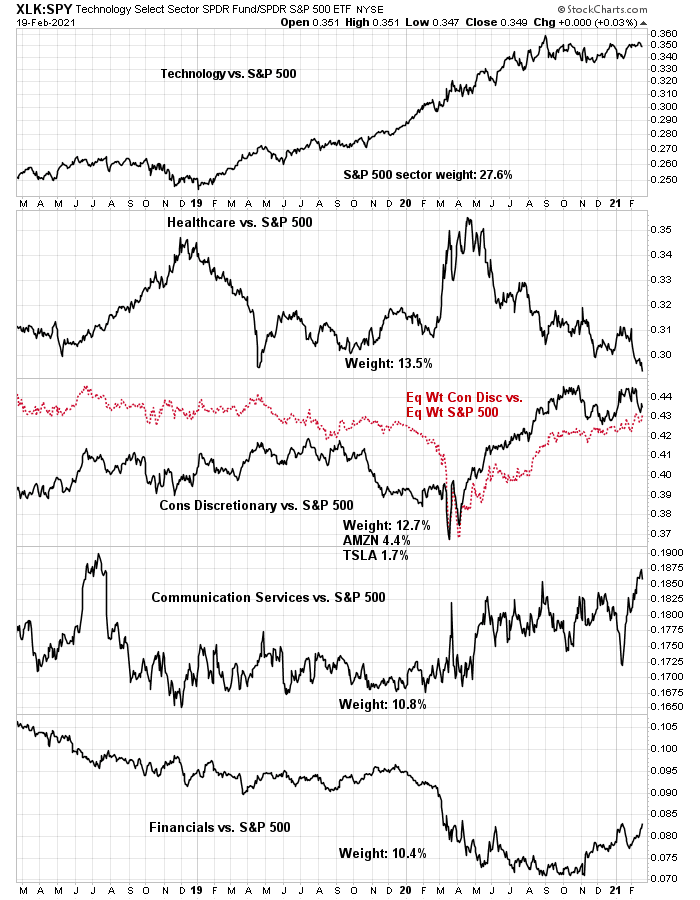
The relative performance of the top five sectors to the S&P 500 shows few signs of broad technical breakdowns. The top five sectors comprise 75% of index weight and it is impossible for the market to move up or down significantly without the participation of a majority.
Equity risk appetite, as measured by the ratio of high beta to low volatility stocks, and the equal-weighted ratio of consumer discretionary to consumer staples, is not showing any negative divergences.
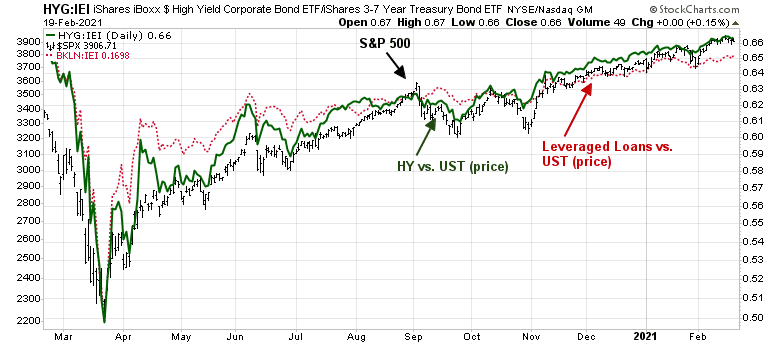
Credit market risk appetite is also not showing any bearish divergences either.
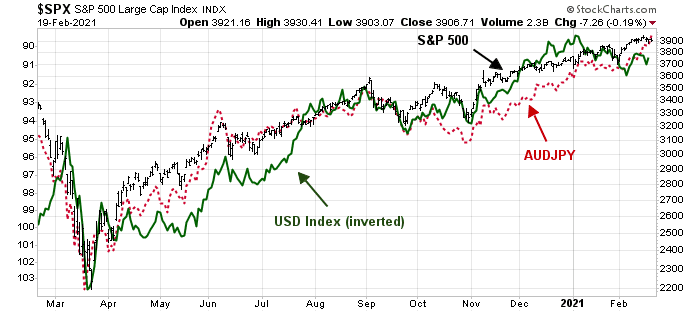
Foreign exchange (FX) risk appetite presents a mixed picture. The USD Index has been inversely correlated with the S&P 500 in the last year and it is flashing a minor warning. However, the AUDJPY exchange rate, which is a risk-on indicator, is flashing a bullish signal.
Waiting for the break
Tactically, the market can continue to grind upwards, but it can also break down and correct at any time. I pointed out in my last post (see No reasons to be bearish?) that significant downside breaks need a bearish trigger and story. Despite the presence of technical warnings, no bearish narrative has taken hold.
In the absence of a negative fundamental story that spooks the markets, the best the bears can hope for is a 3-5% pullback, but no sentiment reset. Market psychology has become so overdone that the healthiest scenario is a brief scare and correction to wash out the weak hands. So far, that hasn’t happened.
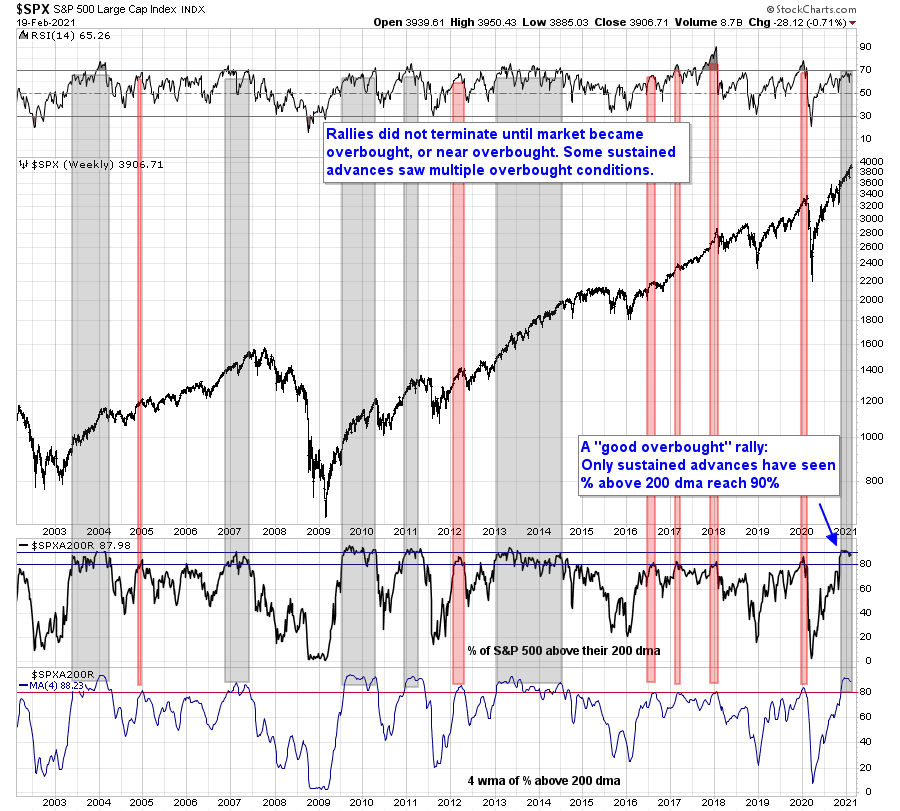
Looking to the longer-term, the big picture market structure favors a sustained advance. The percentage of S&P 500 stocks above the 200-day moving average recently exceeded 90%. This is the sign of a “good overbought” momentum advance that can last for months.
The market just needs a sentiment reset and correction for the bull trend to continue.


Let’s look at valuation from prices of SPY at three dates Market High Feb 2020 339, day before Vaccine Announcement Day after Biden win 350 and finally now 390.
From the previous high at 339 the market was up 3% the day before the Vaccine Announcement and about a week after Trump lost the POTUS Twitter account. Was that too high. I’d say no since we had Fed and Government inject a ton of dollars into the economy beyond anything ever seen before AND they commit themselves to zero short term interest rates for years. The Fed has established itself as a backstop for markets AND allowed risky borrowers to raise all the junk debt they want at previous quality debt yields. Plus these 500 companies will have less competition from private Main Street firms who have less access to the government giveaways.
From the day before the Vaccine announcement to now (350 to 390) the SPY is up 11%. Is that excessive? I’d say absolutely not. Back in the depths of the pandemic, we were expecting a vaccine that would be 60% effective, take a long time to get approved and be slow to produce using then current methods of making it (think billions of eggs and petri dishes). What we got was a 95% efficacy and a vaccine that can be mass produced on a manufacturing basis. It was incredibly better and coming incredibly sooner. I must say up 11% after the Vaccine Announcement is way too little.
So using those three dates, I don’t see a reason why one should be on the sidelines.
Another thing is the sentiment gauges that are off the charts bubble bullish. When the introduced zero commission stock and option trading, they changed investing for small investors completely. We have all likely traded options in the past and seen minimum commission rates eat up the trade. I basically stopped trading them or even doing covered writes. With zero commission, they now make sense and the newly added players due to this increases the liquidity to make it even better. So forget comparisons to the commission days. Granted, small previous sports bettors had no games to bet on last summer and they instead turned to online trading but this is a Covid phenomena not the type of speculative binge at the top of a four year bull market that precedes a bear. And I will bet that these guys are not buying options on JP Morgan.
Lastly, the Global Market Index ex-USA is outperforming the USA. They don’t have Robinhood amateurs to blame for high prices. They are investing based on global fundamentals that look fine to the trained eye.
They likely are reading news stories of American Robinhood day traders and rolling their eyes.
Behavioral economics talks about ‘anchoring’ where we make mistakes due to fixing on the wrong recent price. If we ‘anchor on the March Bear Market low of 218 on the SPY, the market is up 79%. In past normal bull markets, a 79% gain accompanied by signs of speculative excess would have you running for cover.
I prefer to step back and anchor on rational date of February 2020 that will be similar to the post-Covid economic world I see coming in the next year or two. I prefer to anchor on the Vaccine Announcement Day as the day that made the continuing government and Fed money printing wildly excessive and unnecessary that will boost future asset prices (stocks, houses and commodities) beyond whatever the future economic conditions would normally dictate.
Where is your anchor?
https://www.youtube.com/watch?v=ssbMrjqOCt0
I like Carter Worth’s technical analysis. He put this on 7-31-2020. It looks like gold has had that pull back, and we may be at or close to support here. To be sure, Cam had written about buying gold, in recent months as well.
For longer term buy and hold portfolios, a 10% pull back from an All tie high may be a reasonable entry point. Carter Worth’s inflation adjusted value of gold is 2700$ per oz!
https://www.youtube.com/watch?v=JhP0oSDTDQs
From May 2020.
I am a long term player and love looking at analysis in hind sight. More of the same on gold!
Gold and silver have been disappointing investments so far. It seems both institutional and retail investors have shifted their portfolio to bitcoins and other coins to hedge against inflation.
Can the precious metals do well in that scenario?
I think silver will outperform gold because of its industrial usage, esp green economy.
Well said Ken. I’m not as versed as yourself or Cam, which why I pay to read this, however my “gut” says we are going to trade sideways for a while and that will help to reset things for the upcoming sort of post Covid world. I say sort of because we are entering a phase where a good percentage of people have been vaccinated by summer and kids are back in school, which will feel awesome, but we’ll still be wearing masks and the effort will turn towards the next round of booster shots and vaccinating poorer countries to tamp down the variants. It will be longer than we expect to get back to February 2020 life, but things will improve a lot going into the summer. I think this sets up for economic improvement that is good but not explosive over the next couple of years. This is actually the best case, since the fed and government will continue to do the right thing by supporting those most impacted. Add in an infrastructure Bill (finally) and I think you set up a very good run of growth. So for now, while I might not buy more waiting for a correction, I will stash cash and be ready to deploy it.
Livewell, that is exactly the reality-based self-analysis that is so necessary. It what Cam offers to help us decide a personal path.
A run and gun and dip and dive approach eventually falls victim to our behavioral bias errors.
An interesting analysis by Marko Papic on this week’s “What Goes Up” podcast. He argues that a global regime change from austerity to worldwide “Abe-nomics” leads him to the conclusion: “All I know is that for the next two years, it’s like diamond hands and to the moon.”
https://www.bloomberg.com/news/audio/2021-02-19/death-of-austerity-podcast
Thanks jyIo87. That’s a great podcast.
The next step in Abe-nomicing the world is the EU changing its rules on maximum sovereign debt to GNP Maastricht rules which are 60% now. That’s extreme austerity in today’s world when it seemed high in the old rational world when they formed the union.
To get a post-Covid deficit spending boost, they have to lift the lid. Expect European stocks to soar if rumors of that happening start. A matter of time.
I agree with Ken re the need to decide on potential anchor dates. One reason I view Ciovacco Capital’s weekly videos. There are a number of reasons to think that the many singular breadth thrusts in 2020 will mark (in hindsight, as always) the beginning of a new secular bull. 1982, 2003, 2009, and 2016 come up time and time again as periods where similar rates of change were seen in different markers of investor behavior. Sure, it may all turn out to be irrelevant. But we all know that patterns based on human nature tend to reliably recur over time.
I don’t think many investors believe that a secular bull began in 2020.
I wasn’t involved in the capital markets in 1982, but I have vivid recollections of 2003, 2009, and 2016.
1. I was slow to embrace the beginning of the 2003, but given the Bob Brinker broadcast that led to my wife and I exiting the market in May of 2000 – neither did I have any problem transitioning back to a fully-invested portfolio within a year of the lows.
2. My most unforgettable moment in trading occurred in March of 2009. After months of trading in/out during the worst bear market I’ve experienced (basically, trying to time long entries into potential bounces), I decided it wasn’t worth the aggravation and completely cashed out on March 9 – I had given back quite a bit. Early in the morning of March 10, I woke to the realization of what had happened – the closest experience I’ve had to an ‘epiphany’ in trading. Beginning in the premarket session on March 10, I began scaling into QLD and came close to being ‘all in’ by the close. I believe I held that position for quite some time (unusual as I’m normally averse to leveraged funds) – and was back to new highs by late summer/early fall. I wish I had taken the time to download all of my comments on the old Bill Cara blog, as my entire bear market journey was chronicled on a daily basis. It was a brutal grind for just about everyone, and I dug deep every week for optimistic perspectives.
3. What I learned in 2008/90 was invaluable when the even greater bear in emerging markets hit in 2015/16. I was able to time an entry near the point of despair, which resulted in two of my best years – capped appropriately with visits to Hong Kong and Taipei in the summer of 2017, where booming markets in real estate and tourism were evident.
How does 2020/21 fit in? I think the speed with which the bear unfolded last March makes it more difficult to accept as the reset which will launch a multiyear bull. But I think we’ll all look back on 2020 and realize that a global shutdown (with or without the unprecedented support of central banks that followed) represented the worst scenario we’re likely to see in my lifetime.
https://www.gobankingrates.com/investing/stocks/bank-america-issues-warning-potential-stock-market-bubble/?utm_campaign=1051874&utm_source=yahoo.com&utm_content=12
http://scottgrannis.blogspot.com
https://www.institutionalinvestor.com/article/b1qd5szwghvm32/The-Dominant-Dollar-s-Long-Term-Status-is-Set-to-Wane
Start hedging the $ itself, is the message above. Gold, unhedged overseas ETFs (Ken has been pounding the table on this), commodity investments should provide hedges, against a weakening $.
https://www.latimes.com/california/story/2021-02-20/covid-19-pandemic-herd-immunity-vaccinations-plummeting-cases
Eleven months ago a headline like the one above was probably unimaginable. Except to Mr. Market, who saw it coming and began a phenomenal move to the upside unmatched outside two previous occurrences in recent history.
To some, unimaginable two months ago – in the face of all common sense.
https://thehill.com/policy/international/europe/531732-fauci-biden-is-right-that-worst-of-covid-pandemic-yet-to-come
It’s worth reviewing Macro Charts recent ‘Everyone is NOT long the markets’ series of tweets. Also, note the tweet about options volume/ratios today, as compared to the 90’s.
https://twitter.com/MacroCharts
A shakeout is underway.
Most positions (re)opened on Friday are holding up well. The biggest surprise perhaps the continued upside in XLE despite having reopened near Friday’s high.
QS/ PLTR doing well. Adding a second tranche to NIO on weakness.
Adding a second tranche to VTV.
Adding positions in ASHR and EWZ.
Reopening a position in QQQ.
Now green for the day.
Nod to Cam re XLE. Being able to buy on strength is a major change in character for this sector.
Will be adding a second tranche to VTIAX/ VTSAX/ VTRIX/ VVIAX/ VEMAX end of day. Three on weakness, two on strength.
A double shakeout.
It’s not going to feel good while it’s happening, but it gets the job done.