Mid-week market update: The fever on the r/WSB squeeze has broken. As well, the elevated nature of sentiment readings has begun to normalize. Does that mean the correction is over?
In the past few days, I have had an unusual number of people ask me that question. My answer has been, “In the words of technical analyst Walter Deemer, when it comes time to buy, you won’t want to.”
Do you still want to buy?
Bullishness in retreat
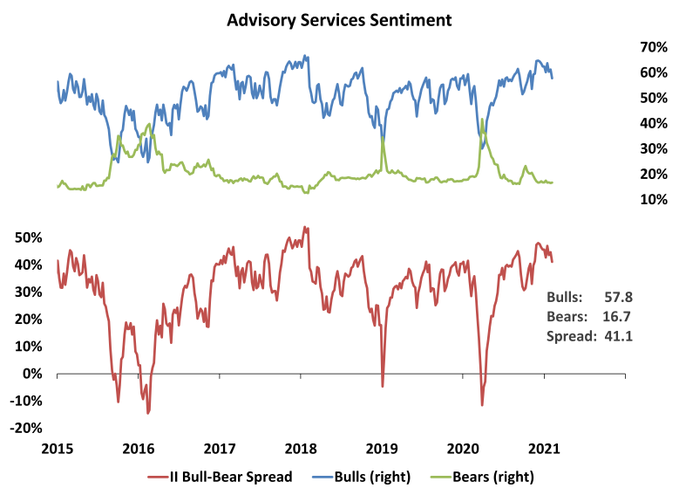
To be sure, sentiment readings have come off the boil. Callum Thomas conducts a weekly (unscientific) poll on Twitter every weekend. His latest readings show that sentiment has swung net bearish after several weeks of elevated bullish readings. Similar past episodes of bearish sentiment after prolonged high bullishness have resolved either in either choppy downward action or further corrective action (warning, n=2).

Correlation isn’t causation, but…
There are other disturbing signs that the pullback isn’t over. I know that correlation isn’t causation and correlations can break apart in unexpected ways, but the USD has been strengthening this week even as the stock market rallied. The S&P 500 has been inversely correlated with the USD Index for the last year, and we are starting to see signs of a negative divergence.
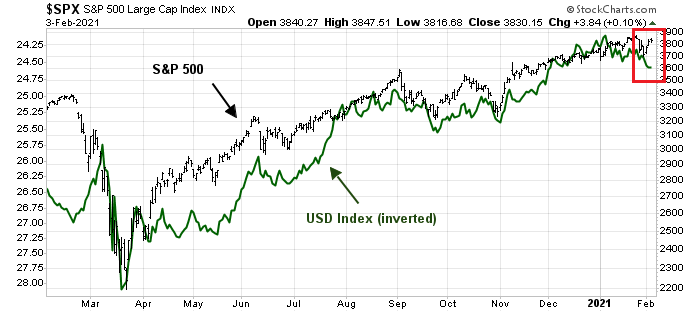
From a technical perspective, the USD Index rallied through a falling trend line and it is poised to strengthen further.

Investors remain in a crowded short position in the USD. This is a setup for further greenback strength.

Take a look at the growth differential between the US and the two core eurozone coutnries. The gap could widen further until the EU Recovery Fund really kicks in. This will put downward pressure on EUR and upward pressure on USD.

Correlation isn’t causation, but this is a negative divergence to be worried about.
Technical warnings
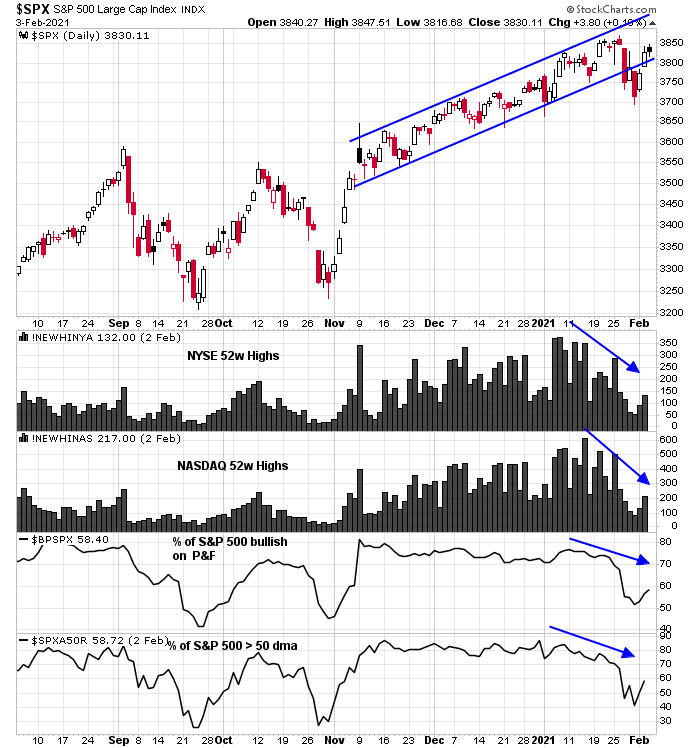
In addition, market internals is still weak. Even as the S&P 500 rallied back through the rising trend channel, breadth indicators are not confirming the index’s strength.
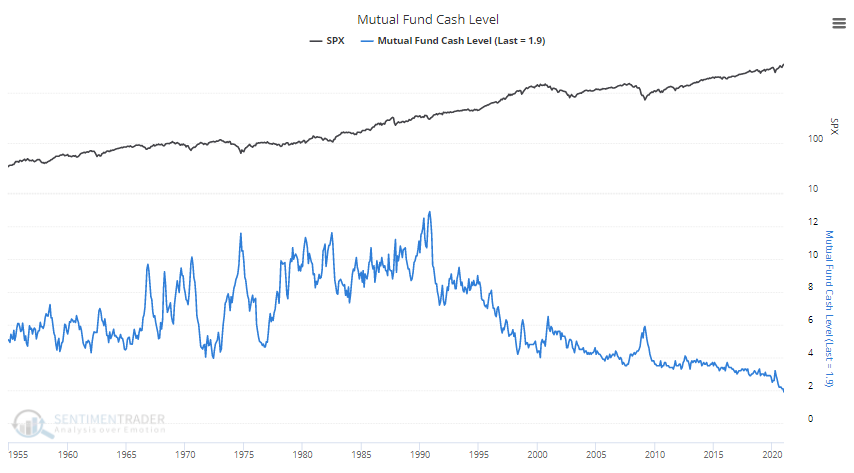
SentimenTrader pointed out that portfolio cash levels are low. Mutual fund cash is at historically low levels.
So is pension fund cash.

The Fed has flooded the financial system with liquidity as M2 money supply has skyrocketed along with the savings rate. That analysis has led some analysts to conclude that there is cash on the sidelines waiting to be deployed. However, the low levels of mutual fund and pension fund cash leads to the interpretation that the “cash on the sidelines” are precautionary savings rather than funds available for investment.

Choppiness ahead
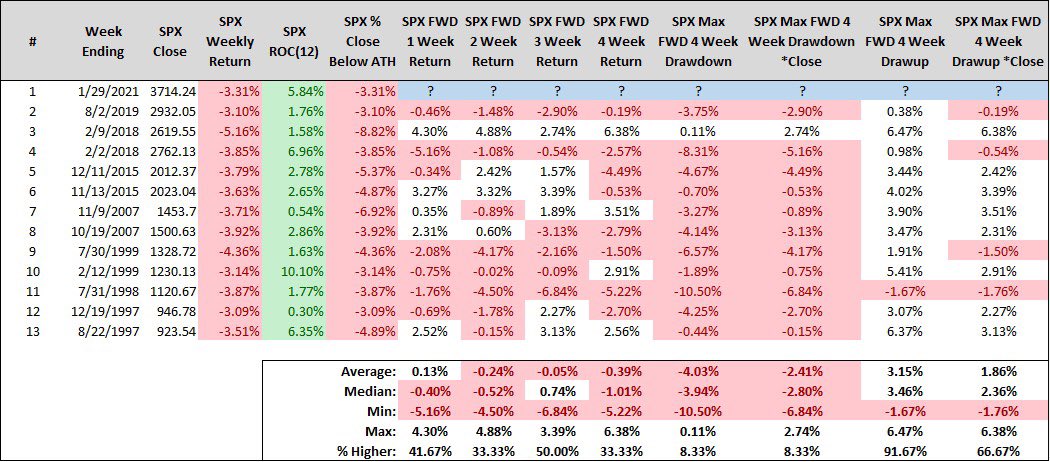
My base case scenario calls for more flat to down choppiness. Steve Deppe found that when “the S&P 500 falling -3% or more during an uptrend (i.e., positive returns over the trailing 12 weeks) that closes within -10% of our all-time high weekly close”, the market tends to be volatile, with a bearish bias.
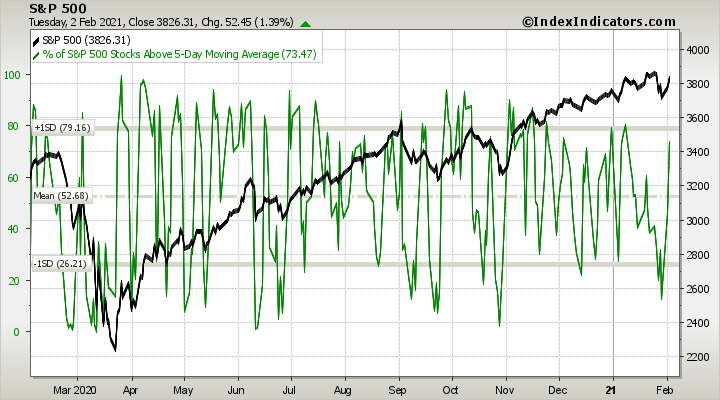
As of the close last night (Tuesday), the % of S&P 500 above their 5 dma had reached a near overbought condition. The reflex rally that began Monday is fizzling out.
Keep an eye on the market’s reaction to Friday’s NFP report as a way of gauging the market’s psychology. The report is likely to print a strong positive surprise owing to the vagaries of seasonal adjustment. Labor economist Diane Swonk pointed out that the economy has “lost an average of 2.9 million jobs every January” from retail, restaurants and professional services like couriers and messengers. This year, the scale of the layoffs will be far less because of the pandemic, which leads to a strong positive seasonal adjustment. How will the market react to this probable “good” news?
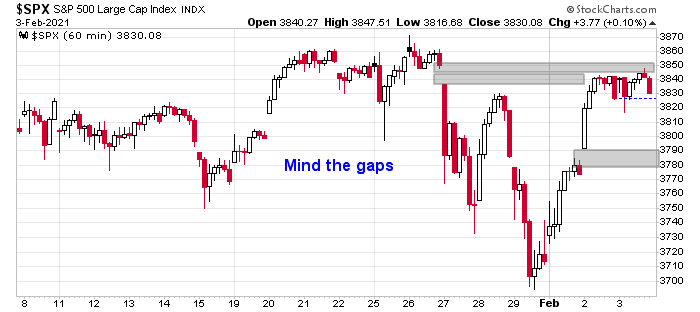
The S&P 500 hourly chart shows two gaps. One above with the top at about 3850, and one below at 3780-3790. My inner trader remains short and he has put a stop just above 3850.
My inner investor is bullishly positioned, but he has mitigated the short-term risk by selling covered calls against some long positions.
Disclosure: Long SPXU
I am a broken record when I keep saying that Value and Growth are acting so differently and should be viewed and analyzed separately. The massive difference in performance in the last three years went too far and now they have lost their correlation.
Correction to the end of January was a Beta Crash similar to the Beta Crash in January 2018 where high beta stocks were very overbought and corrected. Cam highlighted this on the weekend.
A correction of this type does not see signs of economic stress in the stocks that are falling. When it happened in January 2018, it was right after the tax cuts that would boost earnings for example. At that time, high beta was Growth. A Beta Crash just has the hot stocks cooling out. In the current case, it saw some of the newly popular high beta Value names pulling back in their first correction since the new Value bull market started November 9 Vaccine Day. You saw Growth outperform for the first time in a while as this unfolded.
A Beta Crash is short and its depth relates to the previous speculative frenzy. The Value beta surge was not too extreme and hence the current beta crash is likely over. BTW I do not thing the Gamestop phenomena means there is a general market mania. It is a sideshow and is giving the public a feeling that markets are crazy.
A deep correction or the beginning of a bear market involves signs of economic stress during a correction. The internal Factor work I do on the industry and country sectors did not show that at all. For example, the economically sensitive portion of industries such as Financials, Materials, Industrials and Energy were only falling the same as what I name the Sturdy portion. If we were seeing economic stress, there would be a big difference with the economically Vulnerables falling more like they did in March.
So what have we seen in the last couple of days as the Value beta crash ended? The Value stocks are soaring. Today with the market flat and QQQ down 0.4%, the Bank ETF is up 1.9%. Energy up over 4%, Alcoa up 4%, Denny’s up 4% and Weyerhaeuser up 5% etc etc. This is not a correlated market.
Don’t get me wrong, it is putting huge pressure on me to stay the course. A few weeks ago, when all the technical signs that I’ve used successfully said the market would correct said I should sell Value winners, it was very difficult to resist the urge especially when the stocks started to crater. But then Chairman Powell came out and pounded the table saying there would be a continuing fire hose of liquidity and low interest rates for years. That made me grow a spine. If you haven’t read his press conference prepared text, do read it and whenever you worry about the economy or this insane amount of stimulus not working or ending, read it again. This is totally unprecedented as in it has never happened before.
Then you have the Federal government sending big checks out to people that didn’t lose their jobs to the extent that the total incomes of the labor force went up more that if there was no pandemic. The growth rate of incomes was in the top five years of the last fifty. They sent so much money out when people couldn’t spend it that the savings rate is at an historical high. That too is unprecedented. And now Treasury Secretary Yellen (a previous Fed Chair) says the Fed and the Government are now going to work together to fix the economy. It’s like she is saying the previous policies were just not enough.
So when I see a deep analysis of the U.S. dollar using all the previous (pre-Covid) successful insights, I am extremely skeptical. When I see past economic gurus analyze the outlook for inflation or the valuation of the stock market or its technical patterns, I am very skeptical that they have fully realized how truly weird the Fed and government deficits are throwing gasoline on the fire.
Do people really want to be holding paper dollars as this is unfolding?
Good companies whose businesses are down now because of the pandemic will CERTAINLY be doing better next year and the years after. These are the Value stocks whose profits are down now making their PE valuation look high. Their business will be back. In contrast, how many trillions of US dollars are going to be printed between now and then?
Sorry for the long rant. The last couple of weeks have been stressful to maintain this viewpoint when things were iffy. What you are reading is a sigh of relief. This is uncharted waters and nothing is certain. I try to be reality based and the reality of the Central Bankers and government action is very …… (pick a word)
It will be clear in hindsight.
Excellent insights.. thanks Ken!
Ken, thanks for bringing us back to the fiscal and monetary realities.
I think the upward pull of these policies is so strong, it’s not worth playing a few percent correction in the market. You are likely to be buying back at higher prices that the prices you sold at. This is assuming one can even catch the top and bottom of these minor corrections.
A strong USD may be bad for the growth businesses in S&P500 but the US-domestic small- and mid-size businesses will do just fine in a strong USD environment.
Basically I concur with Ken´s analysis. My concern are the effects in 10 years or so. In the end the value of stocks are expected to be based on cash flows discounted by an interest rate. What are our options? Emerging markets? Value stocks? other non monetary assets? for how long is this interest rate sustainable? I expect that at some point of time people in the US realize that official measures of inflation are understated. This could lead an exodus to non monetary assets.
Alexander, you are totally correct. In ten years they will write about the folly and damage of these obviously wrong economic policies. A brilliant new Keynes will expose the folly of current economic theory as they try to clean up the mess these Central Bankers will have wrought.
Setting aside labels on the stocks (value, growth), what matters fundamentally is earnings and cash flows generated by an enterprise, the growth of that stream of cash flows, and the discount rate. Growing, strong enterprises have significant advantages. Competitive moats, attractive cost of capital, and less volatility of cash flows. So, growing companies will always command a premium.
Think of JPMorgan. The premier financial institution in the world. Organic growth is constrained. Earnings growth is partially coming from cost rationalization which has limited scope. Would it be better to own asset light, rapidly scalable and digital businesses focused on where consumers are going? Think of PayPal, Square, Visa, MasterCard and many others in the space.
The demand will surge in contact services area of the economy but once it returns to mostly prepandemic levels, will growth continue?
World has changed drastically in last twelve months. What emerges on the other end will not be what we had in 2019. At least in US, it is a digital world and a divide.
Value could be a profitable trade, if one can time it well.
Rather than a generalised name like Value, I should be saying ‘economically sensitive ‘ companies. Cheap stocks that have a bad business model I would avoid. A growing company that can have a dip in profits during a recession is a buy today.
We are on the same page. I do agree with business cycle phenomenon and sectors that do well in early, mid, and late cycle. In each, focus should be on companies that have a durable competitive advantage and franchise.
As Cam has pointed out several times, Fed can’t help the zombies. I therefore feel a stock picking approach is critical than buying an ‘index’.
Some companies are worth more dead than alive. Don’t think just about the value of firms just as an operating entity.
I made good money bottom fishing those kinds of companies early in my career.
Cam–perhaps you can create the Zombie ETf: ZMB
As soon as a company looks as if it no longer among the waking dead it get sold out of the fund.
I don’t see SPX 4000 in the headlines – yet. If we breach 3900 this Friday, those headlines will hit next week.
Nice continuation moves in QS/ PLTR/ BABA.
I may be adding to QS, as it appears to have established support in the 40s and may be ready to reverse.
JETS trended higher all day on Wednesday. After two months of chopping around it may be ready to lift.
Personally, we’re starting to discuss travel plans for this summer.
Added to QS ~48.50.
Financials catching a bid.
UAVS lift-off.
At SPX 386x, why wouldn’t the bulls run it past 3871 tomorrow for a new all-time high? JMHO.
Gap that Cam mentioned is filled. What now?
Just announced! ARK ‘swag’.
https://ark-invest.store/
Not sure if I hear a bell ringing, or it’s just my tinnitus.
What’s the pain trade here? Probably a near-term melt-up.
SPX 3900 just feels like a done deal, jobs report be damned – whether it’s better or worse than expected, it will be an excuse to drive the index higher.
Profit-taking kicks in during the first hour. That’s to be expected after a fantastic week, and not a problem. I plan to add to an existing position in RYSPX at the 730 window.
That 730 window works like a charm. The SPX bounced right off the 730 print (or thereabouts).
Trimming back on PLTR.
Closing PLTR for now.
Closing positions in VTV/ EFV.
Closing positions VTI/ VEU.
Closing positions in XLF/ KRE.
Closing positions in XLI/ PAVE.
Closing positions in EEM/ FXI/ ASHR/ BABA.
Taking a loss in GDX.
Closing positions in QS/ UAVS/ SOL (should have been happy with good gains in both yesterday – instead I’m exiting basically flat on all three). However, it’s the action of these three that now have me leaning BEARISH. That’s often how it works when it comes to my takes – the small positions can act as canaries in the mine.
Closing JETS.
The plan right now is to close all index funds end of day->VTIAX/ RYSPX/ VEMAX. (The smaller position in RYSPX opened this morning will be effectively closed by opening an equivalent position in the Rydex Inverse SPX fund.)
From a longer-term perspective, this week’s action was bullish.
From a shorter-term perspective, we’re likely to see a backtest of the week’s lows.
Heading into the close, I see no reason to change my plans.
VTIAX/ RYSPX/ VEMAX will all be closed end of day.
Back to 100% cash.
~+3.24% ytd. Would have done better had position sizes been larger, but it’s a decent 5-wk gain.