Preface: Explaining our market timing models
We maintain several market timing models, each with differing time horizons. The “Ultimate Market Timing Model” is a long-term market timing model based on the research outlined in our post, Building the ultimate market timing model. This model tends to generate only a handful of signals each decade.
The Trend Asset Allocation Model is an asset allocation model that applies trend following principles based on the inputs of global stock and commodity price. This model has a shorter time horizon and tends to turn over about 4-6 times a year. In essence, it seeks to answer the question, “Is the trend in the global economy expansion (bullish) or contraction (bearish)?”
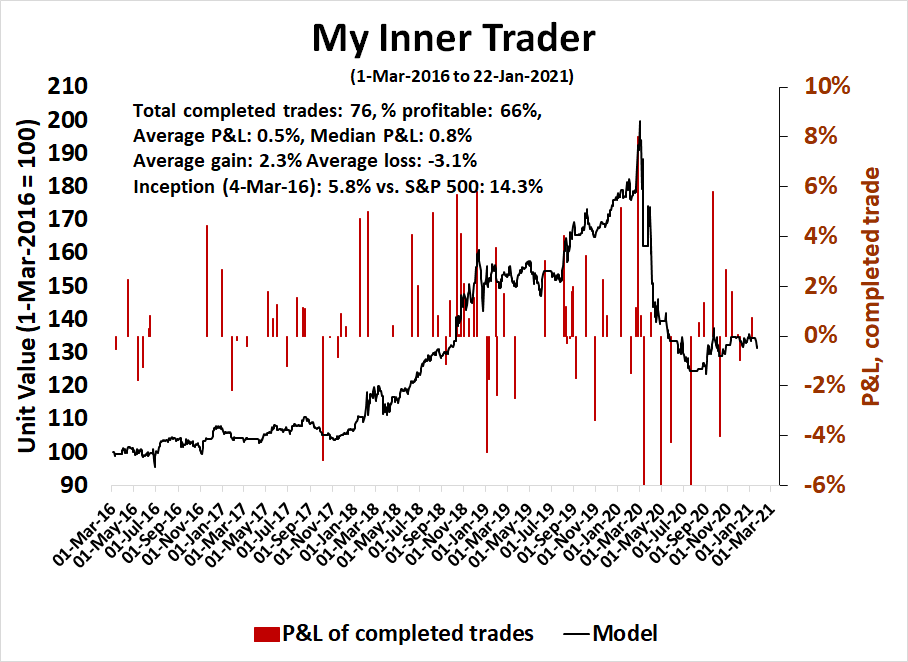
My inner trader uses a trading model, which is a blend of price momentum (is the Trend Model becoming more bullish, or bearish?) and overbought/oversold extremes (don’t buy if the trend is overbought, and vice versa). Subscribers receive real-time alerts of model changes, and a hypothetical trading record of the email alerts are updated weekly
here. The hypothetical trading record of the trading model of the real-time alerts that began in March 2016 is shown below.
The latest signals of each model are as follows:
- Ultimate market timing model: Buy equities
- Trend Model signal: Bullish
- Trading model: Bearish
Update schedule: I generally update model readings on my site on weekends and tweet mid-week observations at @humblestudent. Subscribers receive real-time alerts of trading model changes, and a hypothetical trading record of those email alerts is shown here.
Subscribers can access the latest signal in real-time here.
An exception to the rule?
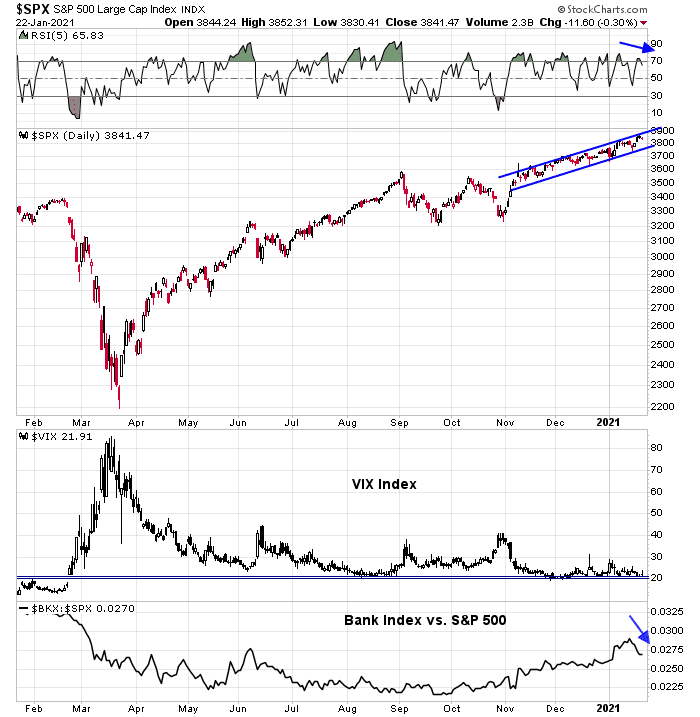
The S&P 500 rallied to a fresh all-time high last week. While it is said that there is nothing more bullish than a market making new highs, this may be an exception to that rule, especially when there were more declines than advances on the day of a new high.
The S&P 500 kissed the top of a rising channel while exhibiting a negative 5-day RSI divergence. In addition, the VIX Index, which tends to be inversely correlated to stock prices, is testing a key support level at 20-21. More worrisome is the behavior of financial stocks. Large-cap banks reported last week and most beat expectations, but the entire sector is lagging the market.
More signs of froth
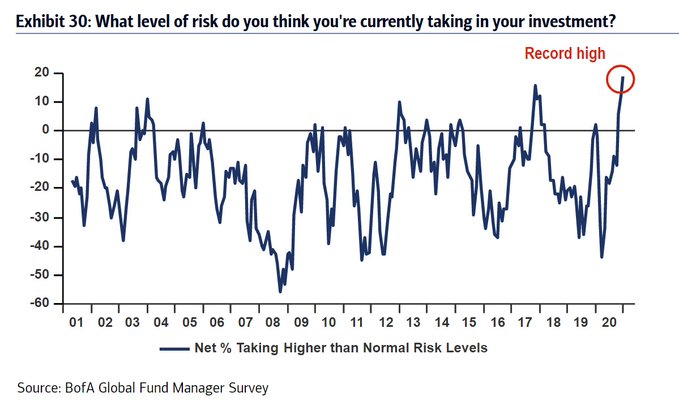
Sentiment readings have been extended since last 2020. The latest data point from NAAIM, which measures RIA sentiment, reached a record high of 113. While sentiment models are less useful at tops than bottoms (shaded areas), the last time the NAAIM Exposure Index neared these levels was the melt-up of late 2017 and early 2018.
These sentiment readings are consistent with the BoA Fund Manager Survey, which showed risk appetite at record levels.
As well, the
Globe and Mail reported that BoA strategist Savita Subramanian observed that their “Sell Side Indicator”, which measures the risk appetite of Street strategists, is nearing a sell signal.
Sentiment has been getting more euphoric, as our Sell Side Indicator – a contrarian sentiment model – is at the closest level to the “Sell” threshold since the financial crisis.
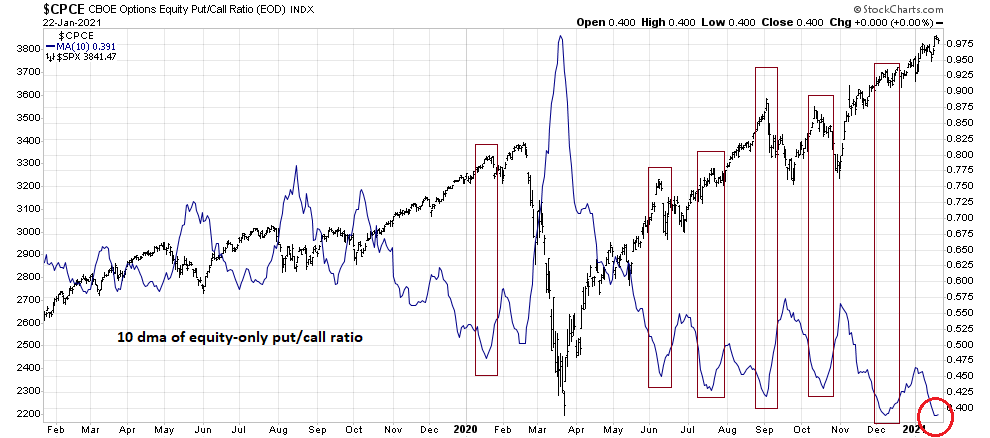
The 10-day moving average of the equity-only put/call ratio is nearing its lows again, indicating excessively bullishness. At a minimum, recent low reading episodes have resolved themselves in pullbacks.
Earnings season
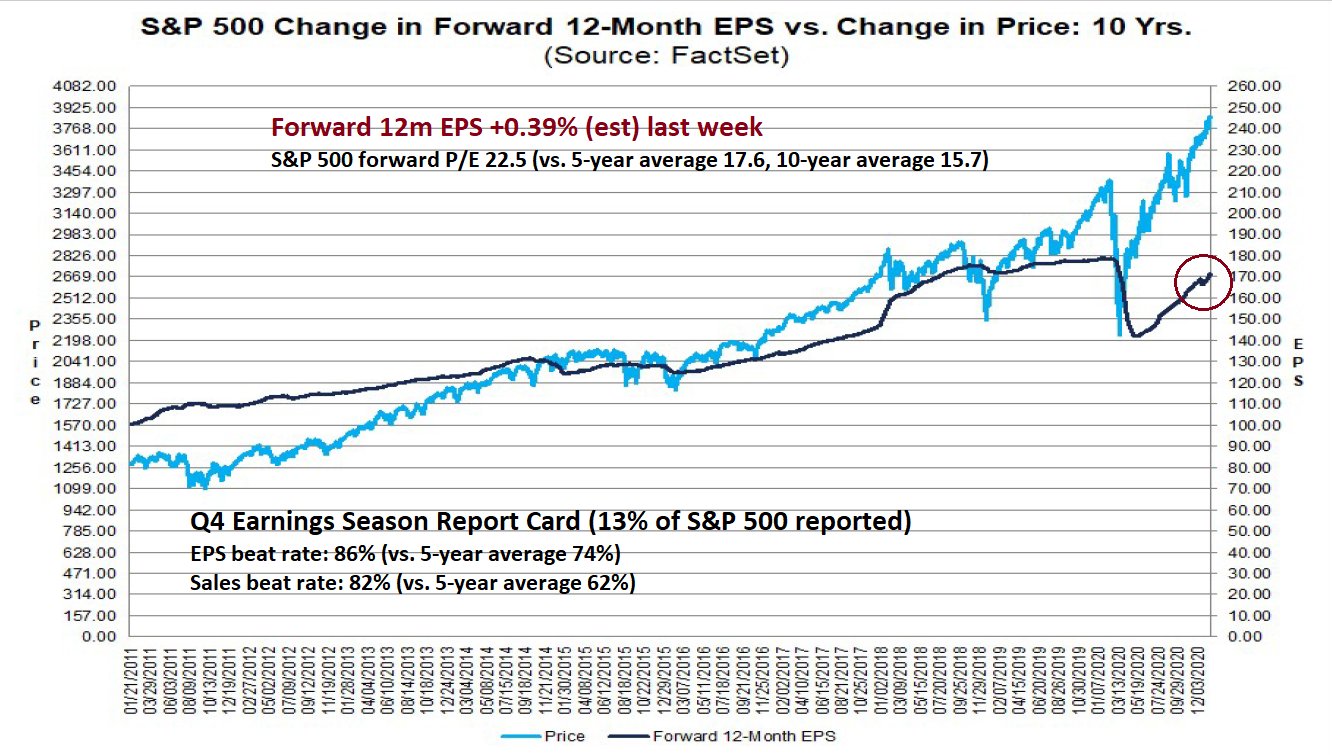
One of the bright spots for the market bulls could be Q4 earnings season. FactSet reported the good news: Both EPS and sales beats are strong and above historical norms. Company analysts are revising their EPS estimates upwards, which should be a sign of strong fundamental momentum and bullish.
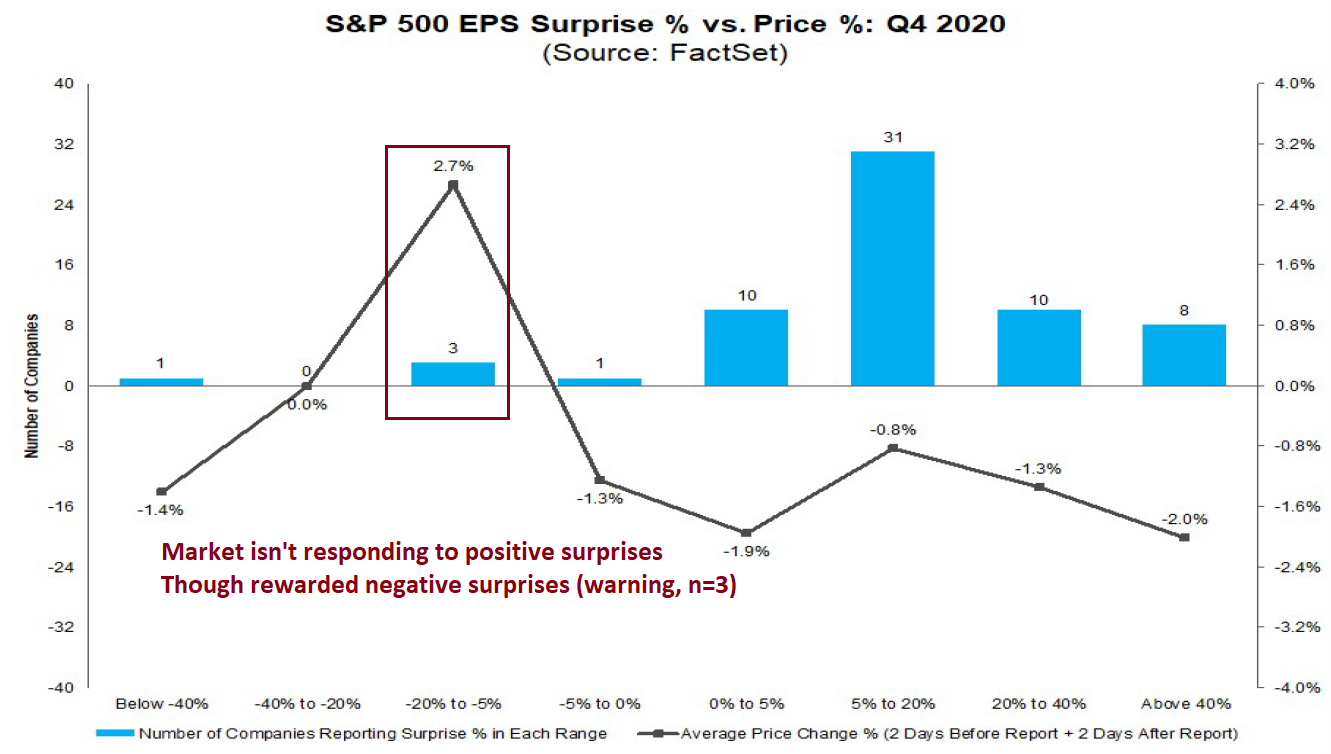
However, the market isn’t responding to good news in the form of earnings beats. FactSet also reported that the market is punishing positive earnings reports, and rewarding negative ones. However, the conclusion of rewarding earnings misses is based on highly preliminary data, and a very small sample size (n=3). I interpret these conditions as the market not rewarding earnings beats, rather than punishing beats and rewarding misses.
Where is the leadership?
The analysis of market leadership is also flashing warning signs. To be sure, the S&P 500 has been led by large-cap growth stocks. The NASDAQ 100 has led the market upwards, though the NDX to SPX ratio violated a rising relative trend line in early November. The latest relative upswing only represents a sideways consolidation within a range.
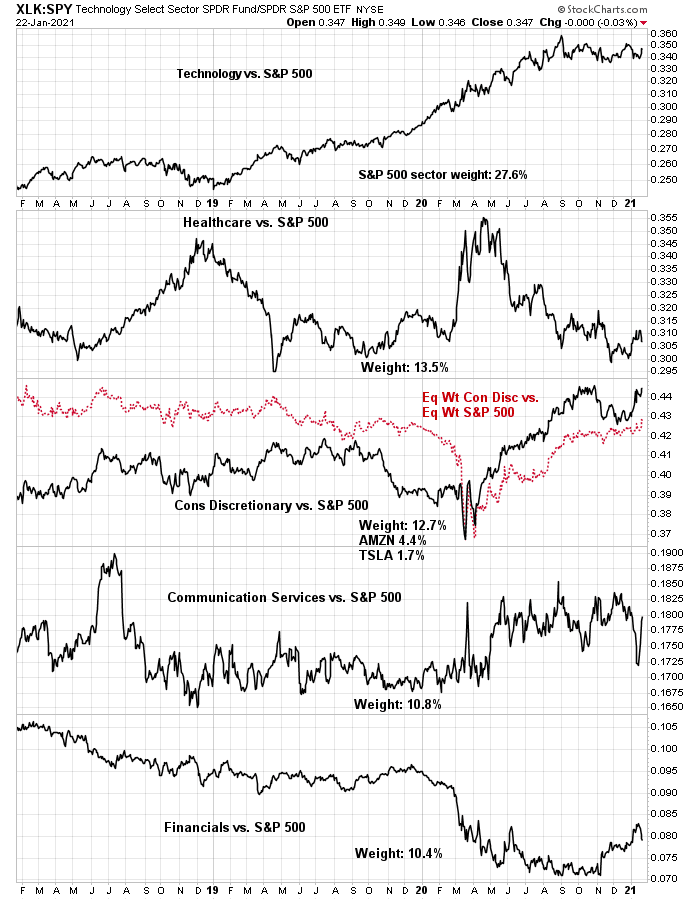
A more detailed look at the relative performance of the top five sectors is more worrisome. These sectors represent 75% of S&P 500 index weight, and it’s virtually impossible for the index to rise sustainably without the participation of a majority of these sectors. The only signs of relative strength come from float-weighted consumer discretionary (AMZN and TSLA) and communications services. None of the other sectors are exhibiting signs consistent strong relative strength. Put simply, the market is being led upwards by a handful of Big Tech stocks.

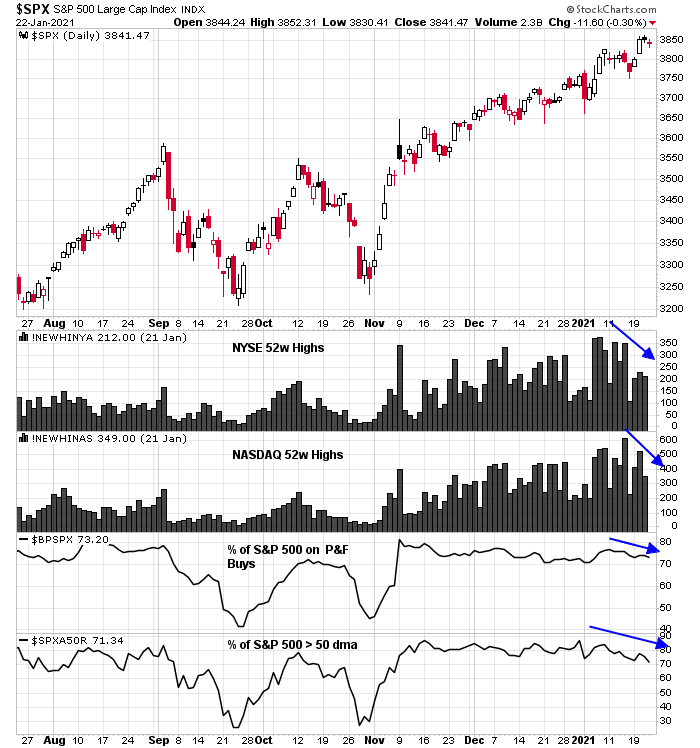
The narrow leadership is also evident in the analysis of market breadth. Even as the S&P 500 reached fresh highs, indicators such as NYSE and NASDAQ new highs, the % of stocks with point and figure buys, and the percentage of stocks above their 50-day moving average are all making patterns of lower highs and lower lows. As we progress through earnings season, the narrowness of the leadership poses a grave stock specific risk to the major indices. Any disappointment has the potential to open the door to a sell-off.
In conclusion, the market is undergoing a melt-up and a setback can happen at any time. At worse, the market is vulnerable to a violent air pocket of unknown magnitude. Remember Bob Farrell`s Rule #7: “Markets are strongest when they are broad and weakest when they narrow to a handful of blue-chip names.”
Brace for volatility in the coming week from individual earning season results and the FOMC meeting.
Disclosure: Long SPXU


This seems like a setup for a decent correction, however, corrections require catalysts, not just a technical set up. Where is the catalyst?
The new UK COVID variant could be the catalyst. It is 70% more contagious.
From “Ingjiunn”, yesterday:
“One other very important factor is a phrase coined by Josh Brown: relentless bid. Did you see it play out in real time since last Feb? Market participant behaviors are forever different now. This is a reflection of our fundamentally changed society. Everything is a concept and every value is an opinion”.
Have we, on this group, come to believe that this time IS different? Really? Perhaps. With MMT, things could well be different this time!
“Relentless bid” from the central banks! I wait for 50 Trillion from US central bank. Till then, party on.
https://www.yahoo.com/finance/news/money-supply-26-inflation-coming-043054524.html
Jeremy Grantham’s warning is rather ominous
Isn’t, even a Broken clock right twice a day?
Time, which a broken clock doesn’t stop, will tell.
Agreed Allan,
Time will tell. However, if someone keeps staying bearish, the market will in one time or another provide some basis for it, with a 10-15% correction. So, is the clock telling the right time or not, is based upon the time that the broken clock is showing. If you happen to catch it at exactly 1:30a.m., well, it was right at that time.
We (US, investors/traders) need time frames in order to manage investments, an open ended duration is not indicative of prediction, it’s a built in possibility of the markets. Also market seasonality is usually negative this time of year, anyway.
As I pointed out before, the primary trend is up.
Hence, the usefulness of short-term timing strategies are limited. More money has been lost in trying to avoid short-term drawdowns than a simple buy-and-hold strategy.
The odds are stacked against market timers in such an environment.
Markets correct every year and unexpectedly. There is no lack of monetary and fiscal stimulus as far as the eye can see. Traditional indicators have been and continue to tell the market that it’s about time but to no avail. Greed (relentless bid) is rampant. So, what is one to do? Cam suggests that Trend is bullish but there is likely to be a hiccup.
I think that higher we go from here, the harder the fall. Paper profits are just that – paper profits that can evaporate quickly. We are derisking, booking profits , getting ready to invest when there is a correction. Using options as a stock replacement strategy to participate in further upside but limiting the downside. Risk management in the portfolio is critical to long term success.
Ravindra,
If you don’t mind me asking, Where would you de-risk? Growth to Value? Or all investments, i.e. Large cap, small cap, growth, value. Going to Cash, is that what you are suggesting?
Just curious. In the Past you have been more Growth oriented and willing to stay in the game.
The distinction between value and growth is artificial, in my opinion. So, we do not choose investments with that criteria in mind. I use VZ as an example. I think of it’s role in the portfolio. Solid dividend with some growth for a total return potential of 10-15% which let’s you sleep at night. Consider Emerging Markets. Economic cycle up with valuations that are attractive. I think of it as Growth. Then technologies that are disruptive and attracting policy and investment support. Renewable and Clean Energy come to mind. Relatively high valuations but a path to grow into them.
Derisking – reducing selectively in higher risk bets. High yield debt, selective stop loss at multiple levels. Rebalancing. Stock Replacement option plays. USMV for lower portfolio volatility. A number of steps.
For us, Covid risk has not gone away. It might take longer than market assumes. Biden alluded to it as well. Political divide is a risk. And what we don’t know is the biggest tail risk.
Somewhat rambling answer but overall direction is to prepare for about 8-10 % correction.
Ravindra,
Thank you for your explanation. Appreciate it.
Watch out for a different strategy being employed at companies that are cash rich. Some have been using this cash to buy bitcoin and are seeing their stock prices explode upward.
They are showing this to be a far superior strategy to using the money to buy back shares. Two who have done this are Microstrategy and Square.
Usually, this process takes months as charters have to be amended to allow the purchase of bitcoin. We are very early in this trend.
This Ciovacco video is worth the 30 minutes.
https://www.ccmmarketmodel.com/short-takes/stocks-change-in-character
I do take issue with his characterization of the long bond as vastly underperforming stocks 1980-2000. He doesn’t include interest, so his 95% number (face value only) is off by multiples.
I think in the current environment where legacy and emergent rules are intertwined that we should have a revamp of thought process. Let’s get the backdrop right first.
1. Market will continue to go up, with occasional corrections which will decrease in magnitude as time goes on.
2. The reason is simple: secular decline in long bond IR and USD value. This is reflected in PE expansion.
3. Plus relentless bid from retirement plans.
Now on to market participant behavior change. I believe this is secular in nature too. In our universe dS>0 is true which means every natural process is geared toward minimum energy and maximum randomness. See, the Cold War has to end because it violates laws of nature. This implies more new things in more varieties to come. So:
4. Get used to see more eye-opening price movements, likely on the upside.
5. And get ready for more strange things in financial markets.
6. And it will be accurately predicted by the use of data analysis.
Ramifications and approaches:
7. Believe the time compression in price movements. In other words: adapt.
8. There will be more noise in the media which will paralyze most investors. So don’t read free stuff. And use minimum numbers of technical indicators; this is proven by math.
9. Small guys will beat big guys by a wide margin and result in total chaos in the managed money space.
I suspect people like Jeremy Grantham will be in dog house for a long time to come. The Market have claimed may lives so far, and it is moving in the direction of maximum randomness but within the realm of controlled chaos.
Ingjiunn,
Love the, “natural process is geared toward minimum energy”, I point it out to my friends and family all the time and they are baffled. Nature Abhors Waste.
Secondly, Thanks for a succinct and concise investment advice. Agreed with what you say here.
Great post, Ingjiunn.
=> And it will be accurately predicted by the use of data analysis.
What kind of data analysis do you have in mind?
The only point I strongly disagree with is “And it will be accurately predicted by the use of data analysis.” Because data analysis is back looking when tested and we believe that history is now no longer a guide (more likely to mislead) then this will not predict accurately.
Proof recently is that in 2020 previously successful quant hedge funds did terribly while human judgement ones did well.
Pelosi buying deep in the money LEAP calls on TSLA, AAPL, DIS. Bullish.
https://www.barrons.com/articles/nancy-pelosi-husband-bought-apple-tesla-disney-stock-options-51611496598?mod=bol-social-tw
Those are some really deep in the money long term options, could they have been hedges instead?
I’m unable to come up with a good take this morning apart from the observation that ‘sometime’s nothing is a pretty good hand.’ 100% cash isn’t the worst place to be right now.
(a) The long bond is taking off without me.
(b) On the other hand, I’m happy to have dumped XLE/ XME/ KRE/ XLF/ XLI just in time.
(c) VT (my largest position heading into last Friday) is holding up relatively well.
To be clear, I’m no longer holding VT – or anything else, for that matter.
I don’t usually remain in cash for long periods of time – but it’s an underappreciated asset class. I recall debating the merits of cash with a fund manager about ten years ago. This guy was at the helm of a new fund, and I just happened to be following the many articles his lead strategist had been writing for Marketwatch. It was an impressive string of calls, and I was considering allocating a percentage of my portfolio to the strategy. The strategy involved moving between asset classes on a weekly basis using ETF purchases. The deal breaker was the manager’s insistence that cash would never be an option. My argument was that all asset classes may exhibit strong correlations during a market crash, whereas his view was that cash offered ‘no volatility’ (ie, no price movement) upon which to capitalize. Personally, I’m OK with no price movement for extended periods of time if markets are crashing.
Taking a swing at SOLO here.
The SPX appears to have undercut and then nicely recovered above its 3800 support level.
Maybe it’s time to look for buying opps.
Starters in XLE/XLF.
PAVE/ XLI.
KRE/ BAC.
XME/OIH.
Biting the bullet here and reopening a starter in EEM. If the phrase ‘unrelenting bid’ applied to any sector right now, this would be it. Intraday weakness may be the best opportunity I’ll have.
Transitioning to broader sectors. VTV/EFV here.
Reopening a couple of flyers here. QS/RIOT.
Couple more. NIO/FCEL here.
Having bought and sold GS ~289 on Friday after a 5-day slide, I have no problem reopening here ~281.
Similarly, now that BA is off -15% from its December highs, I have no problem reopening a positions here.
BABA is more problematic, but I like the stock and will reopen small here ~261.
Remember PFE? I last bought/sold ~37 as it was heading down into a hole. Reopening here as it reclaims 37 (hopefully) on its way out of the hole.
Even JETS looks good here. Reopening small.
Adding a little international color. Positions in VGK + EWZ heading into the final thirty minutes.
Adding an index spread at the close. In descending order: VTIAX/ VTRIX/ RYDHX/ VEMAX.
Governor Newsom has just announced the lifting of regional stay-at-home orders/ curfews as the winter surge begins to subside.
JMO, but if we’re looking for a correction, have we not already seen one in the banking/industrial/mining sectors +/- a muted version in the value sector?
Price action under the hood can often help to reset sentiment even in the absence of pullbacks in the broader indexes.
Would I be mistaken in thinking you are a trend follower on an hourly basis.? Are you at liberty to disclose how that type of very close trend following works for you? Thanks
No, I wouldn’t characterize my approach in that manner. I simply watch the markets on a daily basis, and when I come up with a ‘take,’ I act on it. That’s all it is.
Looking over the timing of my posts today, I can understand why it might reflect an hourly trend-following approach. What actually happened today:
(a) I started with no take.
(b) Scanning through my watch lists, I spotted an entry in SOLO.
(c) As the SPX recovered from a decline below 3800, I started to turn bullish.
(d) Not every position on my watch list presents an attractive entry/reentry point at the same time. I opened positions as they either dropped into a buy zone, or showed sufficient support that gave me the confidence to open/reopen above the buy zone.
(e) As I turned more bullish during the session, I began adding higher-risk positions and/or began opening positions in broad-sector ETFs and/or index funds.
I think we lift higher across the board on Tuesday. If I’m wrong, I have a decent buffer for the portfolio based on today’s gains.
Turnaround Tuesday? I’ll give it 67% odds.
Nice double retest of 3822 last night.
Overnight declines in Hong Kong and Shanghai-> buying opps this morning.
Reopening positions in FXI and ASHR/ adding to EEM in the pre-market session.
Looks like I jumped the gun on EEM, but EWZ (which I also opened yesterday) indicated higher by +2% which stems the gap-down right now. I have ~a +0.44% buffer in EEM based on Monday’s intraday gain. Adding to the position this morning at prices ~-1% lower leaves me in good shape.
Every other position opened yesterday indicated higher at the moment.
I could still be wrong – it may be a red day. It’s not as if I’m entirely comfortable with my positions right now.
Monday’s selloff filled last week’s gap in the SPX. I also think a ton of traders were shaken out. Then followed by successive retests in the ES. So I would be somewhat surprised if we sell off again today.
Paring back immediately on a few positions->XLE/ BABA/ FCEL.
Trimming back on OIH/ KRE.
Closing EWZ entirely.
Adding back to KRE.
Adding back to XLE.
Can’t recall who recommended this casino play – but the transactions below took less than 2 min:
Buy 100 Shares of GME at Market (Day) Filled at $81.9714
Sell 100 Shares of GME at Market (Day) Filled at $86.3801
Now, of course, it’s changing hands @ 93.70.
GME quotes have frozen. Not sure if trading is suspended, or if the platform is unable to handle the action.
Closing INTC.
Closing RIOT/ BTBT.
Closing VGK.
Closing SOLO. Closing PFE.
Not seeing the kind of bounce that I expected, and starting to lock in profits.
All banks off here.
I have now closed all positions that I’m able to close. The index funds will have to wait until end of day.
I was wrong about a lift in the global indexes.
The best thing I can say right now is that I was able to preserve all of Monday’s intraday gains. A very minor gain thus far today, although any further declines in the indexes will easily erase them.
Literally a ten-second trade:
Buy 100 Shares of GME at Market (Day) Filled at $109.225
Sell 100 Shares of GME at Market (Day) Filled at $113.40
Reminds me of playing short-squeezes on subprime lenders in 2007.
Missed the spike in FCEL. It happens.
Closing BA/ BABA.
Closing XLE/ XME for minor losses.
I plan to close positions in VTIAX/ VTRIX/ RYDHX/ VEMAX end of day. Hopefully for a minor gain.
Plan A for Wednesday will be to hopefully reopen positions in the hole – ie, I’m now leaning bearish.
Minor losses on all four funds, as it turns out (VEMAX off -1%, but it was the smallest of the four positions percentage-wise).
Anyone see the after-hours pricing on GME?
Despite closing many positions at the highs of the day (the open), I closed with a minor loss.
+2.18% ytd. Compared to +2.67% for the SPX. On the other hand, I have yet to be 100% invested this year.
LMFAO
Remember when Cam quoted that a*****e lawyer that runs Merc,k several months ago, badmouthing other companies that announced vaccines?
From HBR July 13 2020:
>>>>
Insights from Merck CEO Ken Frazier
On vaccine development
“I think when people tell the public that there’s going to be a vaccine by the end of 2020, they do a grave disservice
to the public.”
<<<<<<
https://hbswk.hbs.edu/item/merck-ceo-ken-frazier-speaks-about-a-covid-cure-racism-and-why-leaders-need-to-walk-the-talk
Sure.
I thought to myself when I read this, 'Merck has no game here, hence the badmouthing.'
And now
Merck Scraps Covid-19 Vaccine Candidates
https://www.wsj.com/articles/merck-scraps-covid-19-vaccine-candidates-11611575103?mod=e2tw
Gap down.
In the back of my mind is DeMark’s prediction of a significant correction following his SPX target of 3905.
There’s a distinction between buying a routine dip (opening in the hole) versus a gap-down that portends further weakness.
IMO, there are now certain sectors (energy, emerging markets, financials) that have successively pulled back to the point where another gap-down will cause a significant number of investors to throw in the towel – thus accelerating the selloff. The challenge lies in discerning the point at which the last sale(s) have been made – trying to time the reversal.
It feels a little too ‘easy’ to be reopening XLE/ EEM/ FXI/ XLF/ XLI right here – which may mean it’s too early.
In the meantime, spending a few minutes at the craps table.
Buy 100 Shares of GME Limit at $214.00 (Day) Filled at $213.99
Sell 100 Shares of GME Limit at $229.00 (Day) Filled at $229.00
Had I waited another two minutes->GME changing hands @ 245. Vegas on ‘roids.
internet says that some funds may liquidate on the losses from this trade.
Hold on a second. $340.
I would be an intermediate-term buyer ~SPX 3700.
I expect GME to trade red at some point today.
If Cam turns bullish at some point today, could someone repost here please?
Hate to admit it, but I’ve trading GME for the past seventy minutes.
Would I have done better buying XLE/EEM/FXI/KRE at the intraday lows?
Maybe. All I know is that the portfolio is up +0.34% on three trades in GME.
The major advantage of trading GME instead – taming the FOMO beast.
Nice turnaround in XLE.
+0.44%.
Leaving the casino.
SPX 3732. That’s close enough to 3700 for me to reopen a few starters.
XLE/ XLF/ KRE/ XLI/ XLV (new position)/ EEM/ FXI/ VTV/ EFV.
Adding XME. A little GDX.
Broadening out to VT.
Will reopen starters in RYSPX/ VTIAX/ VEMAX at the close.
All told, maybe ~30% invested end of day.