Richard Nixon’s Treasury Secretary John Connally famously said in 1971, “The dollar is our currency, but it is your problem”. Nixon’s actions at the time closed the gold window, imposed a number of tariffs, and drove the USD down in the aftermath of the collapse of the Bretton Woods Agreement of fixed exchange rates.
Fast forward to 2022, and the situation is different. The Federal Reserve is one of the most hawkish of advanced economy central banks, and its interest rate policy. The Fed’s actions are exporting disinflation abroad and forcing major trading partners to engage in a series of competitive tightening to defend their own currencies.
While US financial conditions are still relatively stable, financial cracks are appearing abroad and USD strength has become a wrecking ball wreaking havoc around the world. In spite of the hot September CPI print, the Fed’s pivot may be closer than the market expects.
A global wrecking ball
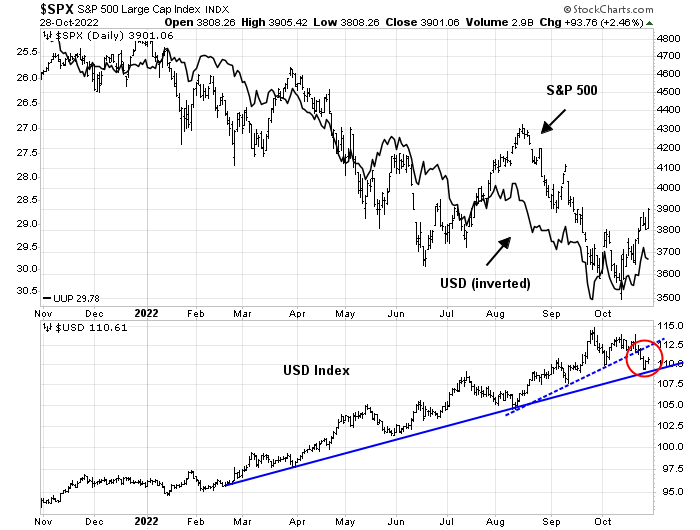
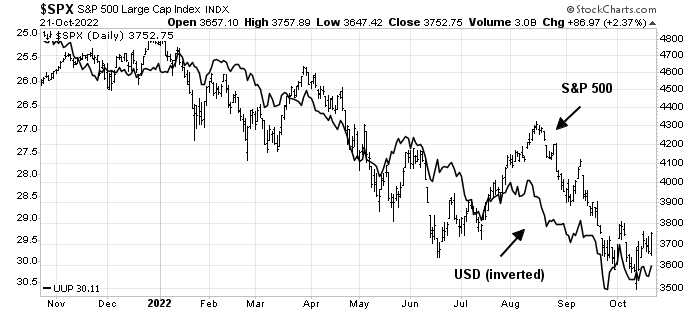
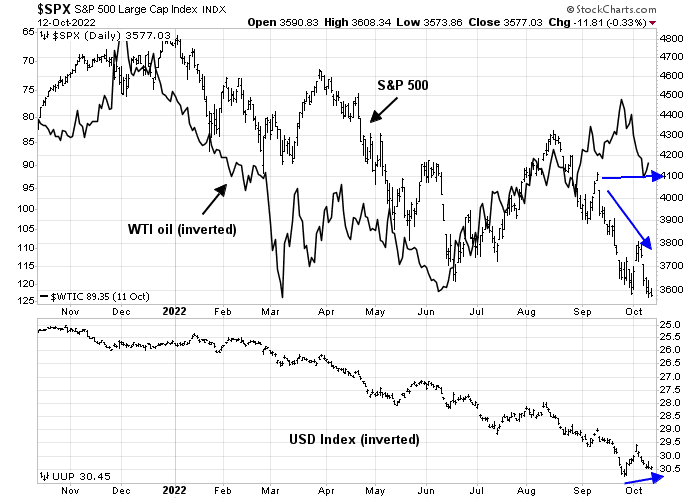
Let’s begin with the good news. A strong USD (orange line, inverted scale) is disinflationary. Historically, USD strength leads global inflation by eight months.
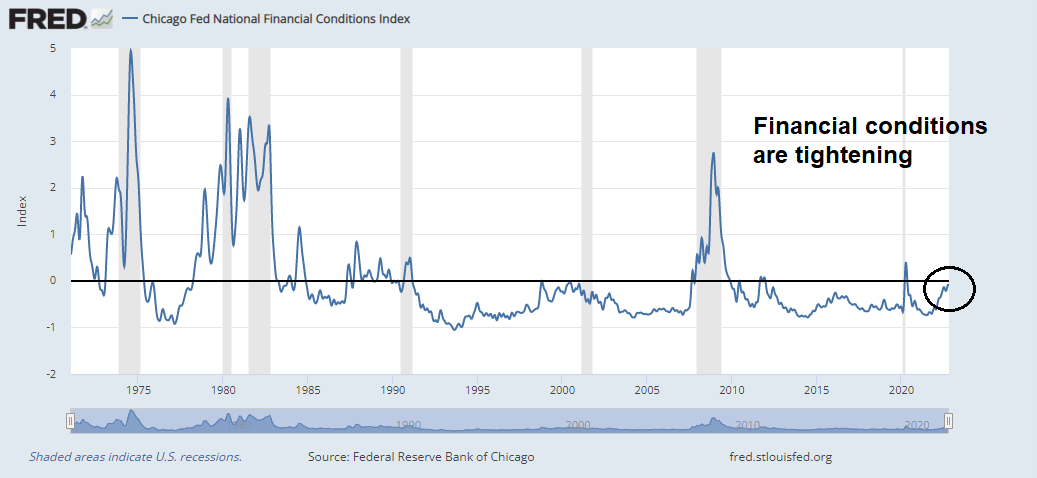
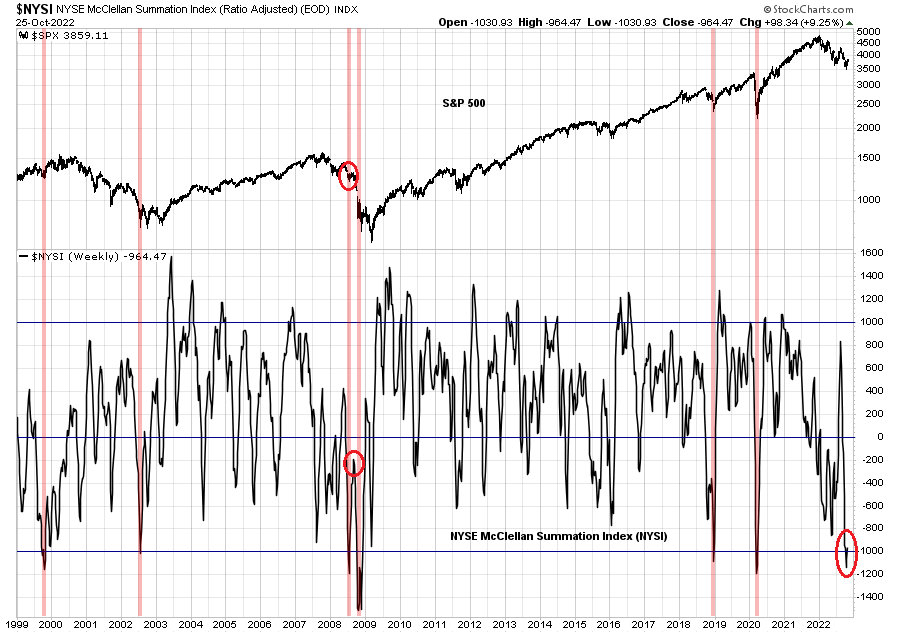
Here is the bad news, financial stress has been correlated with USD strength. The Chicago Fed National Financial Conditions Index (black line) is just under zero today. In the past, strength in this index, which indicates stress, has preceded recessions. While most recessions have seen this index turn positive, it did peak at just below zero during the late 1990s.
The Chicago Fed National Financial Conditions Index just covers the US, whose conditions are relatively tame. The IMF’s newly published
Global Financial Stability Report found higher stress levels in the Euro area and emerging market countries ex-China.
Offshore USD liquidity is drying up, which can be seen in the cross-currency swap market. While levels are elevated, they are not at crisis levels yet. Liquidity problems are particularly concerning as Treasury Secretary Janet Yellen stated, “We are worried about a loss of adequate liquidity in the [Treasury] market”.
Self-inflicted wounds
Europeans central bankers appear to have a propensity for self-inflicted wounds. The BoE apparent indecision on whether to support the gilt market confused markets. Last Tuesday, BoE Governor Andrew Bailey told pension fund managers to finish rebalancing their positions by Friday when it will end its emergency support program to support the gilt market: “And my message to the funds involved and all the firms involved managing those funds: You’ve got three days left now. You’ve got to get this done.”
The gilt market was instantly thrown into turmoil until on Wednesday, the FT reported:
The Bank of England has signalled privately to bankers that it could extend its emergency bond-buying programme past Friday’s deadline, according to people briefed on the discussions, even as governor Andrew Bailey warned pension funds that they “have three days left” before the support ends.
A few hours later, the story changed to:
A sell-off in UK government bonds accelerated on Wednesday, sending long-term borrowing costs higher after the Bank of England reiterated its plans to halt its emergency gilt-buying scheme as scheduled on Friday. The central bank said on Wednesday morning that it “has made clear from the outset, its temporary and targeted purchases of gilts will end on 14 October”.
In addition, there is an accounting quirk at the BoE that makes its intervention vulnerable to a pro-cyclical factors. There are two sources of losses. The first will be losses on its asset purchases holdings (AFP) as the interest rate on bank reserves exceeds the coupon yield on the asset purchases. As well, the BoE will realize losses on its balance sheet in light of the Bank’s intention to sell gilts as part of its QT program. Unlike other central banks such as the Federal Reserve, which can record losses as deferred assets and amortize them over many years from the Fed’s monetary income and lower transfers to Treasury, the BoE directly bills HM Treasury for these losses immediately. These losses will force the UK government to sell gilts to finance these losses at a time when the budget is under severe pressure and raise political pressure on BoE leadership.
An analysis by
Chris Marsh estimates that this fiscal indemnity under differing scenarios will cost £20 to £30 billion per year for the next few years, which is an enormous burden for the government.
To put this indemnity in context, the abolition in the top rate of tax (of 45p) was projected to have an impact of about GBP2bn per year in the steady state. The BOE indemnity will be GBP20-30bn per year for the next two years and potentially much more later.
The primary deficit from the March 2022 OBR forecast was projected for 2022/23 at GBP27bn and for 2023/24 at GBP13bn.
The ECB tried to top the BoE for a self-inflicted wound on Thursday when
Reuters reported that it is considering a change to its TLTRO program because it has become overly generous to banks.
European Central Bank policymakers are closing in on a deal to change rules governing trillions of euros worth of loans to banks in a move that will shave tens of billions of euros off in potential banking profits, sources close to the discussion said.
Euro zone banks sit on 2.1 trillion euros ($2.04 trillion) of cash handed out by the ECB at ultra-low, sometimes even negative interest rates, in the hopes that doing so would help kick-start the economy.
But after a string of unexpectedly quick and big rate hikes banks can now simply park this cash back at the ECB, earning a risk-free profit, irking policymakers who see it as gaming the system.
The intention of the policy change is to “hurt banks”.
“We are very close and a decision is going to come soon,” one of the sources, who asked not to be named, said on the sidelines of the International Monetary Fund and World Bank annual meetings in Washington. “The ultimate design is going to hurt banks, and that is very much our intention.”
Wait, what? Hurt a fragile banking system in an economy that’s in a recession? Instead, a desire to “hurt banks” will have the pro-cyclical effect of exacerbating the banking system’s downside risk. On the scale of policy errors, this has the potential to rival the BoE’s on-again, off-again statements of support for the gilt market.
In short, enormous stresses are appearing in European central banking. Rate hike cycles end abruptly when something breaks, and something may break soon in Europe.
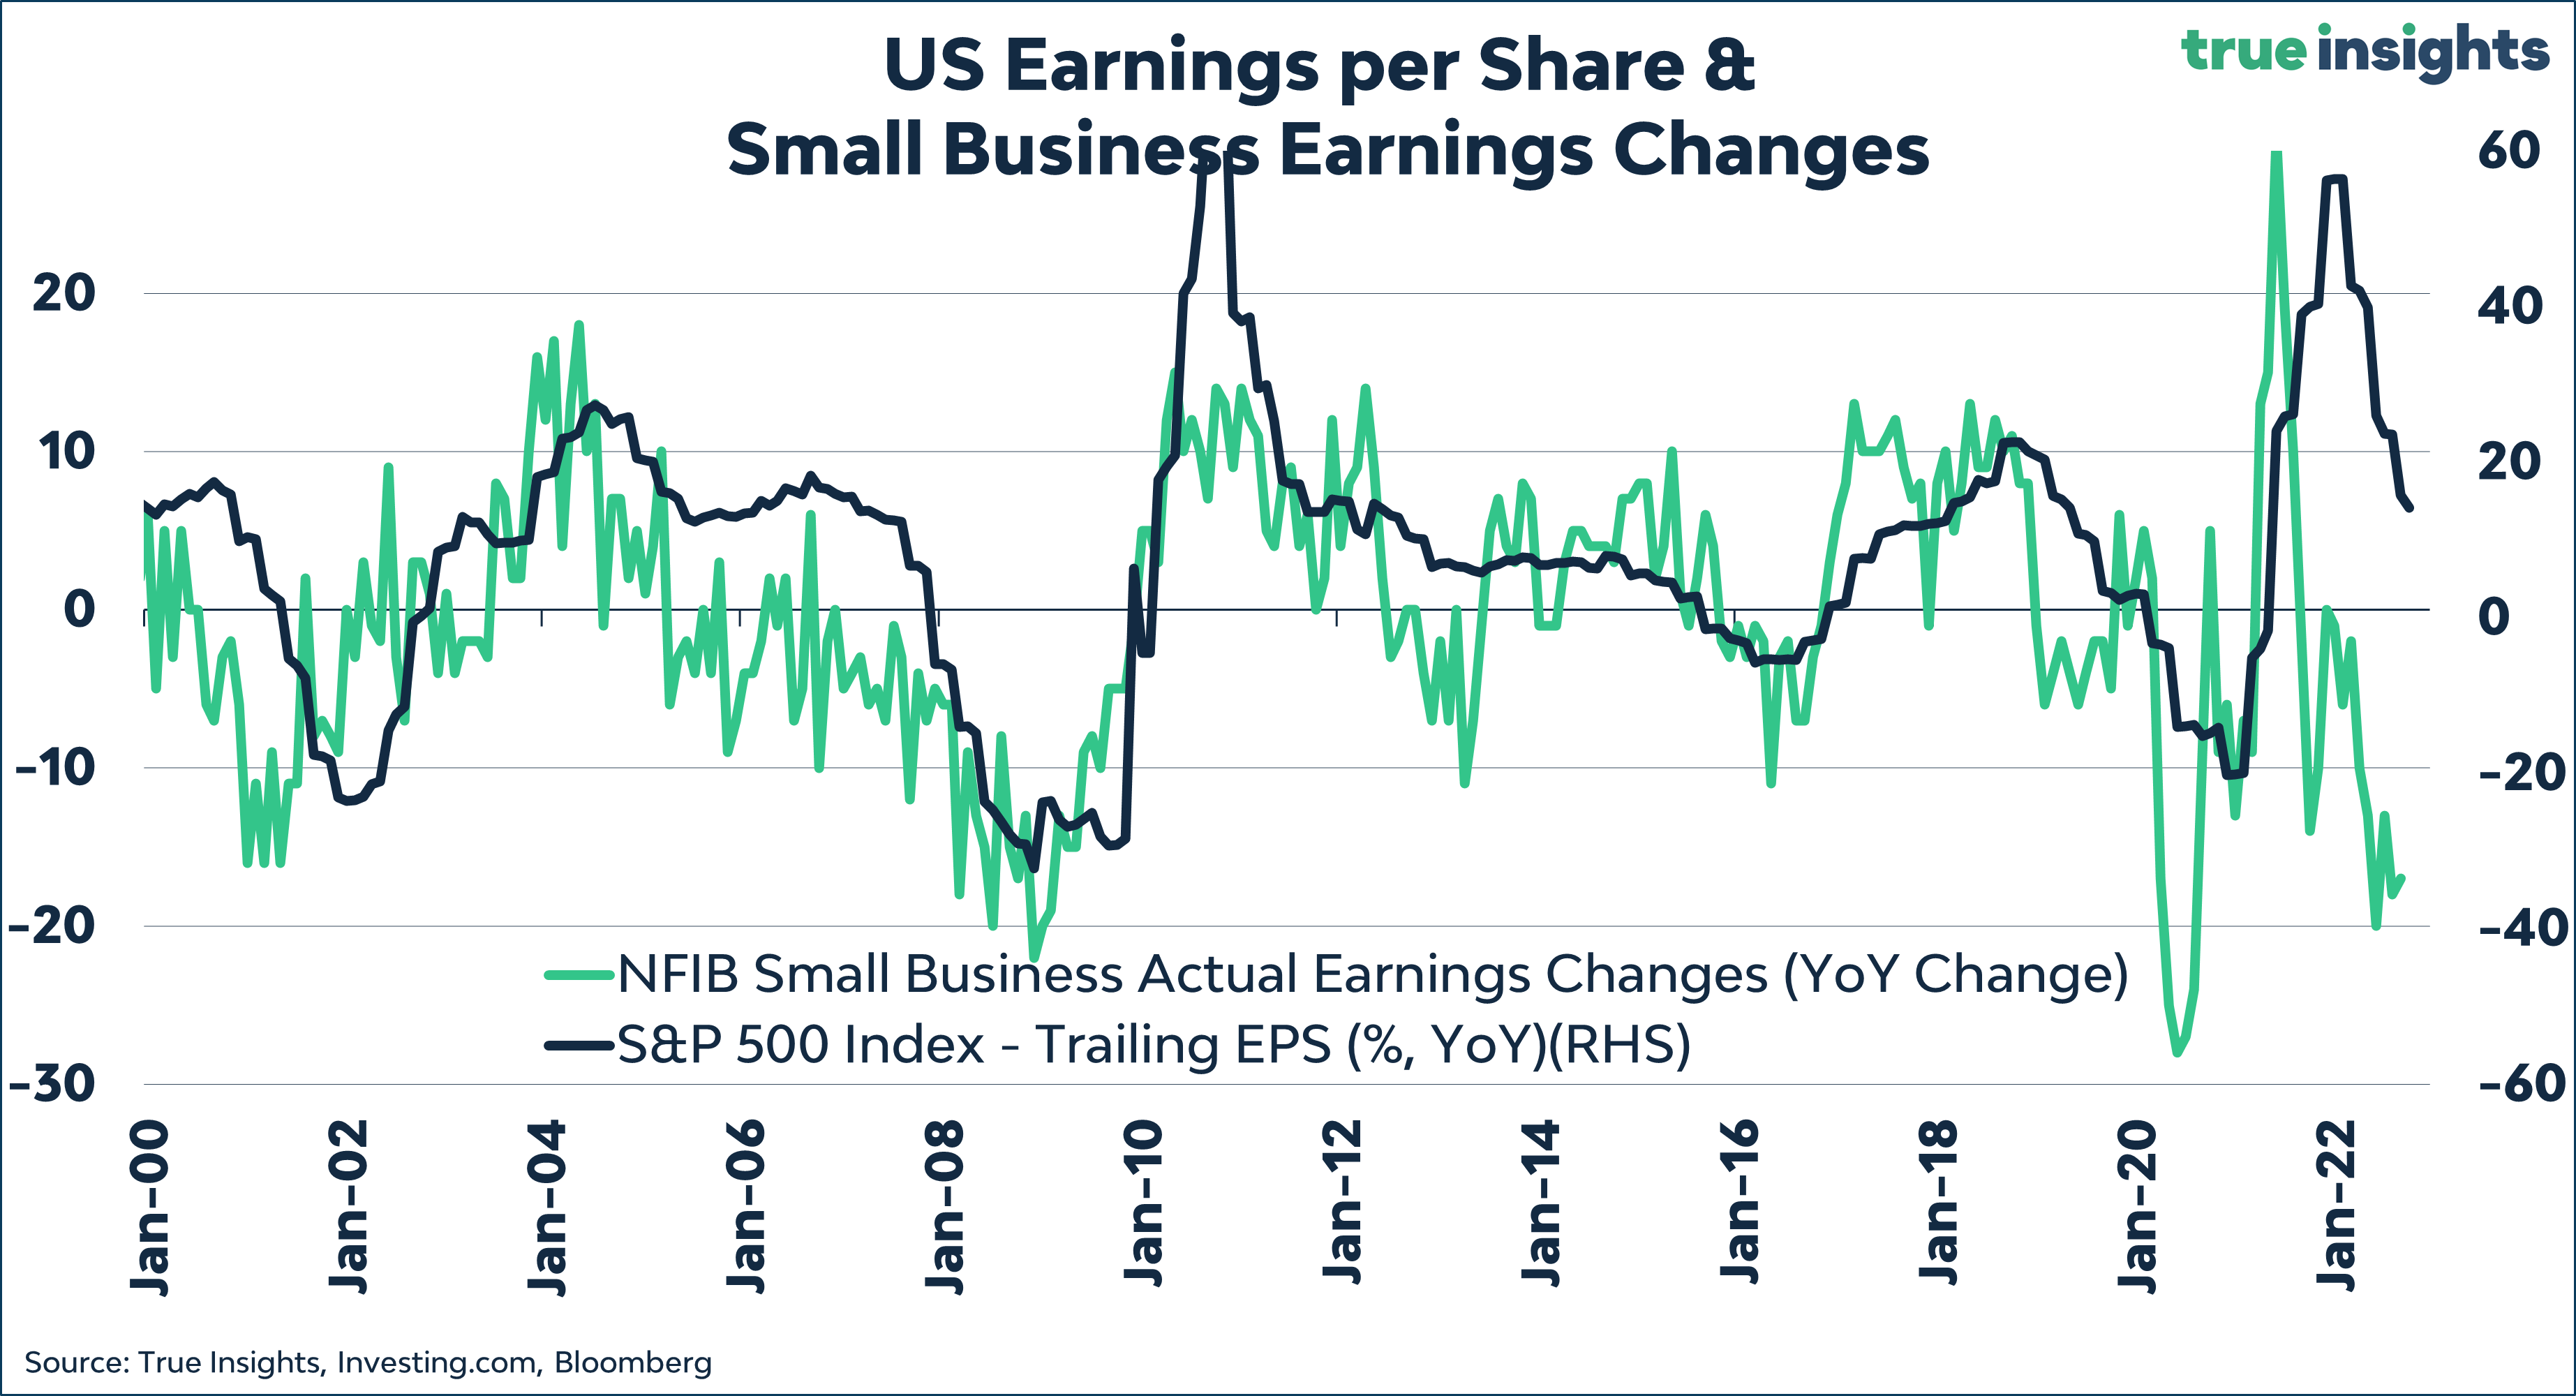
Earnings stress
Back on Wall Street, the dollar wrecking ball could wreak havoc on earnings growth. Historically, a strong USD has been correlated with negative earnings growth. While the very early results from Q3 earnings season have been encouraging, earnings growth will face macro headwinds longer term. Watch for earnings calls that include the phrase “but on a constant currency basis, we…”.
The party line on Fed policy
Current Fed policy is hawkish and it will remain especially hawkish in light of the hot September CPI report. The
September FOMC minutes reveals the key points of the Fed’s thinking.
Inflation is stubbornly high.
Participants observed that inflation remained unacceptably high and well above the Committee’s longer-run goal of 2 percent. Participants commented that recent inflation data generally had come in above expectations and that, correspondingly, inflation was declining more slowly than they had previously been anticipating.
Inflation risks are skewed to the upside.
Participants agreed that the uncertainty associated with their economic outlooks was high and that risks to their inflation outlook were weighted to the upside. Some participants noted rising labor tensions, a new round of global energy price increases, further disruptions in supply chains, and a larger-than-expected pass-through of wage increases into price increases as potential shocks that, if they materialized, could compound an already challenging inflation problem. A number of participants commented that a wage–price spiral had not yet developed but cited its possible emergence as a risk.
The good news is inflation expectations are well anchored, but the Fed is concerned that elevated inflation rates will boost inflation expectations.
In assessing inflation expectations, participants noted that longer-term expectations appeared to remain well anchored, as reflected in a broad range of surveys of households, businesses, and forecasters as well as measures obtained from financial markets. Participants remarked that the Committee’s affirmation of its strong commitment to its price-stability objective, together with its forceful policy actions, had likely helped keep longer-run inflation expectations anchored. Some stressed that a more prolonged period of elevated inflation would increase the risk of inflation expectations becoming unanchored, making it much more costly to bring inflation down.
Saying the quiet part out loud, monetary policy needs to deflate the jobs market to fight inflation.
Participants judged that a softening in the labor market would be needed to ease upward pressures on wages and prices. Participants expected that the transition toward a softer labor market would be accompanied by an increase in the unemployment rate. Several commented that they considered it likely that the transition would occur primarily through reduced job vacancies and slower job creation.
A Brainard pivot?
By contrast, Fed Vice Chair Lael Brainard may on leading the charge for caution in raising rates. Brainard is part of the powerful triumvirate at the Fed consisting of the Chair, Jerome Powell, the Vice Chair, and the President of the New York Fed, John Williams. Brainard had been on the Fed Board since 2014, and much of her work focused on global linkages and their effects on financial stability. In a
speech she made entitled “Global Financial Stability Considerations for Monetary Policy in a High-Inflation Environment” on September 30, 2022, she focused on the international linkages of monetary policy and referred to the word “spillovers” nine different times.
We meet regularly not only with monetary policy officials from different countries, but also with fiscal and financial stability officials in a variety of international settings, which helps us to take into account cross-border spillovers and financial vulnerabilities in our respective forecasts, risk scenarios, and policy deliberations.
While the Fed’s north star is still its price stability mandate and bringing inflation back to its 2% target, she acknowledged that monetary policy works with a lag. At some point, it will be appropriate to proceed “deliberately and in a data-dependent manner”, otherwise known as a pause.
We also recognize that risks may become more two sided at some point. Uncertainty is currently high, and there are a range of estimates around the appropriate destination of the target range for the cycle. Proceeding deliberately and in a data-dependent manner will enable us to learn how economic activity and inflation are adjusting to the cumulative tightening and to update our assessments of the level of the policy rate that will need to be maintained for some time to bring inflation back to 2 percent.
Brainard made a separate
speech, “Restoring Price Stability in an Uncertain Economic Environment”, on October 10, 2022 that was full of references to reasons why inflation is moderating but warned that monetary policy operates with lags.
We are starting to see the effects [of monetary tightening] in some areas, but it will take some time for the cumulative tightening to transmit throughout the economy and to bring inflation down.
She once again referred to the “combined effect of concurrent global tightening”, “spillovers”, and called for “moving forward deliberately and in a data-dependent manner” as a way of warning against over-tightening. In particular, she did not include the Fed party line about the risks of prematurely pulling back on tightening.
In the wake of the higher than expected CPI report, Fed Funds expectations have changed dramatically.
- A 75 bps hike in November has become a virtual certainty.
- The market now expects a 75 bps hike in December instead of 50 bps.
- The terminal rate rose to 475-500 bps, up 25 bps.
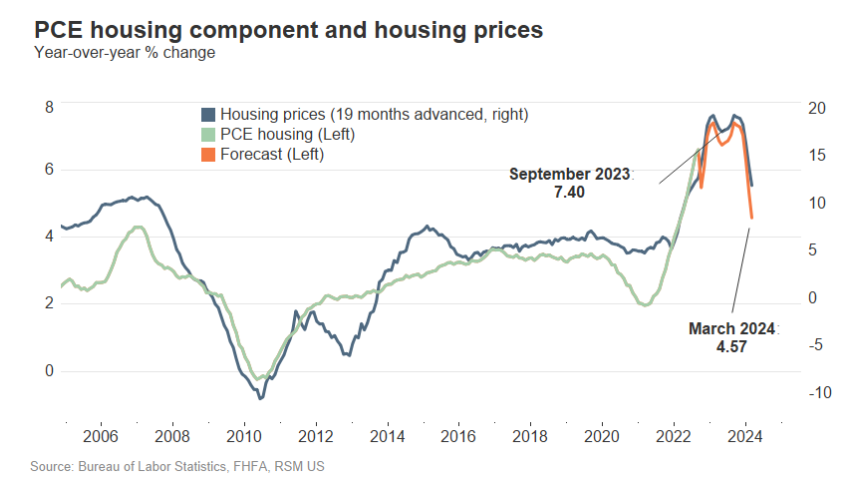
Those expectations may be overly hawkish in light of Brainard’s remarks. In particular, there has been a lot of hand-wringing over the shelter component of CPI, which comprises 32% of headline CPI weight and 40% of core CPI. A
BLS research paper found that the CPI rent index lags a full year behind rents paid by new tenants.
Redfin reported that rent increases are decelerating rapidly, supporting concerns about the Fed’s focus on a lagging indicator which will lead it to over-tighten.
Further
analysis of core CPI ex-Owners Equivalent Rent shows a clear trend of deceleration in this “core+ CPI”.
In conclusion, the Fed’s tight monetary policy is creating spillover effects all over the world by boosting the USD. The recent cover of Barron’s may be the contrarian magazine cover signal that the era of the USD wrecking ball is over.
Market conditions may be on the verge of triggering a pause in the global hiking cycle. Possible contagions from uncertainties in the gilt market and euro area bonds, lack of liquidity in the onshore and offshore USD market will increase financial stability concerns for central bankers. A monetary policy pivot may be far closer than the market expects.