Take a look at this mystery chart. Is that a bullish or bearish pattern? This chart is just the start of my nine reasons to be bearish on risk assets. My analysis is mainly based on real-time pricing signals from the market and relies less on fundamental or macro analysis.
This is a time for investors to be cautious and think more about risk than return. That said, I offer one silver lining in all the dark clouds. There is one (sort of) reason to be bullish.
A failed geopolitical risk rally
Sometimes it’s useful to view a chart upside down. The mystery chart is MSCI Poland in USD, which I use as a proxy for geopolitical risk. The Polish market bottomed out in early March as Russia-Ukraine war fears peaked. Unfortunately, the rebound had no legs and began to fade in April. The relative performance of Poland to the Euro STOXX 50 (bottom panel) also shows an ominous pattern of lower lows and lower highs.
The relative performance of major eurozone equity markets to the MSCI All-Country World Index (ACWI) is similarly discouraging. In particular, relative weakness is more evident in core eurozone than the periphery, which is negative for the region’s economic and market outlook.
Much of the weakness is attributable to the size of the energy shock that Europe has to endure. The EU’s energy burden as a share of GDP spiked to 9.1%, which is a level not seen since the late 70’s and early 80’s. Across the Atlantic, the effects of higher US energy costs are mild by comparison.
A failed rate hedge
The second reason why I am cautious on the markets is the inability of hedges to work, which is a signal that the plumbing of the markets is broken somewhere. The Rising Rates ETF (EQRR) is supposed to hedge against rising rates. To be sure, yields have risen across the board and EQRR has held its own on an absolute basis. However, the bottom panel shows that the relative performance of EQRR is rolling over, which I interpret as a sign that factor returns are behaving in unexpected ways.
Cyclicals breaking down
If we look under the hood of the EQRR portfolio, we can see that it has a large weight in financial stocks, followed by resource extraction sectors and other cyclicals. While commodities and resource extraction stocks have performed well, other cyclical industries have been tanking.
This relative performance analysis of cyclical industries tells the story. While infrastructure stocks are holding their own relative to the S&P 500, all of the other industries are either breaking down or in a relative downtrend. This is an unambiguous message from the market that’s screaming “cyclical slowdown”.
The relative performance of homebuilding stocks is indicative of the headwinds faced by cyclical stocks. Historically, the relative performance of this industry has been inversely correlated with mortgage rates. As interest rates rise, this highly cyclical industry faces some tough challenges. As well, the relative weakness in homebuilding has been confirmed by lumber prices.
A Dow Theory sell signal
The poor performance of the Dow Jones Transportation Average is equally worrisome as a sign of cyclical weakness. Not only have the Transports plunged in just a few days, they have also breached a relative support level compared to the Dow Jones Industrials Average.
Mark Hulbert reported that Manuel Blay issued a sell signal on February 22.
According to Manuel Blay, editor of TheDowTheory.com, is that the stock market is punishing U.S. firms that rely on international supply chains. He points out that U.S. companies that are “more local [and] less outsourced” recently have significantly outperformed.
For the record, I note that Blay doesn’t base his market timing advice on the Dow Jones Transportation Average alone. Consistent with his interpretation of the Dow Theory, the oldest market timing system that remains in widespread use today, he instead focuses on both the Dow Transports and the Dow Jones Industrial Average. On that basis, Blay issued a “sell” signal on Feb. 22 of this year.
Defensive leadership
On the other hand, defensive sectors are all in relative uptrends.
For the sake of completeness, the relative performance of the major growth sectors is also weak.
No help from China
Other than the defensive sectors, the part of the market that’s showing leadership is commodity-related resource extraction industries. This is an indication that the market is undergoing a late-cycle phase led by inflation hedge vehicles.
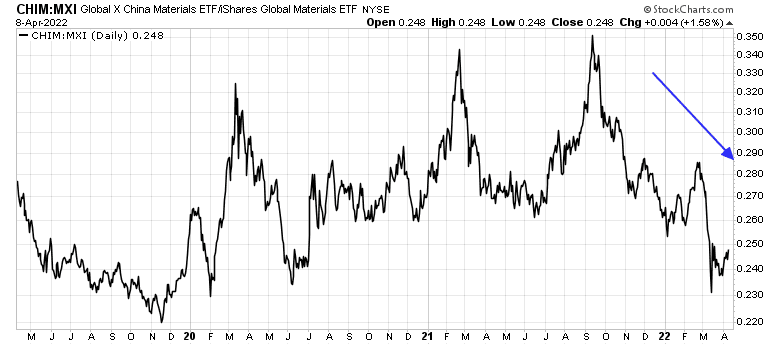
The blemish to the late-cycle expansion narrative is China. China is a voracious consumer of raw materials and Beijing has undertaken some steps to stimulate its economy. However, the relative performance of Chinese material stocks is weak, indicating a lack of Chinese demand. Investors shouldn’t expect China to rescue the global economy.
Weak equity risk appetite
In addition, equity risk appetite indicators, as measured by the relative performance of high beta to low volatility stocks and the equal-weighted relative performance of consumer discretionary to staples, are weak and flashing minor negative divergences to the S&P 500.
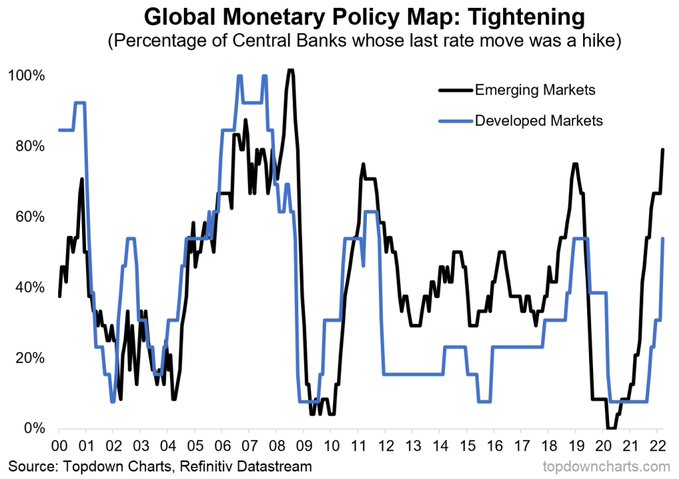
Hawkish central bankers
Lastly, central bankers are turning hawkish everywhere.
In addition, former New York Fed President Bill Dudley wrote a
Bloomberg Op-Ed which concluded that the Fed needs to hurt the stock and bond markets in order to bring inflation under control.
As [Jerome Powell] put it in his March press conference: “Policy works through financial conditions. That’s how it reaches the real economy.”
He’s right. In contrast to many other countries, the U.S. economy doesn’t respond directly to the level of short-term interest rates. Most home borrowers aren’t effected, because they have long-term, fixed-rate mortgages. And, again in contrast to many other countries, many U.S. households do hold a significant amount of their wealth in equities. As a result, they’re sensitive to financial conditions: Equity prices influence how wealthy they feel, and how willing they are to spend rather than save.
Dudley concluded:
Investors should pay closer attention to what Powell has said: Financial conditions need to tighten. If this doesn’t happen on its own (which seems unlikely), the Fed will have to shock markets to achieve the desired response. This would mean hiking the federal funds rate considerably higher than currently anticipated. One way or another, to get inflation under control, the Fed will need to push bond yields higher and stock prices lower.
Financial conditions are far from showing signs of stress. Yield spreads widened but they recently narrowed again, indicating loose financial conditions. If Dudley is right, the Fed will need to tighten a lot more to break the markets.
Good news on inflation?
If Dudley is focused on inflation, some good news on inflation may be on the way. That’s the silver lining in all the dark bearish clouds. As the market openly worries about a repeat of the 1970’s, an analysis of different measures of CPI shows that sticky price CPI is tame while flexible price CPI has surged. By comparison, both were rising uncontrollably during the inflationary 1970’s.
The woes of the truckers and transportation stocks may be an indication that flexible price CPI is ready to retreat. China to US shipping volume is falling, indicating an easing in COVID-induced supply chain disruptions.
The drop in transportation volume is a manifestation of the bullwhip effect. When supply chain disruptions hit a market, the initial reaction is to horde inventory and over-order, which creates a ripple effect down the supply chain. As new supply appears, participants are caught with excess inventory and evaporating orders because their customers had over-ordered. This creates a boom-bust volatility effect in the supply chain as disruptions go down the supply chain.
This bullwhip effect can also be observed in the components of the March ISM Manufacturing report. The spread between new orders and production has fallen dramatically, indicating easing supply chain pressures.
Fed policy makers recognize these inflation dynamics. Goods inflation is expected to decline. The dual challenges are the additional supply chain disruption effects of the Russia-Ukraine war and the evolution of services inflation as consumers shift spending from goods to services as the pandemic eases.
Brent crude printed a
tombstone candle for the month of March, which may be indicative of a top. The price reversal needs to be confirmed by the next candle (in April), which is playing out so far. This is another sign that much of the war-related commodity price surge has peaked, which could feed into a welcome inflation surprise in the near future.
Job posting growth on Indeed are starting to stall, which may be a sign that the red-hot labor market is cooling.
The key indicators to watch in the coming months are non-farm payroll for signs of changes in job market pressures and the interaction between wages and inflation. Also, keep an eye on the evolution of inflation. The Fed is projecting a core PCE rate of 4.1% by December. Will inflation overshoot or undershoot that estimate?
The US Inflation Surprise Index is positive but decelerating. The CPI report on Tuesday will be a key test for the markets.
In conclusion, a review of a variety of market-based signals lead to the conclusion that risk asset prices are headed lower. The combination of hawkish central bank policy tightening into a cyclical downturn is the recipe for an equity bear market. The only hope for the bulls is better news on inflation which will slow the pace of accommodative policy removal and change the economy’s flight path into a soft landing.


This week on my momentum rankings, every Defensive sector jumped up amazingly.
This is like living in Florida and watching your neighbors frantically putting up shutters on their windows and sandbags around their doors while the weather is currently calm and sunny. You think maybe you should have been watching a weather report last night instead of going to the disco.
Interesting to see utes rising in tandem with sharply higher bond yields. Seems counterintuitive but speaks to flight to safety. Not a good omen for the market.
Totally agree.
In most states in America the Utility Commission of each State allows the Utility Company to raise prices as their underlying cost go up. Therefore. the inverse yield and price does not hold. In fact, Utility Companies are considered defensive inflation hedges because of their ability to raise prices and are most probably the reason they are showing so much strength.
Utilities are mainly governed at the State level. States are generally slow to allow rate adjustments. It’s likely, IMO, that utilities will not perform well in a sustained inflationary environment.
Last week I pointed out the weakness in the Semi’s and the Transportation Index together with the Transport”s making a new low i.e. a Dow Theory signal.
The latest news on London Exchange not accepting Russian precious metals for delivery is another accident waiting to happen. Similar to Nickel.
Gold and silver including the miners are very cheap on a fundamental basis. Their relative strength is also very high. I would keep an eye out to see if there is a high volume breakout.
Excerpt from JPMORGAN weekly report;
‘Booming consumer demand, a tight labor market and high-realized inflation have driven rapid progress through the business cycle. Now that the Fed has made its intentions to bring down inflation by any means necessary crystal clear, it seems reasonable to worry about the next recession.
But we still think it’s too early for that. Since 1975, the economy has spent about 20% of the time in what we consider “late cycle,” and risk assets tend to provide attractive returns during the period.’
Cam, are you suggesting a bear market in the late cycle or a bear market in a recession? Fed may not stop adjusting policy in the former but will definitely ease in the latter. Investment grade bonds of 7-10 year duration may provide a hedge to an investment portfolio of high quality assets. Your thoughts are welcome.
Recent asset performance maybe an overreaction to recent Fed news. Market rates are already doing the job of slowing growth but are there any signs of growth recession? Key is Services ISM which is stronger than expected. Contrary to the belief that credit is seizing up, it’s plentiful (more expensive for sure). Another sign to watch.
The economic cycle is the late cycle of an expansion, which is about to turn down.
As the markets look ahead, the market cycle is looking at a slowdown/recession (not sure which yet) with unknown downside potential for stock prices.
Thanks Cam.
Jurrien Timmer thinks there will be a PE compression of up to 20% with earnings growing roughly 10%. A down side of 10% from current levels( If I understood him correctly).
It’s neither surprising that there are many reasons to be bearish, not that worried investors have driven down the prices of risk assets/ bid up the prices of defensive assets.
The question is whether our outlook should be even more negative than it already is.
I’ll take it day by day, and manage those parameters within my control-> allocation percentages, position sizes, stop levels, and time frames.
A thread on Shanghai lockdown and COVID-Zero-in-China
https://mobile.twitter.com/RealSexyCyborg/status/1512734595485106179
Is the information fair in the thread?
Could this be an emerging risk that we need to consider?
Cam, do you expect the commodities and resource extraction stocks to continue to do well? Any insights there? Thank you.
A tour de force Cam. Well done