Preface: Explaining our market timing models
We maintain several market timing models, each with differing time horizons. The “Ultimate Market Timing Model” is a long-term market timing model based on the research outlined in our post, Building the ultimate market timing model. This model tends to generate only a handful of signals each decade.
The Trend Asset Allocation Model is an asset allocation model that applies trend following principles based on the inputs of global stock and commodity price. This model has a shorter time horizon and tends to turn over about 4-6 times a year. The performance and full details of a model portfolio based on the out-of-sample signals of the Trend Model can bsoe found here.

My inner trader uses a trading model, which is a blend of price momentum (is the Trend Model becoming more bullish, or bearish?) and overbought/oversold extremes (don’t buy if the trend is overbought, and vice versa). Subscribers receive real-time alerts of model changes, and a hypothetical trading record of the email alerts is updated weekly here. The hypothetical trading record of the trading model of the real-time alerts that began in March 2016 is shown below.

The latest signals of each model are as follows:
- Ultimate market timing model: Buy equities
- Trend Model signal: Bearish
- Trading model: Bearish
Update schedule: I generally update model readings on my site on weekends and tweet mid-week observations at @humblestudent. Subscribers receive real-time alerts of trading model changes, and a hypothetical trading record of those email alerts is shown here.
Subscribers can access the latest signal in real-time here.
A bear market
The signs are becoming clear. This is an equity bear market. Global central banks are engaged in a coordinated round of tightening. Fed Governor Lael Brainard put on the table the prospect of quantitative tightening, or a reduction of the Fed balance sheet, in a speech last week. This was confirmed by the release of the March FOMC minutes which revealed the Fed is targeting $95 billion in balance sheet reduction per month. Cue the fears about the effects of falling liquidity on stock prices.

In addition, the hopes that the bulls had for a momentum-driven rally fizzled in late March. The S&P 500, S&P 400, and S&P 600 all stalled at resistance and have all since pulled back.

Here are some ways that traders and investors can find stable and risk-controlled returns in a chaotic bear market.
Brace for turbulence
The S&P 500 intermediate-term breadth momentum oscillator (ITBM) is on the verge of a trading sell signal when its RSI recycled from overbought to neutral. There were 21 sell signals in the last five years. 14 resolved in a bearish manner and seven were bullish. Unless the market stages a gargantuan rally, count on a sell signal on Monday.

Historically, ITBM sell signals are better at calling direction than magnitude. In all likelihood, the latest downdraft is likely to be relatively shallow. The NYSE McClellan Oscillator (NYMO) is falling quickly and nearing an oversold condition. A recycle from oversold to neutral has been an effective buy signal in the past.

As well, the AAII weekly bull-bear spread has already fallen to -16.7%. Further deterioration in sentiment will push this model to a contrarian buy signal.

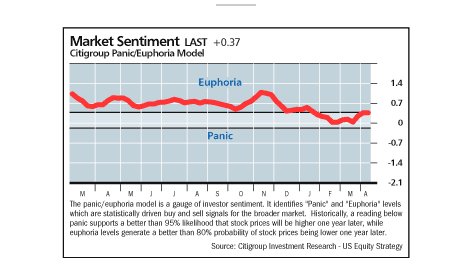
However, long-term sentiment models are contrarian bearish. The Citigroup Panic-Euphoria Model recently edged into euphoric territory.
The BoA Sell-Side Indicator, which measures the positioning of Street strategists, has been slowly falling, but readings are still elevated and much closer to a contrarian sell signal than buy signal.

Achieving stable risk-controlled return
My working hypothesis for the near-term outlook is a choppy market, but the S&P 500 is unlikely to breach its 2022 lows. While traders may profit from short-term bearish exposures, risk will need to be managed carefully. Bear market rallies can be vicious and short-sellers run the risk of getting their faces ripped off.
It is in this chaotic environment that I suggest pairs trading as a more risk-controlled way of finding better returns. There are two ways of approaching pairs. Traders can simply buy the bullish half of the pair and short an equal dollar amount of the bearish half. Long-only investors whose returns are measured against a benchmark should consider overweighting the bullish half of the pair while underweighting the bearish half.
Here are some pairs to consider.
A focus on quality
During periods of economic stress, investors are advised to be tilted towards high-quality stocks. There are several ways of measuring quality. One simple way is profitability, which can be seen by the return differential between the S&P and Russell stock indices. S&P has stricter profitability index inclusion criteria than Russell. We can see this effect by observing the cumulative return spreads of large caps (long S&P 500/short Russell 1000) and small caps (long S&P 600/short Russell 2000).

Long defensive/short cyclical exposure
My recent publication (see The 9 reasons you should be bearish) reviewed the relative performance of a variety of sectors and industries. Positive relative strength was evident in inflation hedge groups and defensive sectors, while cyclical and growth stocks exhibited negative relative strength. Based on this theme, consider these pairs.
Long Healthcare (XLV) and short Communication Services (XLC): The technical pattern of this pair is clear. The pair is in a well-defined uptrend, and so is XLV, which is a defensive sector. XLC is in a well-defined downtrend.

Long equal-weighted consumer staples (RHS) and short equal-weighted consumer discretionary (RCD): I chose the equal-weighted ETFs because the cap-weighted consumer discretionary sector is dominated by Amazon and Tesla. The equal-weighted versions are more reflective of the underlying fundamentals of the economy. Just like the XLV/XLC pair, RHS is in strong and staged an upside breakout while RCD is in a well-defined downtrend.

Long inflation hedge/short cyclical exposure
The long inflation hedge theme is a little tricky because of the possible bearish reversal exhibited by Brent oil prices. For this reason, I prefer to avoid the energy sector and focus on mining and agricultural products, whose technical patterns did not exhibit monthly tombstone candlestick patterns.

Long global mining (PICK) and short regional banks (KRE): The pair is in a well-defined uptrend and so is PICK. Regional banks (KRE) are likely to weaken further as the Fed tightens and financial conditions worsen. Moreover, regional banks are likely to be more exposed to financial stress than their larger counterparts.

Long global mining (PICK) and short broker-dealers (IAI): Much like the above PICK/KRE pair, this is a long inflation hedge and short market beta and cyclical play. Broker-dealers (IAI) are sensitive to financial conditions and they tend to underperform during periods of financial stress.

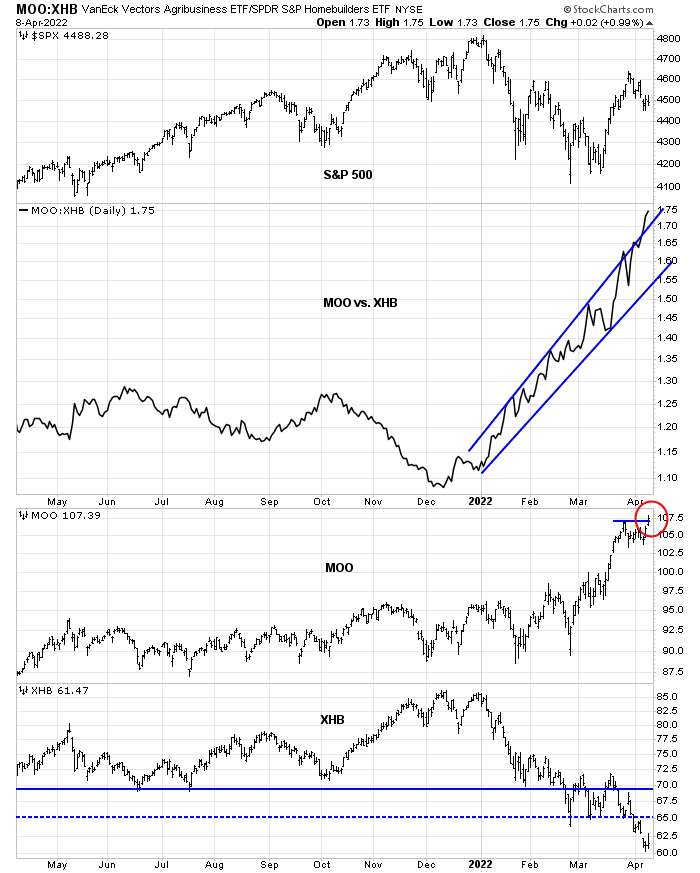
Long agribusiness (MOO) and short homebuilders (XHB): This is an attempt at theme diversification of long inflation hedge and short cyclical exposure. Agricultural production will continue to be affected by the Russia-Ukraine war, regardless of its outcome. The homebuilding business faces headwinds from Fed tightening and higher mortgage rates. That said, this pair is a little extended and may be due for a short-term reversal should the bond market, which is oversold, stage a rally and alleviate some of the pressures on homebuilding stocks.
Regional pairs
I also identified several selected global regional pairs last week, based on a theme of long producers and short importers (see How the commodity tail wags the stock market dog). These regional pairs continue to be well worth considering.

I will update all of the pairs outlined in this publication on a periodic basis. Feedback and expressions of interest are appreciated so I know how much resources to devote to the regular update to this strategy.
My inner investor remains cautiously positioned. Subscribers received an email update on Friday that my inner trader had initiated a short position in the S&P 500.
Disclosure: Long SPXU
Thank you Cam. Regarding the pairs, some about fixed income would be nice too. Also, I think it would be useful some historical examples of similar choppy bear markets and how the main indexes behaved, so we can draw an expected evolution for 2022. Keep up the good work.
Sage advice
At some point, things will break and the Fed will likely back off. At the moment TLT is dropping like a stone. One could argue that a H&S with a neckline around 130-132 has formed and has been broken. This would put a target for TLT around 100. When the rush for safety happens, especially if the Fed backs off, there should be a good rally in TLT. When a recession happens, my guess is the Fed drops rates, it’s the typical response. Besides looking at the chart of TLT or treasuries and spreads like $$HYIOAS, watch what the indices are doing. If the SPX is cratering on increasing volumes and recession indicators are flashing stronger we could be nearer the bottom in TLT. Remember that the west is highly indebted public and private, so how long can high interest rates be tolerated? But who would have thought that oil could go negative, even if for just a brief moment? What’s the chance the federal gov’t runs a fiscal surplus? Odds are the debt keeps rising, so where can rates go? My guess is that eventually there will be two rates for 2 categories, gov’t debt will get the Japan treatment and the rest of us will deal with real interest rates based on a spread that will reflect credit risk.
This is a trading post.
Pair trades seem similar to options trade strategy known as ‘risk reversal ‘ where you sell something(to finance) to buy something else with the idea that what you sell can be bought back cheaper and what you buy can be sold at profit. A leveraged strategy. Time decay is a challenge.
Pair trading requires different set of skills and tools. I find shorting an etf you already own simultaneously as an alternative that is easier to monitor and manage. Time is not an issue but direction of movement is.
Highly leveraged – buy SPXU and short SPXL in different ratios.
No recommendations, just different strategies for profiting from directional moves depending on risk and conviction.
These pair trades are very helpful.
Overnight sharp rise in 10 year Treasury yields and drop in China tech shares means NASDAQ will be down big at the opening.
Time to suck it up.
Beginning to scale out of positions in SPY/ QQQ on improvements in futures pricing over the past hour.
My biggest weakness (at this point in my life) is a strong instinct for capital preservation – and I refer to it as a weakness in the following sense:
(a) I’m slow to jump on board when the markets rally (ie, I hate to chase).
(b) When I do jump on board, position sizes are smaller than I’d ultimately like, and I close positions early for modest gains.
(c) When markets subsequently rally hard, I’m left with regret – which then leads to scaling back in early.
Closing BABA/ FXI here as well – albeit still well ahead on both positions ytd after capturing double-digit gains during a few fantastic overnight gaps up in March.
Closing TLT here – as I’ve now given back all of my recent trading gains on the position.
There’s a good chance I’ll be closing the remainder of positions in the first hour of trading – whether I’m able to preserve a green balance ytd will depend on how well I manage my largest position (VT).
Losses are inevitable. It’s how we handle them that determines how well we do.
I honestly think TLT rallies this week. But I can argue with price movement only so far.
I think it was Kevin Marder who recently commented that life (as a trader) changed for him when he gave up buying low and selling high – in favor of buying high and selling higher. Easier to trade with the wind at your back.
I also think QQQ rallies this week. But I’ll have to get comfortable with buying higher and selling even higher.
Closed half of my position in VT at the open, then braced for a selling wave, and now closing the other half on the ebb in selling.
If markets move higher from here – which they likely will – I will no longer be aboard. It happens.
No longer green ytd.
I don’t think anyone expected the move in Treasury yields this month. Bonds have offered no protection whatsoever from market volatility – just the reverse.
Looks like I took the Fire Exit just in time.
Turnaround Tuesday seems like a remote possibility right now.
The pairs trade is indeed helpful as it gives more detailed look into the global market, but if it takes time away from your main work on the US market then I’m neutral. Unless of course if the US market is going to experience a lost decade because of higher relative valuations then focusing on other things like the pairs trade will be valuable.
Pair trades or a discussion of specific sectors is very helpful.
Would love your thoughts on precious metals and basic metals (copper, etc.) as the performance of various metals won’t be the same. They all have their own fundamentals.
Bad news for bulls from Mark Hulbert:
https://www.marketwatch.com/story/bullish-investors-are-fearful-but-theyll-need-more-pain-to-give-up-on-stocks-theyll-get-it-11649711936?mod=home-page
Great post. Thanks.
I would consider reopening SPY ~SPX 4350…
Cam- Are we closing in on a buy signal for bonds? SHY/ IEI/ IEF/ TLT.
If the S&P futures stays above 4420 today which is the 50 day moving average it can go to 4500 which is the 200 day moving average. I went long at the close yesterday.
The major trend is yet down.
Taking advantage of the premarket pullback in SPY/ QQQ and reopening starters ~438.xx and 340.xx here. Playing cautiously.
I think we see a nice fake-out to the downside before reversing to close at the highs. JMO of course.
Reopening a position in VT.
KRE. FXI/ BABA.
EWG.
VTV.
Added to SPY/ QQQ in the first thirty minutes.
Adding to VT here.
Opening a position in IEI.