Mid-week market update: In case you missed it, the market recently flashed a Hindenburg Omen last week. The criteria for the Omen was succinctly explained by David Keller as:
- The market is in an established uptrend;
- A sharp expansion in both new highs and new lows, indicating indecision; and
- A momentum break.
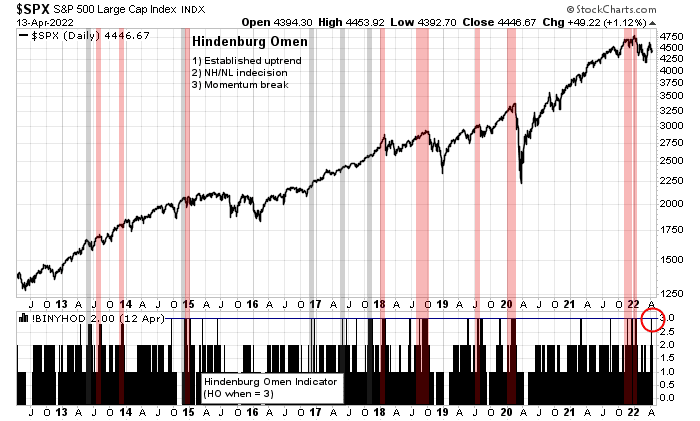
To be sure, Hindenburg Omens aren’t bearish until we see a cluster of Omen signals within a short period. Since last week’s Omen was a singular event, we should only treat it as a warning and not an actionable signal.
Instead of a sharp expansion in individual stock new highs and lows, Willie Delwiche observed a sharp bifurcation in new highs and lows by industry, which is not surprising in light of the current backdrop of weak economic growth expectations and strong commodity strength. While such an instance does not have the other criteria of the Hindenburg Omen, historically such episodes have shown a negative price bias on a 4-week horizon.

Bullish or bearish sentiment?
Sentiment models show a mixed picture. While survey data is not at a bearish extreme, positioning data indicates a crowded short. The latest BoA Global Fund Manager Survey shows that institutional managers are extremely pessimistic about global growth (light blue line), their equity positioning is cautious but not at a panic extreme. Watch what they do, not just what they say.

Similarly, Mark Hulbert found that the Hulbert Newsletter Stock Sentiment Index (HSNSI) is turning cautious, but nowhere near a crowded short reading indicative of a durable market bottom.

On the other hand, a report from Morgan Stanley Prime Brokerage found that hedge fund net leverage had fallen to the second percentile on a one-year lookback and a seventh percentile since 2010. If the large fast-money crowd is already that bearish, selling will have to come from different sources to drive stock prices down.

As well, the BoA Bull & Bear Indicator, which is a contrarian model mainly on sentiment-like signals, is very close to a buy signal at 2.1.

Bearish internals
I interpret these readings as intermediate-term bearish, but the market may be due for a short-term pause. The usually reliable S&P 500 Intermediate-Term Breadth Momentum Oscillator flashed a sell signal on Monday, indicating the path of least resistance is down.

My inner investor is cautiously positioned. My inner trader initiated a short position last week and he expects to hold it until the NYSE McClellan Oscillator reaches an oversold condition.

Stay with the bearish momentum, but beware of bullish reversals.
Disclosure: Long SPXU
There are two charts that are intriguing to me that MIGHT give a hint of the next week or so. The first one is XBI (Bio-Technologhy Index) which is carving out a bottom and could be a long term hold. The other one is one I traded yesterday SMH (semi-conductor index) which is making a secondary bottom. IF this bottom holds we should get a sizable rally similar to 3/14/2022.
We got two inflation numbers this week that are familiar only to people who lived through the seventies. Yet, the market behaved constructively. (Five year forward inflation expectation is still around 3.2% while one year inflation expectation is around 5.3%). Fed will likely hike aggressively in the short term but slowing growth will put a cap on 10 year rates. I think intermediate term bonds (7-10 year) should provide the ‘ballast’ function for the portfolios going forward.
Started to dip my toes in this asset subcategory after being out since late December.
Interesting. Cam made a call for buying TLT a few weeks ago. Since then TLT has lost significant $s. Your call on 7-10 years is suggesting a near bottom in treasuries. I am also looking at tax free munis. Thanks.
Thanks!
I also bought municipal bonds in Taxable accounts. There may be more damage but I will never find the bottom. Will scale in on further weakness or strength.
Closing half of positions in SPY/ QQQ/ FXI in the premarket session due to lack of follow through – odds are I’ll be able to reload at lower prices.
Remainder of SPY/ QQQ/ FXI + all positions in VT off at the open.
All other positions off here (taking a minor loss on BABA).
Minor loss on IEI as well.
TLT. I keep thinking bonds are at a decent buy point…and then yields just keep rising.
Reopening smaller positions in SPY/ QQQ/ VT here. Very short time frame(s).
Closing all positions for a minor loss. No point in staying on the playing field. Decent one-day gains should be good enough.
AAII Sentiment Survey:
*Bullish sentiment this week ranks among the 10th lowest readings in the survey’s history
*Bearish sentiment is again at an unusually high level
https://mobile.twitter.com/AAIISentiment/status/1514593206545039367
Contrarian bullish!
Maybe. Read Hulbert’s take on current bearish sentiment. As I recall, he doesn’t buy it – and thinks it’s more accurate to describe the current backdrop as ‘a peak in detecting peak bearishness.’
It’s still a bear market. Had I held onto the positions I opened Wednesday morning (and closed earlier today) – I would basically be giving back 80% to 100% of my gains…
Cam’s been killing it. I’ll turn bullish when he turns bullish.
In retrospect just amazing how many opportunities were given for investors to get out during this down week. Closing at the lows before a long weekend always makes you wonder if people are just trying to reduce risk over the weekend, but the bearish trend makes sense because what has really changed for the better? The geopolitical divide is intensifying, the situation in China is going to have an impact on global growth. Rising producer prices, potentially accelerating to the upside in Europe (Germany bureau of statistics reported an increase of 22,5% YoY in cost of agricultural products and an 27% increase in business closures) Rising cost pressures and supply chain disruptions are putting real stress on businesses in the construction sector, the fear is that as they will have to charge significantly higher prices there could be a sudden drop off in demand.
The toughest part of trading a bear market is deciding how big a decline will ensue. Sometimes the crowd is right – and I’m slowly transitioning to the view that we may be headed for something more serious than -20%. Maybe even more serious than -50%. At some point valuations revert to the mean. It can take years, or even decades for that to happen. But it may also be as quick and simple as this year.
Just saying.
The key is to get in with puts when everyone agrees that it is not going to that bad, like Wednesday afternoon. “Inflation has peaked and consumer spending is still holding up” – my downside target still remains at roughly SPX ~3950 – not going to happen until PMI numbers drop much further. Flash PMIs coming up next Friday.
Todd Harrison had a story on Minyanville about a guy named Simon. A quiet back office guy at a brokerage house who noticed that it was possible to buy out-of-the-money puts for pennies in the summer of 1987. Very mispriced in his opinion, and he sank a few thousand into those puts. During the Crash in October, he sat back and waited while his colleagues urged him to cash in for 2x, 3x, 10x returns. He waited until the market bottomed. Then retired with his family to the mountains in Switzerland or something
What I don’t get is why JNK is outperforming TLT. This is the first time I see that in the context of a falling market. I get it that the big rush to safety hasn’t happened yet, because TLT is down and at some point there will be flows to safety. I guess it depends on who buys junk and who buys treasuries, but this is the opposite of what usually happens. The only thing I can think of is that there are a lot of shale oil junk bonds and one has to admit that oil and nat gas are up so maybe someone is buying them up.
But JNK does not seem to hold much oil and gas stuff.