In bull markets, valuation generally doesn`t matter very much unless it reaches a nosebleed extreme, such as the NASDAQ Bubble. In bear markets, valuation defines the downside risk in equity prices.
As the Powell Fed has signaled it is dead set on a hawkish policy that does not preclude inducing a recession, valuation will matter soon. The 10-year Treasury yield stands at 2.8% and the S&P 500 forward P/E is 19.0. The last time the 10-year reached these levels was 2028 when the forward P/E traded mostly in a range of 15-16 but bottomed at a panic low of 13.6. The previous episode of a similar 10-year yield was in H2 2013 when the forward P/E was in the range of 13.5-15.

All else being equal, this implies downside risk of -15% to -30% for the S&P 500. That’s why US equity investors are playing with fire.
The Fed’s inflation obsession
Inflation and inflationary expectations are why the Fed has turned so hawkish. The March core CPI report came in at 0.3%, which is well below Street expectations of 0.5%. The bad news is that services CPI has been accelerating for several months. As goods inflation ease from a combination of base effects and the easing of COVID-related supply chain shortages, consumers have shifted spending from goods to services. An acceleration in services CPI is an unwelcome development for Fed officials.
The Fed is well aware of these changes. New York Fed President John Williams stated in a Bloomberg interview: “We are seeing signs that consumers are shifting their pattern from goods to services … It is a pattern I expect to continue, and it is an important part of the story as we watch consumers move back to more normal patterns of spending.”

While core CPI was weaker than expected, PPI came in hot and well ahead of expectations at an astonishing 11.2%. The key question is how well companies will be able pass on these rising input costs to their customers, the effects of the pass-through on corporate margins, and the leakage effects of higher commodity prices on CPI.

While inflation will eventually come under control, the risk for the Powell Fed is that inflationary expectations become unanchored. Already, they have reached a new high for the current expansion, though levels are consistent with readings seen in past cycles.

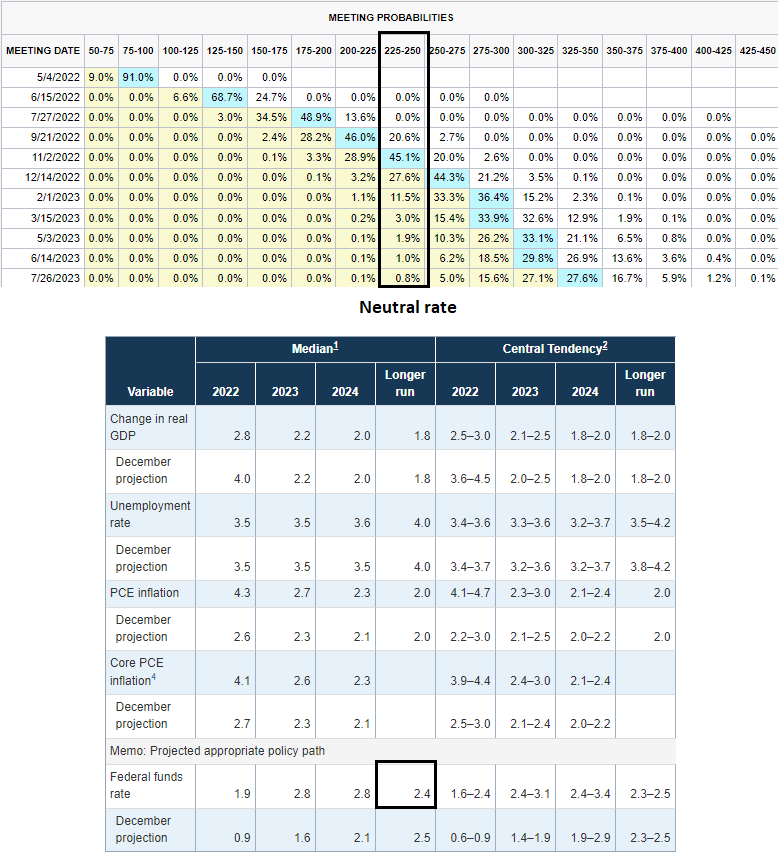
As a consequence, the market is now discounting consecutive half-point rate at the next three FOMC meetings, followed by a staccato series of quarter-point every meeting until February 2023. Fed Funds are expected to reach the Fed’s long run neutral rate of 2.4% by the November meeting and well exceed the Fed’s projected peak rate of 2.8%, according to the Summary of Economic Projections.
More valuation headwinds
In a rising rates environment, earnings growth and estimate revisions are left to do the heavy lifting for equity prices. So far, forward 12-month EPS estimate revisions are still rising, which is a positive.

However, there is more to earnings growth than meets the eye. Jurrien Timmer at Fidelity pointed out that S&P 500 Q1 EPS growth is reported to be 5.1% but all of the gains are attributable to higher oil and gas prices. Q1 EPS growth falls to -0.1% if the energy sector (3.9% of S&P 500 weight) is excluded.

A slowing economy
Q1 earnings season could be a problem. Corporate guidance has turned negative. While EPS beat rates could still be positive as management plays the beat the Street expectations game, the challenge is to maintain a positive tone when discussing the outlook for the remainder of 2022.

As well, top-down indicators point to a slowing economy, which may also create headwinds for earnings expectations for the remainder of 2022. The Citigroup Economic Surprise Index, which measures whether high-frequency economic releases are beating or missing expectations, could be starting to stall.

Job postings on Indeed have plateaued and begun to roll over. When will the deceleration in job gains begin to show up in the Non-Farm Payroll reports?

As well, the slight miss in the March retail sales report shouldn’t have been a surprise. Weakness had been foreshadowed by the Chicago Fed Advance Retail Trade Summary (CARTS).
In the fourth week of March, the Weekly Index of Retail Trade decreased 0.1% on a seasonally adjusted basis after remaining unchanged in the previous week. For the month of March, retail & food services sales excluding motor vehicles & parts (ex. auto) are projected to decrease 2.9% from February on a seasonally adjusted basis and to decrease 4.2% when adjusted for inflation.

From a global perspective, China’s zero-COVID induced lockdowns are concerns for global growth. Gavekal reported that in its survey of the top 100 Chinese cities, all but 13 have imposed some form of quarantine restriction, from no restrictions (level 0) to full lockdown (level 4). More importantly, lockdown intensity is increasing.

High frequency data shows a slowdown in the Chinese economy and the world faces two China shocks. The first is from falling demand from its zero COVID policy, and the second is from a supply shock owing to a slowdown in Chinese production. Neither are growth-friendly and neither will be positive for the corporate earnings.

Defying gravity?
How long can US equity prices defy valuation risk? One hint can be found in the latest BoA Global Fund Manager Survey, which found that global institutions regard the US as a safe haven. In the short run, positive fund flows can partially support the S&P 500.

Before the bulls get too excited, the same survey found that managers believe S&P 500 downside risk is greater than upside potential. As a frame of reference, the survey was conducted April 1 to 7, when the S&P 500 traded in a range of 4500-4540.

In conclusion, the S&P 500 is facing the twin macro risks of a hawkish Fed and deteriorating fundamentals. Based on the current 10-year yield of 2.8% and the current earnings outlook, the historical downside risk is between -10% and -30%. Arguably, the 10-year yield should be much higher in light of recent core CPI readings, which would have even greater dire consequences for equity valuation.

Just Some tactical questions, when is the moment to get rid of sectors that are performing well such as energy, mining and minerals?
When is the moment to enter into TLT and IEF?
More answers on that tomorrow.
Check using a moving average trend line. That way you can stay in even if there is a surprising double or triple knowing you will exit when things turn down. I was there in the inflationary 1970s when energy and mining stocks went up 10 to 20 fold. Remember the bottom line goes up geometrically as the product price rises.
So an oil producer with a cost of $40 and oil at $50 has a $10 profit. At $100 the profit is $60 a 600% gain on a 100% rise in oil.
Hi Cam, as a follow up on Alexander’s question, you had stated awhile back about positioning TLT, and I agreed with you. I also have positioned bond derivatives such as XLU, XLRE, and even got aggressive with some ZROZ. What’s interesting is even though I am down 10% on the TLT, my XLU and now my XLRE are performing well. I believe the fed is tightening into a slowdown, and so does XLU. TLT doesn’t seem so sure.
It does seem counterintuitive but I believe comes down to overall allocation decisions among investors. Top down, bonds are being disinvested due to inflation concerns and aggressive Fed, TLT goes down. Within equity, investors are cautious (excluding special situations like energy) and allocating to defensive sectors, XLU and XRE go up.
TLT should at some point go up when there is a panic, but my take is that for whatever reason the panic is not here yet. If you chart TLT:JNK, you see that JNK is outperforming TLT which makes no sense in the current environment. The volumes on SPY are not huge which usually happens when there is a rush for the exits. How much pain with TLT can one stomach? At some point we do Japan because there is no way to carry this debt burden, only who has the credit side?
I think the reason this is being done stepwise is because they are trying to buy time for the numbers to improve so they can back off. Of course if they did it too fast they would get trashed for it, so perhaps they are choosing the slow bandaid removal method.
I am long Cameco, I think the uranium story is pretty strong with green energy, costs, Russia, increasing reactors, Sprott etc and when it comes right down to it, how many people or businesses want to cut back on electricity? When oil went to 147 a barrel it did it in the summer of 2008, by which time the SPX was already down significantly, so energy could still have some legs.
There is good support for TLT around 105
Re the BofA Global Fund Survey chart in Cam’s previous post-> note that the first extreme sentiment low highlighted was July 2008. After which the SPX declined another -47% through March 2009.
Sometimes the crowd is right.
What if global fund managers are right – and they tend to be right near the beginning of bear markets. SPX 2250 sounds like a dramatic decline – until we remember that we last saw 2250 ~2 years ago. Anything is possible in the markets.
We have a forecasted target on forward PE for S&P500 of 13.5-15.5 at the depths of the impending bear market. Assuming zero earnings growth, the numerical target is around 3300, another 25% down side.
So, what are the assumptions? Inflation will stay elevated till we have a bear market; Fed will not moderate their hawkish view; China will stay in lockdown for extended period; Russia/Ukraine war will drag on.
We likely will have a recession at some point. No one knows the path and the time to that point.
Macro can get worse or get better in a hurry. China comes back from lockdowns in 3-4 weeks, Demand moderates and inflation starts to come down by end of summer, A possible end in sight for the war by summer, etc. I don’t think it will be as dire as Cam has laid out.
Be cautious but not batten down the hatches.
A trading range market is how I am positioned.
Assumption is “all else being equal”, S&P 500 fair value is -10% to -30% from current levels.
Most strategist will agree that Ravindra’s forecast seems like a consensus forecast. In my years of investing and trading I have found that the consensus is seldom right. Based on that premise either the downturn is going to be far worse or not as bad
One of the more obvious risks to the consensus is we see more negative guidance as we progress through Q1 or Q2 earnings season. Forward EPS get revised down, with even greater downside risk implications.
Ravindra made a fantastic call at the depths of the Pandemic low (Summer 2020), to get fully invested. At the present time, I see inflation that I have not seen in my lifetime (I have read about such inflation). Driven by monetary stimulus, supply side constraints and Chinese supply chains still not online, oil being another factor, and a war that seems not letting off, we are in a perfect, hundred year storm. The pandemic broke the back of the global economy and several one off factors seem to be clustered together. To Ravindra’s point, yes, if any one of these factors backs off (war, oil, supply chains, labor shortages), we may dodge a bullet. Unfortunately, supply chains easing is the easiest of the three factors to solve, but this requires China to use mRNA vaccines, which China has so far steadfastly refused. So, we remain hostage to these highly unusual factors though, they are a one off (except supply chains which is more complex). What we are left with is a Federal Reserve that is hell bent on a rapid course of raising rates. Cam made a point of waiting to short the market until the “neck” of an impending H&S pattern breaks. I think it is time to batten the hatches and raise bear market defenses. In the next counter trend rally, I will be looking to lighten up on portfolio positions, even more, and add single inverse SPY (SPDN). The countertrend rally may take us to recent high of 4590, but may fizzle out earlier than that. If we break below February lows, I will be looking to add SPXU.
I think the “neck” of the H&S just broke….
On my momentum update this weekend, the Regular Growth and Innovative Growth ETFs had a huge drop in rankings. They are failing badly after making an oversold low on March 15 that many thought was a strong support line of defense. The action last week tells me that low is going to be taken out by all of these groups and all hell will break out afterwards.
The rally was doomed because bonds were collapsing with higher rates and that takes the rug out from under Growth.
My Cyclical Factor work shows Low Volatility Factor now solidly leading the other three Value, Growth and Small Cap on a three month lookback. This is clear Winter action. In a bull market, boring, low growth company stocks in the Low Vol index trail in performance. In a bear market (Winter), professional portfolio managers who must stay fully invested, shift to the safer Low Vol stocks.
Low Vol outperformed briefly in December as a warning of Investing Autumn season in place and Winter coming. You saw my posts about that. Low Vol outperformance then became more pronounced over the first quarter until solidly leading over the last month.
Spring is nowhere in sight.
I see NASDAQ futures are down 2.5%. Nasty