Preface: Explaining our market timing models
We maintain several market timing models, each with differing time horizons. The “Ultimate Market Timing Model” is a long-term market timing model based on the research outlined in our post, Building the ultimate market timing model. This model tends to generate only a handful of signals each decade.
The Trend Asset Allocation Model is an asset allocation model that applies trend following principles based on the inputs of global stock and commodity price. This model has a shorter time horizon and tends to turn over about 4-6 times a year. The performance and full details of a model portfolio based on the out-of-sample signals of the Trend Model can bsoe found here.

My inner trader uses a trading model, which is a blend of price momentum (is the Trend Model becoming more bullish, or bearish?) and overbought/oversold extremes (don’t buy if the trend is overbought, and vice versa). Subscribers receive real-time alerts of model changes, and a hypothetical trading record of the email alerts is updated weekly here. The hypothetical trading record of the trading model of the real-time alerts that began in March 2016 is shown below.

The latest signals of each model are as follows:
- Ultimate market timing model: Buy equities
- Trend Model signal: Bearish
- Trading model: Neutral
Update schedule: I generally update model readings on my site on weekends and tweet mid-week observations at @humblestudent. Subscribers receive real-time alerts of trading model changes, and a hypothetical trading record of those email alerts is shown here.
Subscribers can access the latest signal in real-time here.
A bifurcated market
As the S&P 500 struggles to hold its 50 dma, an unusual condition is occurring in the US equity market. The intermediate-term technical outlook is decidedly bearish, but the survey sentiment has reached a crowded short condition, which is contrarian bullish. This week, I offer some canaries in the coalmine as a way to resolve the wildly differing views of the market.

Crowded short sentiment
I was shocked to see a complete collapse in the weekly AAII bullish sentiment which took the bull-bear spread to -32.6, a reading last seen in 2011 at the height of the Greek Crisis. While bearish sentiment did not surge to 2011 levels, they are nevertheless elevated.

A similar sentiment extreme was also evident in the Investors Intelligence survey, which did see a historically high level of bearishness.

The level of bearishness was also confirmed by the CNBC All-American Survey, which found that 28% of respondents who invested in the stock market believe that it’s a good time to invest in stocks, compared to 48% who don’t. These readings have deteriorated since the last time the survey was conducted in December.

One drawback of survey-based sentiment is it asks respondents what they think and does not indicate what they’re doing with their money. Option-based sentiment, which measures dollars-and-cents sentiment, is nowhere near a bearish extreme. The term structure of the VIX is far from inverted, which indicates fear.

I was also surprised by the results of Helene Meisler’s (unscientific) weekly Twitter sentiment poll, which came in at zero net bull-bear reading. Survey sentiment has usually turned bearish when stock prices turn soft in the previous week. I interpret these conditions as the market has further room to fall.

Technical caution
The most worrisome development is bearishness of intermediate-term market internals. The usually reliable S&P 500 Intermediate-Term Breadth Momentum Oscillator (ITBM) recently flashed a sell signal. The ITBM’s sell signals were correct about two-thirds of the time in the last five years (red=bearish outcomes, grey=bullish).

In addition, a warning was also sounded by the Hindenburg Omen. The Hindenburg Omen depends on three conditions:
- An established uptrend;
- Elevated new highs and new lows, indicating indecision; and
- A bearish momentum break.
The Omen does not turn bearish until we see a cluster of signals within a short period of time, which has not happened yet.

The canaries in the coalmine
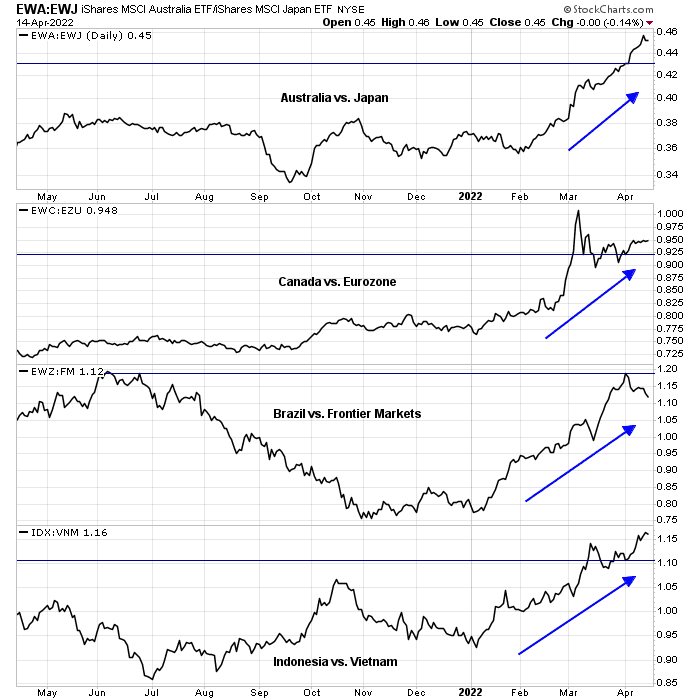
How should investors and traders react to these widely differing market interpretations? I rely on the pairs trades that I identified in the past two weeks, which I call my canaries in the market coalmine.
As a reminder, the pairs have a number of factor exposures to be aware of:
- Long price momentum;
- Long commodity producers and short either importers at a country level or cyclicals at an industry level; and
- Slight negative beta, which may be a product of the price momentum factor.
Here is a report card of the country and regional pairs identified two weeks ago (see How the commodity tail wags the stock market dog), where the horizontal lines indicate the publication date price levels. Three of the four pairs are profitable and the remaining unprofitable pair, long Brazil/short frontier markets, remains in a relative uptrend. I see no reason to exit any of these positions.
Last week’s factor and industry pairs show more of a mixed result (see Secrets of stable returns in a chaotic bear market). While most are in relative uptrends, some are consolidating sideways. I also see no reason to exit of these positions – yet.
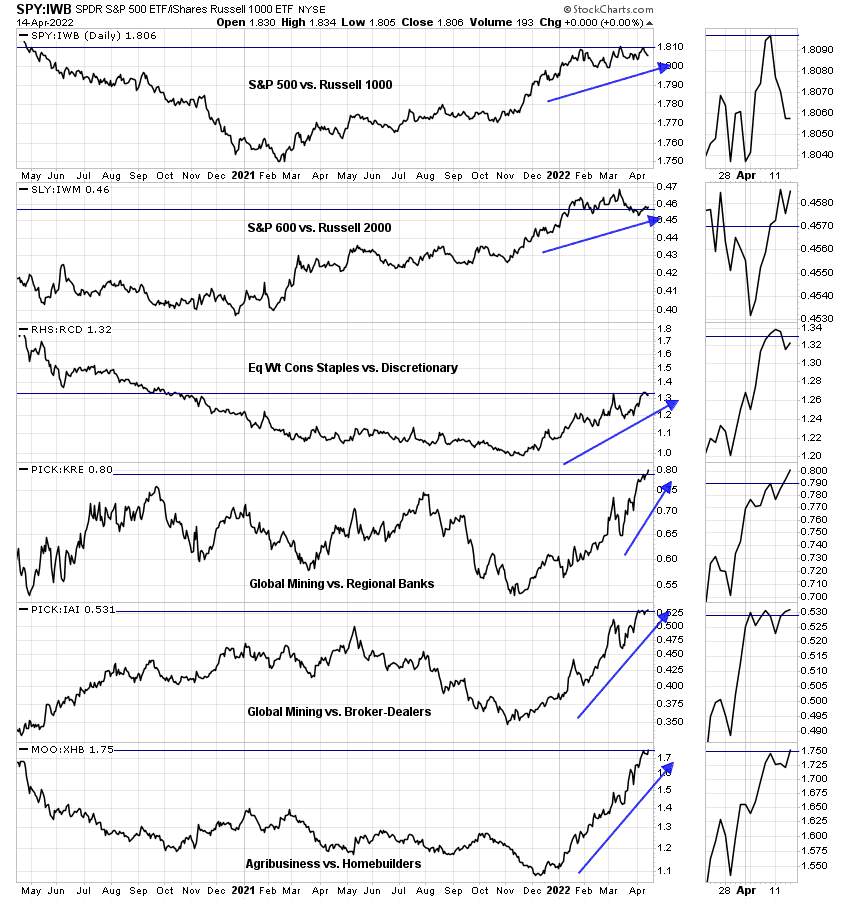
As long as the majority of these pairs remain in relative uptrends, my bearish outlook remains intact. Nevertheless, survey sentiment readings present a risk for short-term bear market rallies.
An ESG mean-reverting pair
As all of the pairs introduced have a positive price momentum exposure, I am introducing a new pair trade with a mean-reverting feature which has the added bonus of allowing investors to passively beat the gold mining index on a long-term basis. Moreover, the approach should be compliant on most ESG metrics.
Making a directional call on gold prices has been difficult. In the past, gold was highly correlated with TIPS but they have each gone in their own direction in the past year. The divergence can be partly explained by the rise in a geopolitical risk premium. Investors can find a better way to profit by trading a gold/gold mining stock pair.

To explain, a gold mine can be modeled as a series of annual call options with the strike price set at the cost of production. To estimate the value of the mine, just multiply the value of the option by the projected ounces of production and sum the value of the options over the expected life of the mine, and adding in an inflation factor to production costs every year. An investor can model the value of a gold mining company by summing the value of its mines. As most gold miners tend to be mainly financed with equity, valuation is relatively simple using this technique.
There are some limitations to this modeling approach. It will not capture the upside potential from new discoveries. On the other hand, it will sidestep the risk of labor strife and production problems such as mine fires and floods. Moreover, an investment approach that owns either physical or paper gold compared to the messiness of owning gold mines should be ESG compliant.
I produced a research report in 2006 in a previous life using this technique that compared the value of the gold mining index to the model value and the fit was remarkably good. The report is available here (see page 6).
Here is the problem for the gold miners. Cash costs for the gold mining industry were $261/ounce. They have skyrocketed since then as old deposits became depleted and they were replaced by new mines with higher costs. Imagine if you bought a long-term call option with an exercise price of X, but discovered that, some time later, X had risen without your knowledge. The value of your call option would have fallen in response. That’s the long-term problem with owning gold mining stocks.
The chart below shows the long GLD/short GDX pair. The pair is trading at a support zone that stretches back to 2016. While the ratio has been lower in the distant past, the lower values can be explained in the context of a much lower cash cost regime, which can be modeled as a lower strike price.
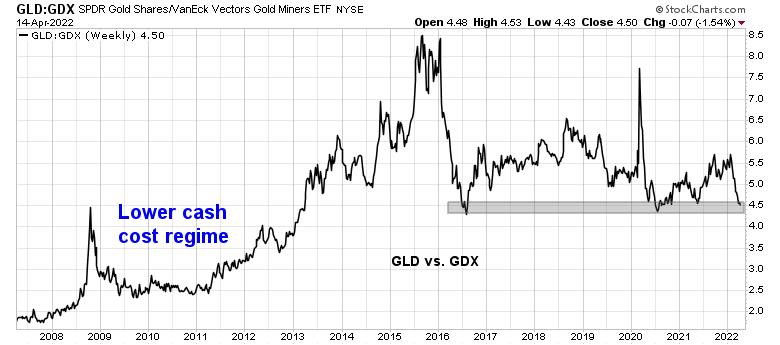
This is a mean-reverting pair trade worthy of consideration. In addition, investors can take advantage of this relationship to outperform any gold mining stock index over the long term.
In conclusion, intermediate-term technical indicators remain bearish but survey-based sentiment indicates crowded short conditions, which is contrarian bullish. As long as my pairs trading factors remain in uptrends, I am inclined to remain cautious on the equity outlook.
As a consequence, my inner investor is cautiously positioned and underweight equities relative to benchmark. Subscribers received an email alert on Thursday that my inner trader had covered his short position and stepped to the sidelines until there is greater clarity on the short-term outlook.
Disclosure: Long SLY/Short IWM
“Imagine if you bought a long-term call option with an exercise price of X, but discovered that, some time later, X had risen without your knowledge”.
Cam, Is the option on price of gold or gold mining stock or some other variable?
Gold stocks can be modeled as a series of call option on the gold price. But the strike price migrate upwards because lower cost old mines get played out and they are replaced with higher cost mines. Hence the rising strike price = lower than expected stock price.
Makes sense. Thanks.
Cam,
A) “The chart below shows the long GLD/short GDX pair”.
If this is a mean reverting pair, one should be long gold and short GDX (this pair has underperformed since 2016).
However, if cost of gold mining continues to rise (because of energy costs, lower yields from mining ore etc.), one should be long GDX, short GLD. I am unclear what is the best trade here, going forward and why. Thanks.
B) Divergence of TIPS and GLD may be of technical nature, or real. I presume it is real, because, real interest rates are becoming less negative (see one of your previous graphs). You had explained a few months ago, the relationship of gold price to real interest rates, and this graph shows it elegantly.
I don’t understand why you would want to own a business whose margins are falling (rising production cost) when you could own the underlying product.
Because the prices of miners have a torque over the price of gold even if the underlying costs are rising as long as the price of gold rises more than the cost of mining it, i.e., the margins rise.
Of course, there are risks to owning a business as opposed to betting on the commodity directly.
A good option may be to own the royalty companies (e.g. RGLD or SAND) where your risks are fairly diversified and you don’t care about the costs of mining.
The royalty companies can mitigate that risk, but they nevertheless present operational risk, such as mine fires, floods, etc.
Thanks.
There are some long term ramifications of Western Governments seizing Russian Assets. I am not sure what they are. However, it is important to note that some major trend lines are being broken like dollar-yen. U.S 30 year bonds. I don’t know if that has some bearing on Gold and Gold Miners. The thing to keep in mind is that something glacial is slowly happening. Most of us are not aware that Newmont Mining (NEM) and Royal Gold (RGLD) are making 40 year highs NOT YEARLY HIGHS!!!! Ken, personally I think has witnessed Gold Mining stocks go up 5-10 X. It is possible that this could be the start of something big – similar to the move in technology stocks. If that is the case old ratios will not hold. Manias are hysterical with no fundamental justification.
Expand your argument to old line value stocks, starting from Oil supermajors, cereal makers, Tobacco majors, banks (?), Big pharma. Many of these were cheap and now making new highs, and have further headroom. A lot of these companies also have high quality companies with good balance sheets.
Ken has been pounding the table on EWC/Canada (so far no cigar).
My discussion was limited to gold and gold stock because of (a)the ramifications of the seizure of Russian assets. (b) a commodity play. (c) the beginning of a long term bull market in precious metals including silver which is relative undervalued based on historical valuations.
Seizure of Russian assets does not set a precedence. That’s the price you pay when you live in a USD based global banking system.
When the US froze Afghan government FX reserves after the Taliban takeover, they arbitrarily took about half of the funds and gave it to 9/11 victim families.
Cam I have to disagree with your premise that the economy of Afghanistan can be compared to Russia. If you are China or India and are seeing that your foreign exchange reserves and gold can be de-facto confiscated because your policies do not align with western governments it will give you pause. It is quite likely that Governments in China, India, Russia and Iran are trying to find a substitute for dollar trading. I am raising the possibility whatever form of trading they agree to might have a portion of it allocated in the form of gold.
I don’t think Cam was comparing the economies of Russia and Afghanistan. He was just stating that the US first set the precedent of seizing reserves / assets with Afghanistan and then just giving them away to 9/11 victims. It is unfortunate that this did not get enough media attention.
Other countries not fully aligned with the Western bloc have to be seriously considering non-USD options not just for trading but also for holding their reserves. I think most if not all of them already have a portion allocated to gold. Maybe they will hold even a higher portion of their assets in gold now.
I have to say that I don’t get gold. Dig it up at great cost only to put it back in a hole aka vault. Yes it’s rare, shiny, pretty and has a long history of being valued basically around the world….If people think we will experience a money printing spree beyond all reason, then I see why some want to hedge with gold which would work as long as the faith in gold persists.
Personally I prefer silver, it is also rare but much more useful. My definition of wealth is having a lot of what people want….goats, gold, bitcoin, whatever and best is if it is what people will want in the future, so the goats have lost value, gold is holding, and bitcoin is not very useful (I wonder what it’s value would be if nobody wants it, maybe I can trade for goatcoins)
But if something is very useful and will most likely be very useful in the future is where I think one should look.
Energy and food, we cannot do without.
Anything that improves long term productivity should also do well.
Entertainment also has been around campfires of yore to the present, but it is evolving. My kids spend more time on their phones than watching traditional TV (they are in their 20s), so entertainment will be around but in what format? Viral artists building a following and capitalizing on it? Where does that leave NFLX?
Which is why a luddite like me sticks to simple things like energy, commodities and things I fool myself into thinking I can understand.
Momentum is a successful because prices start a long-term trend (up or down) for some new reason (or narrative) and it goes much further and longer than people expect. Because we anchor on recent prices for our sense of value, it is easy to sell a winning stock (or buy one in a losing trend). This slows the march to the true new value far in the unknown future.
Gold could be heading for $2,000 or much higher. As it rises, investors will feel pressure to sell due to anchoring bias. The only way to stay with it (except for crazed gold bugs) is to commit to owning it as long as it is outperforming the SPX over your preferred time (6 months 3 or 12 whatever) when it fails commit to sell and buy back when Momentum returns.
Doing this you can tell your grandchildren how you brilliantly held gold when it went to the moon and inflation ravaged the land.
Well I looked at a weekly chart of GLD:SPY and it seems to be still in a downtrend. SLV:SPY seems more like a bottom but still not positive. So what should one do? Look at these relative performances while looking at a chart of the underlying commodity, eg GLD, and if GLD:SPY turns to an uptrend then look for when GLD breaks to the upside in any given pattern/consolidation?
Only when I do that, it works nicely for the bull in gold leading up to 2011, but is treacherous since around 2016.
It’s possible that we are due for a new bull in gold along with a collapse in SPY in which case the ratio needs to go a lot higher to get an uptrend.
Looking at a chart back to 1970, the low point was around 2000, so in a sense we could be making a higher low, only not there yet. How much the equities bubble has distorted things, I don’t know.
Here is one of my momentum charts on Gold Bullion ETF (GLD).
https://refini.tv/3Em37Lk
The top chart of three is the 6 month classic lookback of GLD versus the Equal Weight S&P 500 ETF. It shows the positive momentum clearing starting in February.
The middle chart rebases GLD to the stock market peak in November to show how anti-fragile GLD has been. It also shows a February outperformance versus the falling stock market.
The final lower chart is my rebase price to the recent intermediate stock market low on March 15. Gold lagged this rally until this week when Growth has failed and Defensives have reasserted their outperformance.
On a momentum basis, these charts are CHECK, CHECK, CHECK
I am using lower beta GLD rather than the miners because I’m not trying to have huge gains with high beta during this high risk/reward chaos. Often, if general markets plunge, the gold miners fall with it even when bullion goes up. Margin selling by traders effects the good and the bad stocks they are forced to sell.
I want to come out the other side of this coming shit-storm (technical investing term, check Investopedia) maybe making a bit until Spring arrives and a new easy cycle starts for big safe gains.
Thanks Ken
Thanks, Ken.
Good argument for owning bullion vs. miners.
“Often, if general markets plunge, the gold miners fall with it even when bullion goes up. Margin selling by traders effects the good and the bad stocks they are forced to sell.”
Another thing I don’t get. OK there is this huge debt, but for every unit of debt there is a unit of credit. So who holds the credit? Is it mostly fumes because of fractional reserves for lending, combined with bonds that are borrowings from the future that will never be repaid?
A giant Ponzi scheme?
It depends on what the debt is used for. Using it for capex builds productive capacity and grows the economy.
Yes, but all of this debt that has piled on in the last 10 years has not been put into productive capacity. The balance sheet of the Fed is pseudo-marked to market..There is no way they could sell their 8 trillion in bonds, there is no one to buy them, and this will continue because we are not getting a balanced budget, so the treasury will need more and so these bonds will stay on the books as being good but only as long as the game continues.
I don’t know how much money has gone into Capex, but I suspect that a lot more has gone into mortgages, stock buybacks and other unproductive avenues.
There is this curious thing about doing refis, I have done a few over the last few years. You refi and after 6 months your account is punted to another servicer, what’s with the 6 months? But I wonder if it ties in with the huge jump in mortgage rates and the Fed saying it won’t be buying MBS….so the mortgage potatoes will stay in hands other than the Fed. There is a lead time for the tightening, I don’t know how this compares to the 6 months, and my last refi was in Jan 2021 so I have no recent experience. In the housing bubble pre 2006, it was CDOs and dumping this product onto others that led to the NINJA loans etc, now we have the Fed buying MBS but soon to stop.
So they have a choice of letting things crash and burn to oblivion, or let everybody get scared to death and then stimulate like crazy. Are we any different from all the prior regimes of fiat? I say no.
There are some nasty moving parts though…stay safe and nimble
I think it is a giant Ponzi scheme that will never blow up. It will be paid with fresh bonds. Governments just have to maintain certain credibility. Argentina and Venezuela are some of the exceptions. In fact democracies need to do that to gain elections, IMHO. China and Russia do not need the debt resource, since they have other resources
My concern is if the dollar loses world reserve currency status. What happens if all those dollars come back? The dollar is showing recent strength and yet the balance of trade is close to a trillion bucks. This makes no sense.
If all those treasuries held by foreign central banks get dumped, who will buy them, the Fed?
I don’t know how this will play out, but I suspect our dear friend Mr. Volatility will be in the neighborhood.
Sometimes it’s good to be old, less years left to get steamrolled.
It is hard to imagine the USD losing the world reserve currency status because there is still no other alternative. Hard to see either Euro or Yuan become viable options.
https://www.nytimes.com/2022/04/15/opinion/us-dollar-dominance.html
“The answer is that there are self-reinforcing feedback loops, in which people use dollars because other people use dollars.”
This is sort of like why are we on FB or Twitter. Because other people we want to connect to are there.
Network effects!
Well, the sanctions give incentive. If the Chinese and Russians and oil countries and BRICs not mentioned start moving away from the USD, and things go digital then it could happen faster than we think.
I suspect that the supply bottlenecks are not 2 way, ie China is not waiting for much of our stuff.
What would happen if China said “pay us in yuan”? Would we stop our 800 billion a year trade imbalance? Not overnight.
This does not mean it will happen, but no world reserve currency has lasted forever, why should this time be different?
China is a major exporter to the US. It gets paid in USD. What do you think happens to that USD?
Short answer: It gets invested (mostly) in USTs.
Same thing with OPEC during the 70’s and 80’s. They received USD for their oil. They need to recycle those dollars.
But China has been cutting back it’s holdings of US treasuries, so I’m not sure where those $s go, but they go somewhere. 800 billion is a lot.
Someone has to say it – today’s post is a gold mine! Or at least here is hope it is going to turn out to be one.
A rather long and detailed article on what led to the Russia-Ukraine war.
Retired Swiss Military-Intelligence Officer: ‘Is it Possible to Actually Know What Has Been And is Going on in Ukraine?’
https://www.sott.net/article/466340-Retired-Swiss-Military-Intelligence-Officer-Is-it-Possible-to-Actually-Know-What-Has-Been-And-is-Going-on-in-Ukraine
I just don’t get gold.
Assume borrow cost at 4%. Inflation at 8%.
If I borrow and buy gold, a year later it has to go up at lest 4% to stay even.
If I use cash and buy, there is opportunity cost of at least one year treasury bond.
So, what inherently makes gold go up?
Econ 101. Demand greater than supply. And why would demand be higher?
Macro factors? Russia, China, India etc. holding more of their reserves in gold? Is this a sustainable trend?
All this time inflation is eating away at the cash value of the asset.
Try momentum (which I suck at), but for example, if you think that the dollar will weaken because at some point the market will buckle under the Fed’s stance and Powell caves. If gold goes down in the panic (which often happens) but then shows some strength relative to SPY and looks ready to break to new highs…this would be promising. Right now gold is hanging in there in spite of rising interest rates and a strong dollar which implies some strength, but remember, I suck. Still, if the $ starts to weaken and gold is stronger than the SPX then there could be a tailwind.OTOH, why isn’t gold at a new high with what is going on in the world.
As an aside, look at charts of NVDA, ARKK, AMD and what do you see? An insane move after march 2020…millenials with stimi-checks? After the high in December they are all off the cliff…this could be herding
Cam,
It would be helpful to show when you suggested the pair trades on the charts, if feasible. Thanks!
Hmmm, choppy session but daily hammer candle.
Restarting a few positions in the premarket session.
SPY/ QQQ/ FXI/ BABA.
Adding positions in VT and SMH.
All positions off here for nice 30-minutes gains.
Only loss was…TLT! No end in sight to the bond debacle.
GDX here.
Closing GDX here for a minor loss.
Scaling into IEI and TLT here.
Adding positions in TIP and IEF.