I recently suggested a number of long/short pair trades as a way of achieving performance in an uncertain and choppy market. Inflation hedge vehicles have begun to underperform, and the subsequent performance of the pairs is revealing of the factors driving the current market environment.
The four regional pairs were based on a theme of long producer and short importers in order to gain exposure to an inflationary environment. Three of the four have rolled over (horizontal lines indicate the pair price levels on the date of publication).

Of the US-centric pairs, the defensive pairs with exposure to quality (long S&P and short Russell and long consumer staples and short discretionary) have performed reasonably well. but the long inflation hedge and short cyclical pairs have turned down.
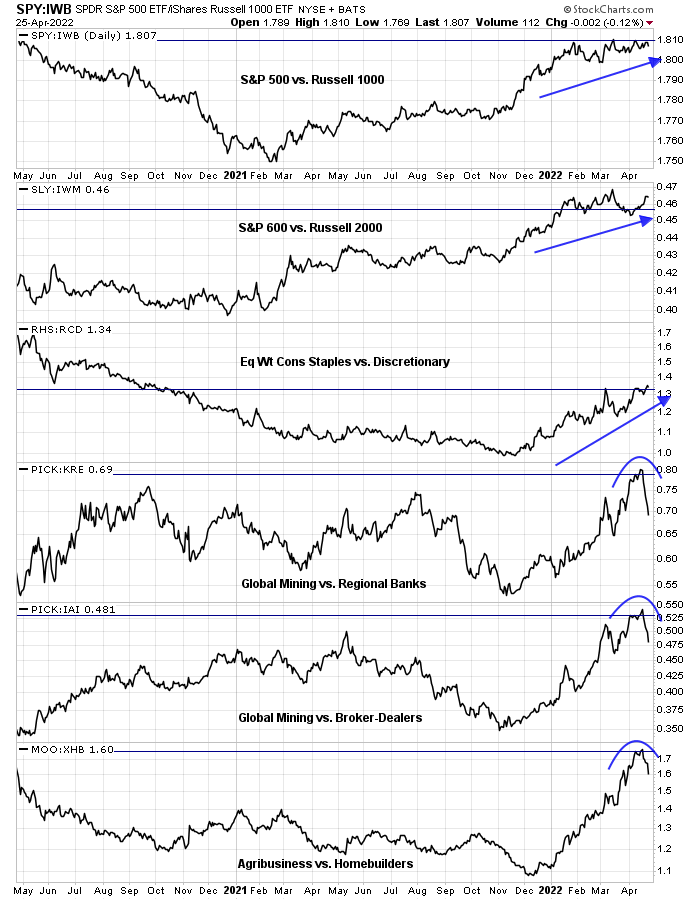
The last pair, long gold and short gold miners, is a mean-reverting pair that has exhibited strong positive performance.

Inflation factor analysis
How can investors interpret these changes in factor exposures? In particular, why are the inflation hedge vehicles skidding? An analysis of global inflation hedge sectors such as energy, mining, agribusiness, and real estate reveals that all are in relative uptrends compared to ACWI with one exception. Global mining has tanked, though these stocks have been very choppy in the past.
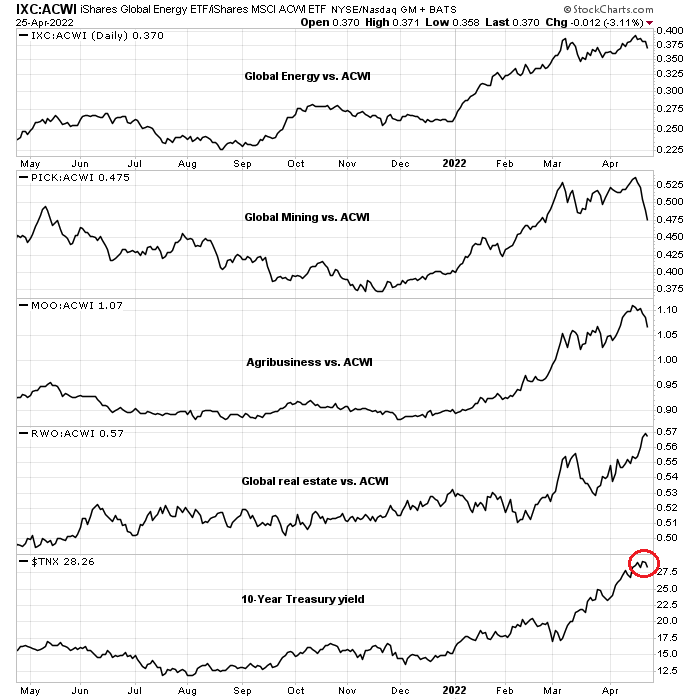
Weakness in inflation hedge vehicles should be interpreted as investor fear of central bankers tightening the global economy into recession. If that’s the case, the 10-year Treasury yield should be falling – and it did not decline until today.
An alternative explanation for the recent weakness in inflation factor exposure is the rising fears in the stock market. When stocks all fall in a panic, asset and factor correlations converge to 1.
An oversold market
I recently wrote that the market had unfinished business to the downside (see Sentiment: This time is different). Much of the unfinished business may be temporarily complete when global markets turned deep red to open the new week when Asian markets sold off on the fears of a Beijing lockdown.
At least two of the components of my bottom spotting model either flash buy signals or flashed outright buy signals Friday, which is an indication that the short-term risk/reward is tilted to the upside. The VIX Index has already risen above its upper Bollinger Band, which indicates an oversold market. The NYSE McClellan Oscillator was already very near an oversold level. TRIN reached 1.96 on Friday, which is very close to the 2.0 level that’s a signal of a margin clerk driven liquidation market. Monday’s late day recovery after a day of weakness cements the thesis of a short-term bottom.

Traders shouldn’t mistake any relief rally for an intermediate-term market bottom. For some perspective, the CBOE put/call ratio spiked to levels on Friday that were last seen during the March 2020 panic bottom, but readings could be a one-day data blip. The 10-day moving average is nowhere near March 2020 levels. In addition, the percentage of S&P 500 bullish on point and figure charts cannot be interpreted as even oversold.

The key caveat is Q1 earnings season is in full swing and several mega-cap technology companies are scheduled to report this week. Be prepared for further volatility.

In conclusion, I am inclined to give the long inflation hedge pairs trades the benefit of the doubt. In all likelihood, they are being sold along with other equity positions in a panic liquidation where all correlations converge to 1. The market is oversold and a relief rally is on the horizon. Wait for the rally to see if the inflation hedge factors are still weakening before making a judgment.
Disclosure: Long SPXL, SLY. Short IWM.
Great trading call this morning! I missed it due to being cheap on the plane! Hopefully get another good entry point this week.
Thought of entering long at close but decided to wait till tomorrow. It’s more oversold but does it reduce risk of going long?
Good trading call yesterday. I am worried that we get a haircut after tech earnings this week.
Bonds doing the heavy lifting again this morning.
Re the equity market- my opinion is that now is not the time to sell. It may be too early to go all in but it’s certainly not a time to be selling.
Maximum pain. It’s amazing how often that principle predicts market movements.
Yesterday’s long purchases are all underwater – as are all long purchases made since the March lows.
Personally, I’m quite confident re the ST outlook for stocks. Should the stock market tumble from here, I’ll take the hit without a second thought and move on – I would be taking a relatively modest loss. That’s due to a combination of asset allocation, position sizing, and pure luck (in terms of bond purchases). Currently 40% cash/ 35% bonds/ 25% equities.
QQQ prints new 52-wk lows after hours on further declines in MSFT and GOOG.
For some reason the QQQ prints have me turning even more bullish.
MSFT now green.
MSFT – which had been down as much as -2% post-earnings is now +6%. GOOG – which had traded down as much as -6% now just -2.5%.
QQQ – which had traded ~312-and-change now at 316.
Crowd psychology is very difficult to predict. Sometimes it just comes down to ‘I think current prices represent a good entry point.’
I would hazard a guess that ST capitulation occurred in the QQQ over the past two hours. I would be very surprised to see 312 revisited in Wednesday’s session.
‘Helene Meisler @hmeisler· 2h
Just break already’
I don’t follow her but that was funny in a stupid kind of way. Don’t be surprise to see a midday reversal in the next few days, a replay from 2022-01-24 which was the bottom for about one month.
https://ibi.sandisk.com/action/share/fa038b0d-d50d-42e4-8856-93342d7cd977
If you had follow Rob Hanna’s observation of buying on Friday close when S&P was down >2.5% and waited two days and sell on close, which normally has been a high efficiency trade, you would have lost about 2.2% on close of trading today. Overall, this strategy did not work well if price action had just flipped parabolic SAR in an already highly negative price momentum (S&P was already down 1.5% last Thursday).
https://ibi.sandisk.com/action/share/08843c15-03e4-43ca-bd7e-bff3faa8f7cf
Added a filter with momentum(Close, 4) > -7.5 and the profit factor will rise nearly 10 fold from 2.83 to 22.3 with about 25% fewer trades. In retrospect it is kind of intuitive that if price is dropping too fast, it may not recover in time in a two day window but if you hold too long your drawdown can become too high. These types of trades do come in duplicates, often a few months apart when there are waves of sell offs, so we may see this again fairly soon.
https://ibi.sandisk.com/action/share/ad664c6f-ef55-41a5-87cc-4347af60382a
Still holding long. Man that was scary.
The bottoming process continues. I think we’ll look back in two weeks and realize Monday and Tuesday represented decent intermediate-term entries.
How about the shrink of the economy? Are we in a good entry point for IEF or TLT.
?