Is the universe unfolding as it should? Most technical and sentiment indicators argue for a near-term double bottom in the S&P 500. The June bottom was the initial capitulation bottom. The market rallied and it is poised to weaken and re-test the old lows in the near future. That’s when the new bull begins.
The new bull narrative sounds far too easy. Macro and fundamental factors argue for further downside potential. The Powell Fed is in a “whatever it takes” mode to tame inflation. The 2-year Treasury yield has been climbing relentlessly, which is an indication of rising market expectations of a terminal Fed Funds rate. Forward P/E valuations are becoming increasingly challenging even as the E in the P/E ratio declines ahead of a likely recession. If support at the June low doesn’t hold, SPY faces a possible air pocket and a rapid fall to the 260-320 support zone, which represents considerable downside risk from current levels.
The bull case
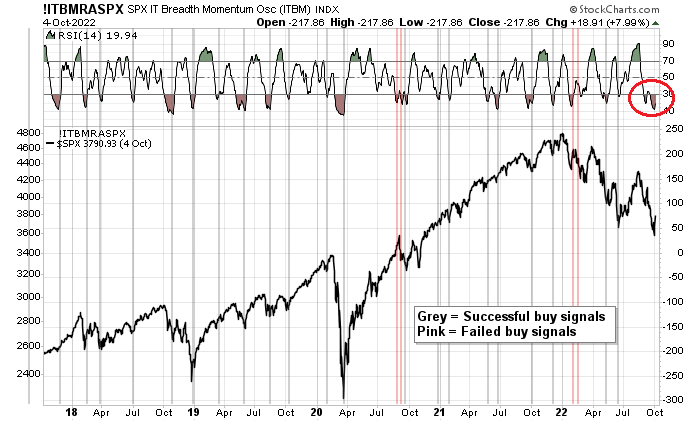
The bull case is easy to make. The percentage of S&P 500 stocks above their 50 dma fell below 5% at the June low, which was the signal for a price momentum wipeout (pink vertical lines). The indicator flashed a buy signal by quickly rebounding to over 90% (grey vertical lines). The stock market has continued to rise after every single buy signal in the last 20 years.
With the S&P 500 about to undergo the typically weak September seasonality in a mid-term election year, investors are faced with a potential buying opportunity in the coming weeks that could yield a bonanza by year-end and beyond.
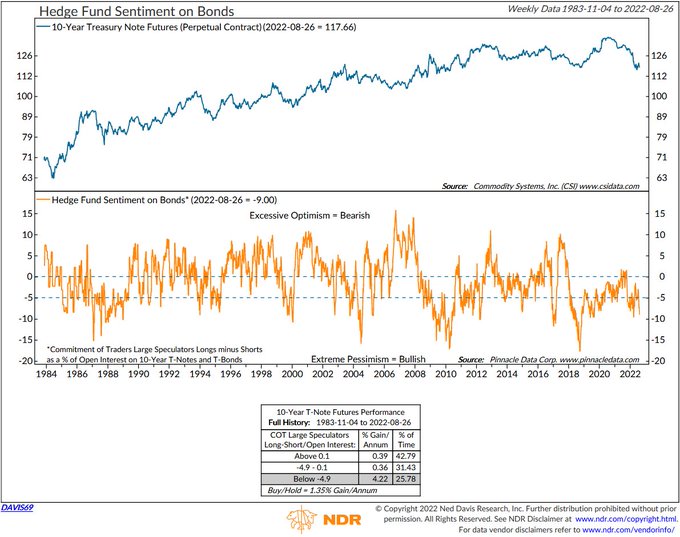
The latest BoA Global Fund Manager Survey showed that global equity allocation fell to an all-time low, indicating widespread panic, which is contrarian bullish. These excessively bearish sentiment conditions should act to put a floor on stock prices if the market were to weaken during its period of negative seasonality.
Putting it all together, the market is poised for a major market bottom in the coming weeks. What more could anyone ask for?
Fundamental and macro doubts
It sounds just too easy and the Federal Reserve begs to differ.
Marketwatch reported that Anatole Kaletsky of Gavekal warned that the Fed’s inflation fight isn’t over and the Fed won’t respond if the economy falls into recession.
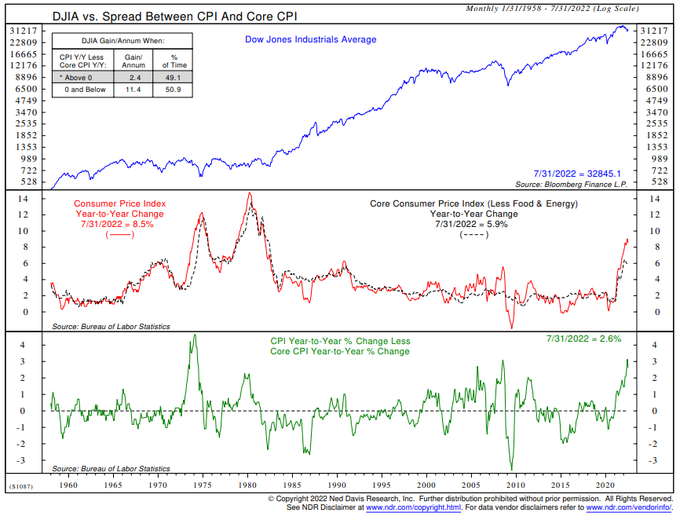
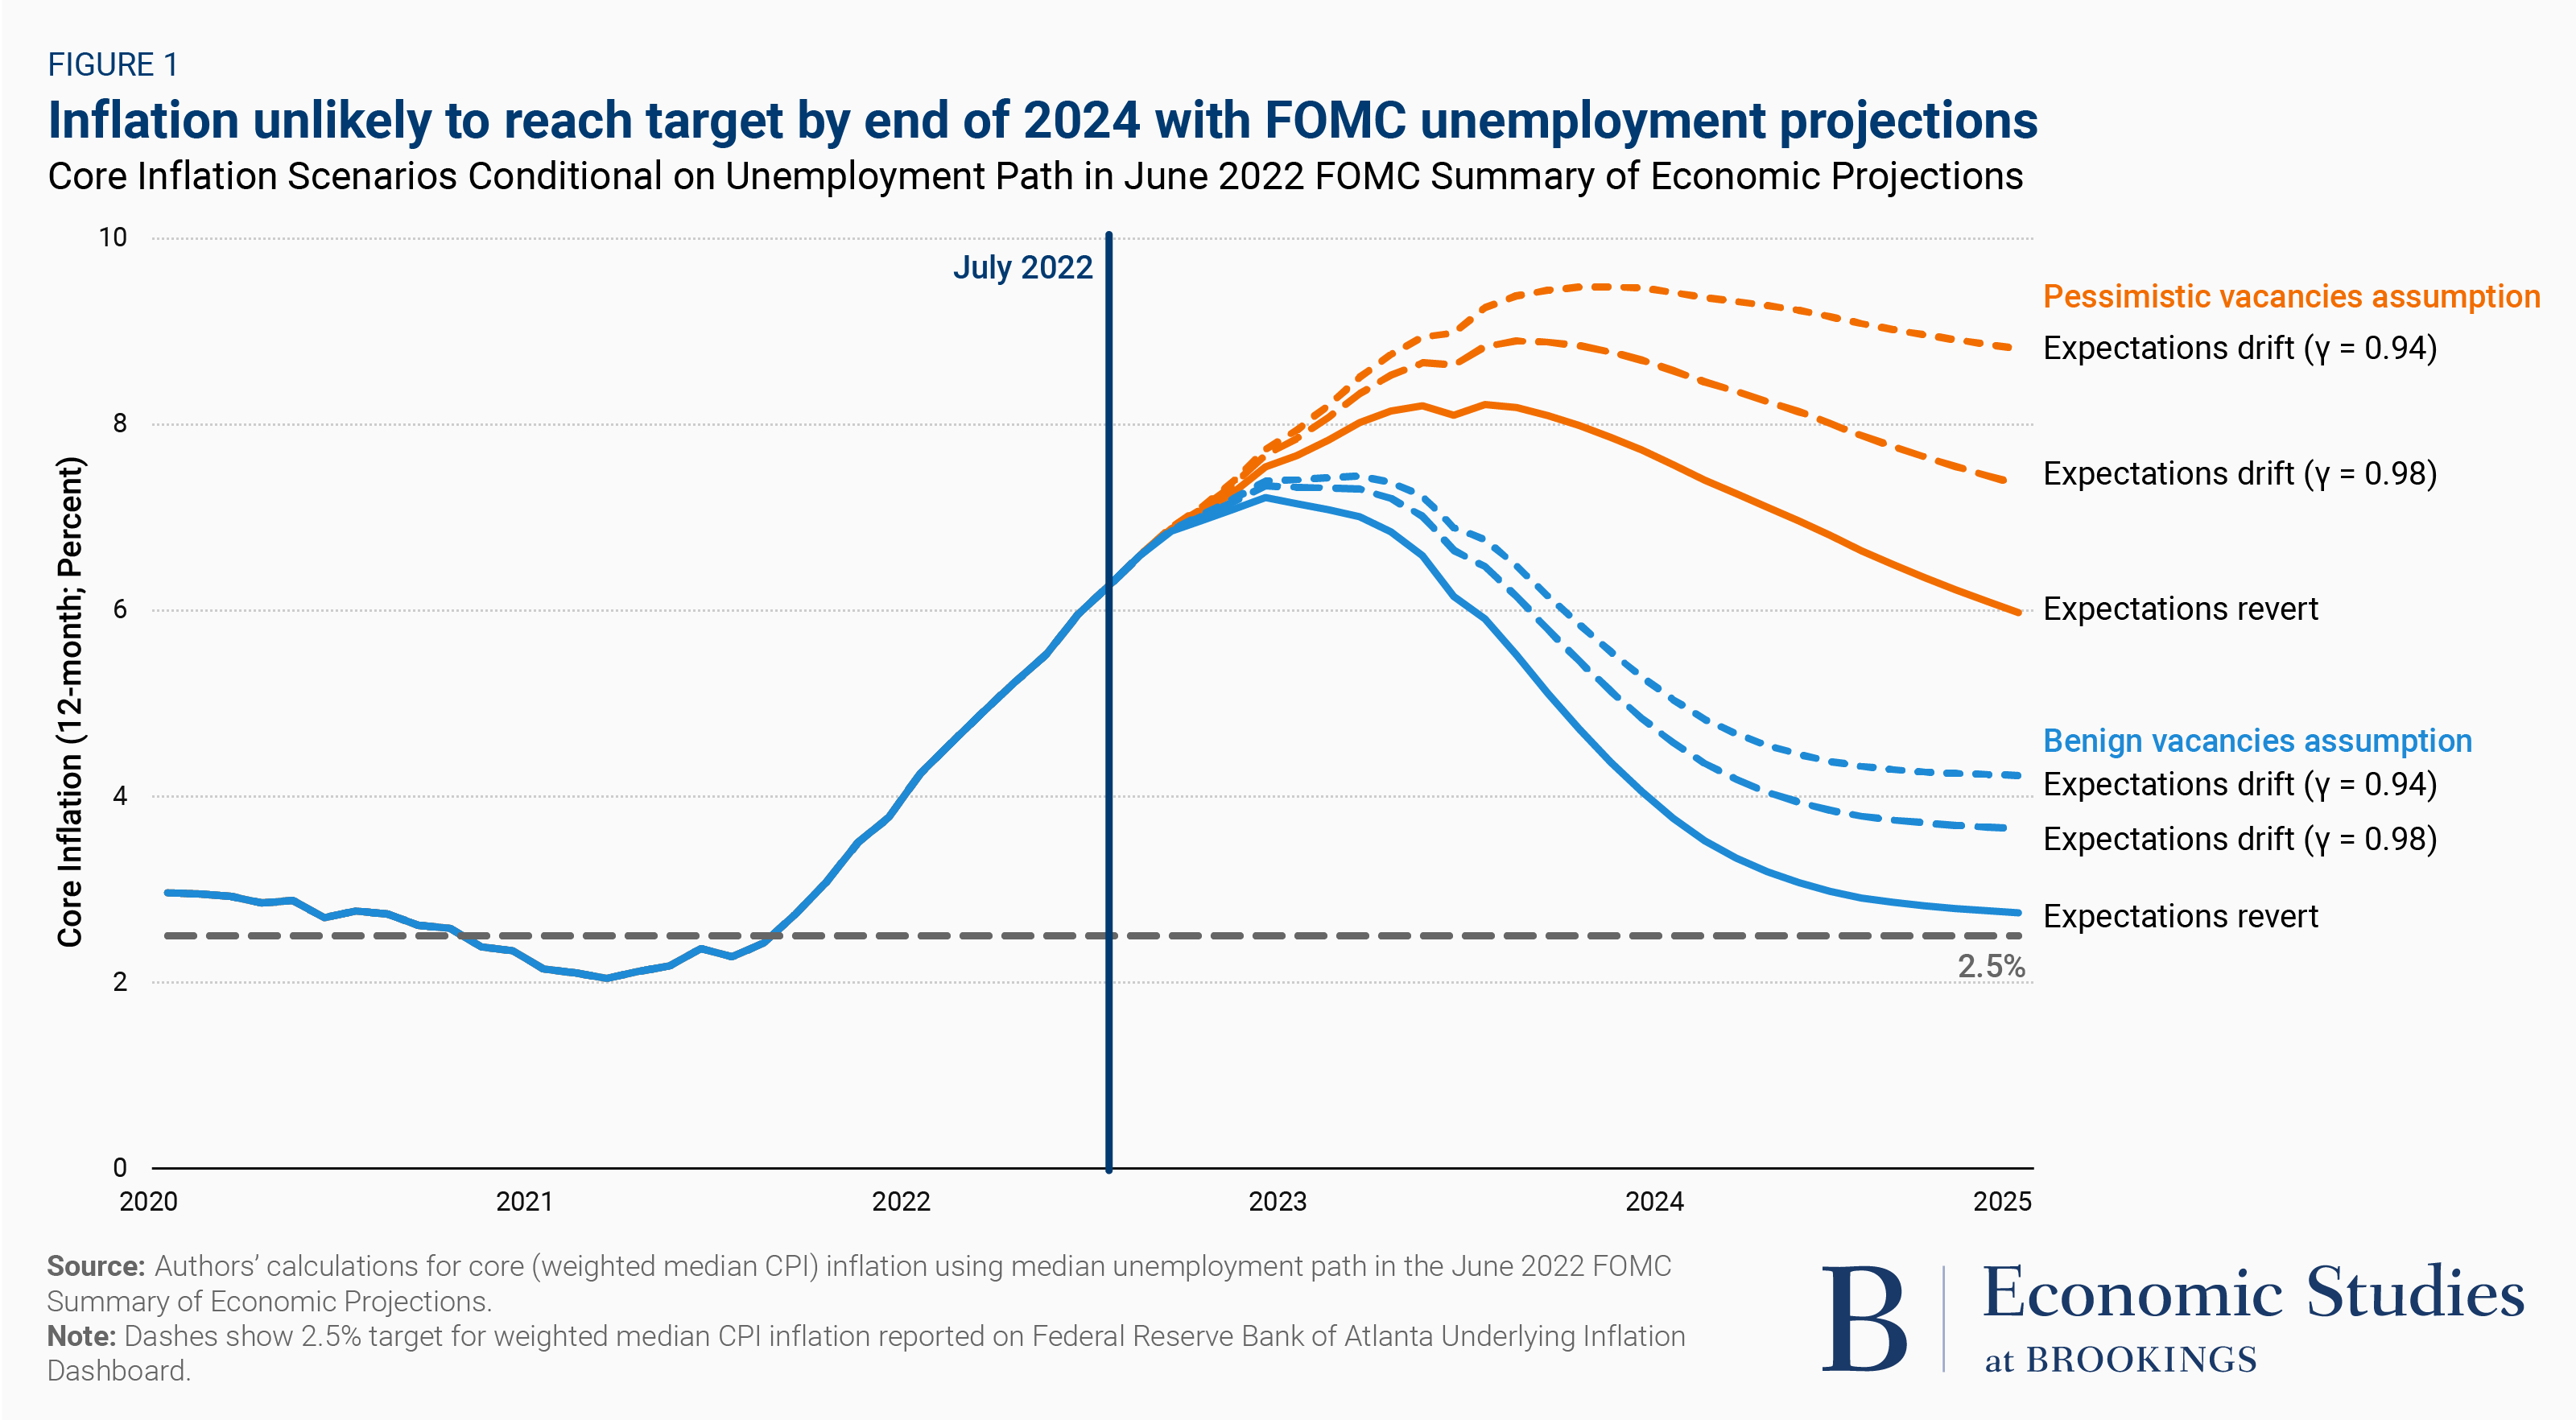
Anatole Kaletsky, the chairman and chief economist of Gavekal, calculates that even if price increases come to a complete standstill right now, core inflation would still be 4.3% in December, and the headline rate at 6.2%. If core inflation continues to rise at the 0.56% rate as it did in August, it will hit 6.6% in December — and if inflation rises at the same rate recorded by the median CPI over the last three months, that core number will reach 7.2% by December.
“Many investors expect the U.S. economy to plunge into a deep recession and the Fed to respond by panicking and abandoning its inflation target. Both things may happen eventually, but neither is remotely plausible within the next six months or so,” he says.
After all, the most recent data on U.S. activity actually has been strengthening. “With inflation and labor market reports still pointing clearly to overheating, the Fed will have no excuse to hint at pausing, never mind at future easing,” says Kaletsky.
He forecasts the fed funds rate will be 4.5% by Christmas, that core inflation will be around 6.5% and the U.S. economy will still show no evidence of recession.
Fed Funds futures are now pricing in a peak Fed Funds rate of 4.42% in March 2023 and rates remaining above 4% for the bulk of next year. These hawkish higher for longer expectations don’t appear to be fully priced into stock prices.
As we approach Q3 earnings season, the market faces possible disappointment in the form of earnings disappointments as Q3 earnings estimates have been declining.
The earnings picture becomes even worse if the energy sector is excluded. Yardeni Research Inc. suggests that sector analysts are likely to cut profit margin estimates further during Q3 earning season. “Analysts remain mostly bullish on S&P 500 revenues in part because they go up along with inflation. Furthermore, very few industries (such as the S&P 500 Homebuilding) are showing signs of falling into a recession currently.” With the exception of energy and real estate, sector margins have been falling, which is going to create valuation and growth headwinds for equity prices.
The latest
economic update from New Deal democrat, who maintains a set of coincident indicators, short-leading indicators with a 6-month horizon, and long-leading indicators with a 12-month horizon, is effectively pointing to a slowdown that begins in early 2023 and a recession by next summer.
The long leading forecast continues to be very negative. The short term forecast is only slightly negative. The nowcast turned slightly positive last week, but back to neutral this week, as tax withholding turned decisively negative (I’ll withhold judgment on the potential broader implications of that until the August 31-September 1 anomaly is out of the 20 day mix).
Although the decline in gas prices in the past 3 months has been very helpful, the consumer remains in a really dicey situation. Any further deterioration is likely to signal either that a recession is nearly imminent, or that one has already begun.
As well, last week’s warning from FedEx could be seen as a wake-up call for investors. The company announced that it is closing 90 locations, five corporate offices, and parking aircraft all due to macroeconomic headwinds: “Macroeconomic trends significantly worsened later in the quarter… given the speed at which conditions shifted… we are aggressively accelerating cost reduction efforts.” The company went on to suspend earnings guidance because of ongoing uncertainty.
In short, the combination of higher interest rates, falling earnings expectations, and a probable 2023 recession makes the new bull scenario unlikely.
Bearish charts
Not all technicians are bullish.
Martin Pring is one of the few technical analysts who has a more cautious interpretation of the market and believes that US equity prices could see further downside in the context of inter-market analysis.
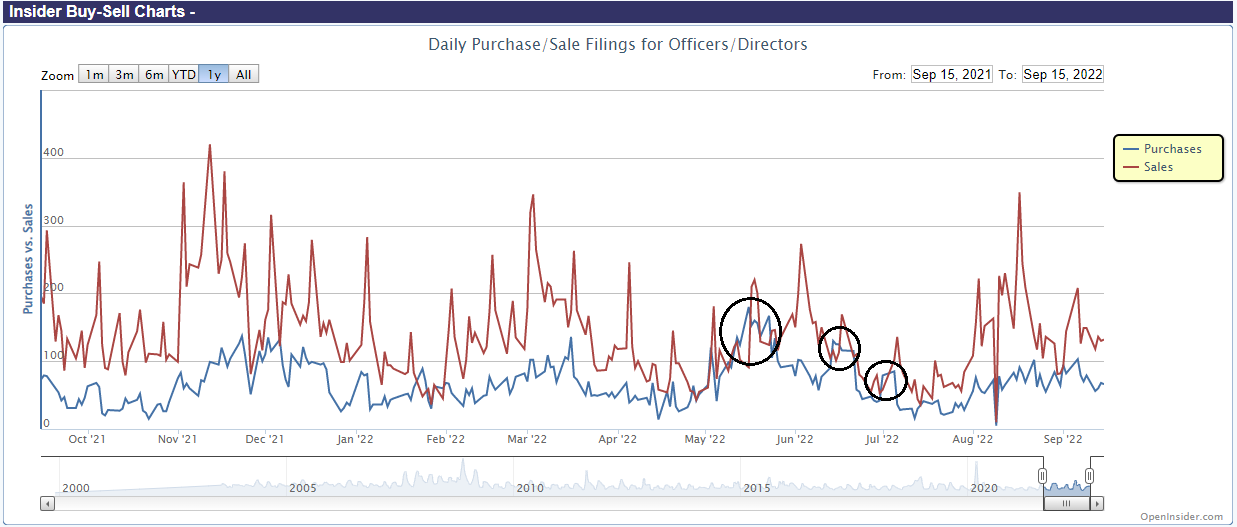
Arguably, the June bottom was not a capitulation bottom. The accompanying chart shows the one-hour swings of the S&P 500 since 2001. The hourly swings at the June bottom barely reached the 2.5% level, which is a marginal reading, though similar conditions could be found at the 2018 Christmas Eve bottom.
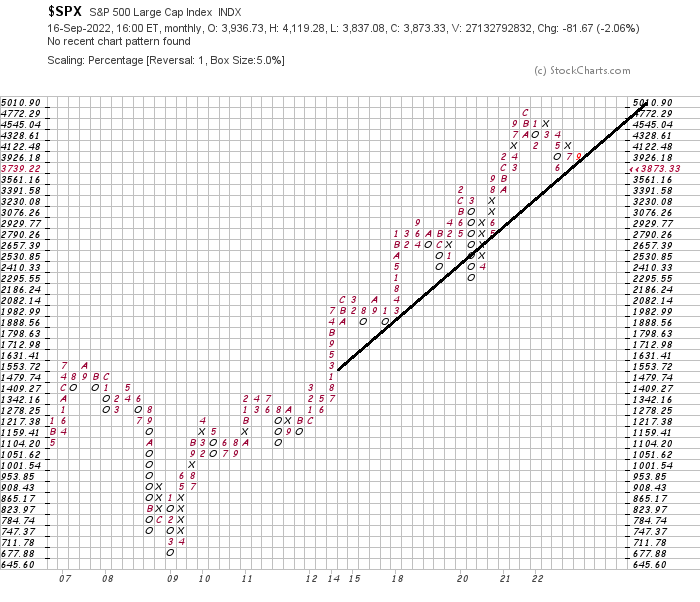
Let’s have some fun with point and figure charting. Here is a monthly S&P 500 point and figure chart with a 5% box and a one box reversal. The index has retreated to a rising trend line and a breach could signal serious trouble.
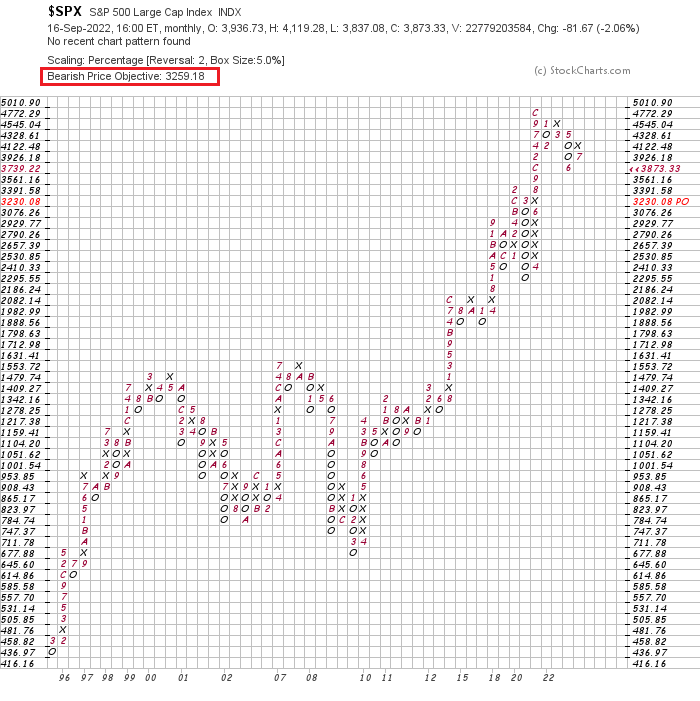
Here is the same chart with a two box reversal. The measured target is 3258, which is in the top half of the support zone outlined earlier in the weekly SPY chart.
Resolving the bull-bear debate
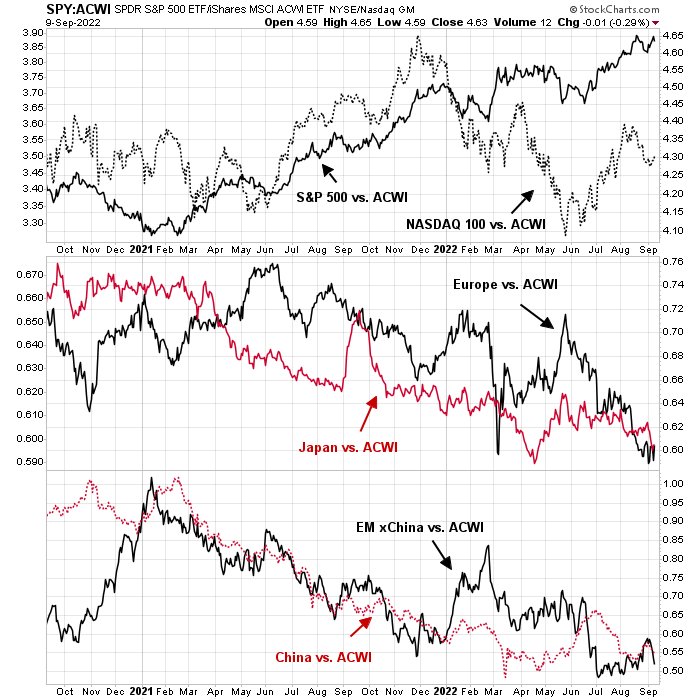
Here is how I resolve the bull and bear debate. The BoA Global Fund Manager Survey is a global survey and the underweight position in equities is more reflective of the economic anxieties outside the US. The relative performance of the different regions shows that the US is the clear leader. Europe is underperforming and the other regions are roughly flat relative to the MSCI All-Country World Index (ACWI).
The two main non-US trading blocs, Europe and Asia are in serious economic trouble. For some context, my analysis presents some of the effects in the form of a percentage of GDP.
It’s no surprise that Europe is tanking. Energy costs are soaring and the scale of the energy shock dwarfs past global shocks. A
Bloomberg article documented how the ripple effects are shutting seemingly unrelated industries such as brewing and tomato farming. Britain has announced household energy subsidies that amount to 5% of GDP. EU price support is not far behind and estimates are in the range of 5-10% of GDP. BlackRock estimates that the EU energy burden, which is not its price support, is 11.7% of GDP.
Over in Asia, China isn’t faring much better. China’s COVID lockdowns are bringing the economy to a screeching halt. Goldman Sachs estimated that Chinese cities representing 35% of GDP are subject to lockdown.
At the same time, the Chinese property market is imploding. A
Bloomberg podcast with Bloomberg Economics chief economist Tom Orlik outlined the scale of the mortgage strike by buyers of incomplete projects. It typically takes about three years for property development to reach completion. Bloomberg Economics found the normal three-year completion rate is 80%, but that figure recently fell to 50% because property developers found themselves squeezed by a lack of financing. The mortgage strike problem is now about 1.4% of GDP. If left unchecked, it will balloon to 4% of GDP by 2024.
How both the bulls and bears are right
Putting it all together, here is how both the bulls and bears could be right. I believe investors need to consider the level of equity sentiment by region. The market is far more concerned about economic weakness outside the US than within the US. The outperformance of US equities is an indication that the market regards the US stock market as a safe haven. In particular, the surveyed exposure to eurozone equities is at a record low, indicating extreme fear.
I recently suggested that Europe is probably already in a recession (see
Will Europe drag us into a global recession?) and monitor European equities based on a first-in-first-out principle. Once European risk appetite begins to emerge from its doldrums, that could be the signal for a risk-on revival.
In many ways, Europe is starting to turn. European gas prices have peaked and they are in retreat, indicating that Russia is losing leverage over the EU. While Ukraine has seen some successes on the battlefield, the Russo-Ukraine war is by no means over. Here is what I am watching.
The performance of MSCI Poland is a useful barometer of geopolitical risk premium. The index is still in a downtrend relative to the Euro STOXX 50 and ACWI. Wait for a definitive sign of relative breakouts before sounding the all-clear.
Both BASF and Dow Chemical are commodity chemical producers based on two sides of the Atlantic. BASF (in USD) skidded against Dow in February with the onset of the war, but its relative performance is tracing out a relative bottom against Dow and it is testing a key resistance level. Wait for the relative breakout.
If and when they occur, relative breakouts in these two barometers will be a buy signal for global risk appetite. As investors piled into US assets for their safe haven quality during this downturn, expect US equities to lag as investors rotate into higher octane and higher beta equities. S&P 500 stocks have the potential to lag in the new bull phase.
Jurrien Timmer at Fidelity has suggested the 1940’s as a template for the S&P 500, when stock prices fell -26% and then moved sideways as P/E ratios gradually fell.
Investors who are constrained to the US should consider mid- and small-cap equities, whose forward P/E ratios are far less demanding than the large-cap S&P 500.
In conclusion, the bulls could be right in their timing and analysis, and at the same time, the bears could also be right because of their macro and valuation concerns. The key difference is geography. Most of the growth concerns and opportunities are outside the US, while large-cap US equity valuations are elevated because of their perceived safe haven status in a period of slow global growth.