Preface: Explaining our market timing models
We maintain several market timing models, each with differing time horizons. The “Ultimate Market Timing Model” is a long-term market timing model based on the research outlined in our post, Building the ultimate market timing model. This model tends to generate only a handful of signals each decade.
The Trend Asset Allocation Model is an asset allocation model that applies trend following principles based on the inputs of global stock and commodity price. This model has a shorter time horizon and tends to turn over about 4-6 times a year. The performance and full details of a model portfolio based on the out-of-sample signals of the Trend Model can bsoe found here.

My inner trader uses a trading model, which is a blend of price momentum (is the Trend Model becoming more bullish, or bearish?) and overbought/oversold extremes (don’t buy if the trend is overbought, and vice versa). Subscribers receive real-time alerts of model changes, and a hypothetical trading record of the email alerts is updated weekly here. The hypothetical trading record of the trading model of the real-time alerts that began in March 2016 is shown below.

The latest signals of each model are as follows:
- Ultimate market timing model: Buy equities
- Trend Model signal: Bearish (downgrade)
- Trading model: Bullish
Update schedule: I generally update model readings on my site on weekends and tweet mid-week observations at @humblestudent. Subscribers receive real-time alerts of trading model changes, and a hypothetical trading record of those email alerts is shown here.
Subscribers can access the latest signal in real-time here.
A relief rally
A week ago, I highlighted an observation by Bill Luby that a recycle of the VIX Index below 30 after a prolonged period above that level is historically bullish. Now that the VIX has fallen below 30, how far can the rally run?

The S&P 500 tested support while exhibiting a series of positive RSI and rallied on the hopes of a Russia-Ukraine peace accord. The advance continued even in the face of a hawkish FOMC message. The index violated a falling trend line, which is a positive development.

Despite the strong historical statistics, don’t be too bullish. The relief rally looks like a bear market rally within a downtrend.
Time to turn cautious
My Trend Asset Allocation Model has downgraded its signal from neutral to bearish. It’s time to acknowledge that this is a bear market. The model applies trend following principles to global stock and commodity prices to create a composite signal. The model is pointing to recessionary, or near recessionary conditions.
The Ultimate Market Timing Model remains bullish. As a reminder, this model only turns bearish when the trend model is bearish, which it is, and my Recession Watch indicators flash the warning sign of a recession, which it hasn’t yet. The combination of the two is rare, which explains the low level of model turnover. This is confirmed by the latest update from New Deal democrat, who maintains a set of coincident, short-leading, and long-leading indicators. He reported that his long-leading indicators have moved into neutral, with the caveat that war-related disruptions could plunge the economy into recession [emphasis added].
There are two separate dynamics operating on the economic indicators. One dynamic is a typical cyclical one of the Fed reacting to high inflation and low unemployment by raising rates, now that it has been convinced that inflation has not been “transitory.” The second dynamic is Russia’s invasion of Ukraine, and the world’s reaction to it.
The first dynamic is primarily acting on the long leading indicators. Thus we see bond yields rising, and yield spreads tightening. In fact, several portions of the yield curve inverted Thursday and at least intraday Friday (most notably the 5 minus 3 year spread which briefly turned negative Friday, before closing ever so slightly positive). This dynamic is also why mortgage rates are negative, and at least partially why credit conditions have tightened.
As a result, the long leading forecast has turned neutral. A recession is possible one year from now, but not that likely yet…
The global economic reverberations of the Russian invasion of Ukraine, and the reactions to it, by way of sanctions, global oil supply, and also by businesses severing ties with Russia, is an exogenous event, just as the pandemic was in 2020. And just as with the pandemic in 2020, it could cause a recession without the normal procession of cyclical effects through the economy. But it is “transitory” in the sense that if and when the conflict resolves, the normal cyclical procession will reassert itself. Those cyclical processes, the other side of the pincer, continue to point towards a stall roughly at the beginning of next year.
In the US, the S&P 500 has exhibited a dark cross, where the 50 dma falls below its 200 dma. Moreover, the broadly-based Value Line Geometric Index is in a well-defined downtrend and violated support.

Across the Atlantic, the Euro STOXX 50 has taken the brunt of the Russia-Ukraine war fears. Even though the FTSE 100 is acting a bit better, the mid-cap FTSE 250, which is more sensitive to the UK economy, is in a downtrend.

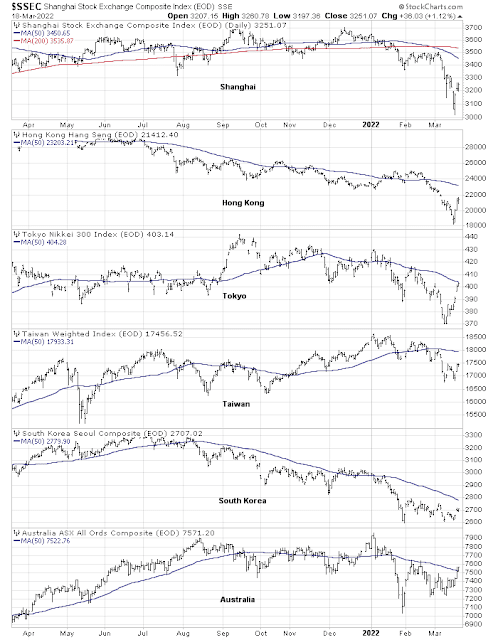
In Asia, China and Hong Kong have tanked, though a recent announcement of market-friendly measures has sparked a turnaround. Nevertheless, the market structure of the major Asian markets are all screaming “downtrend”.
Commodity prices are strong, but I pointed out last week (see Not your father’s commodity bull) that price strength is attributable to supply shortages and not excess demand. Such conditions are not reflective of strong cyclical strength but will resolve in demand destruction, which is bearish for the global economy. Indeed, the cyclically sensitive copper/gold ratio confirms this assessment by trading sideways.

A bear market rally
Bull markets don’t go straight up and bear markets don’t go straight down. Short-term sentiment is supportive of a bear market rally, which can be brief but vicious. The AAII bull-bear spread remains at a buy signal, which is tactically bullish.

A key technical test
Last week’s bounce presents a key technical test for the S&P 500. Since December, the S&P 500 has reacted to oversold conditions with sharp 2-4 day rallies, followed by further weakness to either test the previous lows or more new lows. The main differences this time are the violation of the falling downtrend line and the positive RSI divergence. Much will depend on whether the market can follow through with more strength in the coming week.

The market is also enjoying a momentum tailwind. The S&P 500 exhibited four consecutive days when it was up 1% or more last week. Such episodes are rare but they have historically resolved with a bullish bias, though the sample size is very small (n=4).

The bullish island reversals exhibited by both the Euro STOXX 50 (FEZ) and MSCI China (MCHI) are additional inter-market signs that a strong bear market rally is underway.


In the short run, the part of the US market with the most upside potential is large-cap growth. Macro Charts pointed out that the NASDAQ 100 is exhibiting a strong breadth thrust after a deeply oversold condition, which is very bullish.

I agree with the bullish assessment on the NASDAQ 100. The index violated a falling downtrend after exhibiting a series of positive RSI divergences. Relative breadth against the S&P 500 has been strong (bottom panel), indicating positive underlying relative strength. Watch for overhead resistance at the 50% Fibonacci retracement level as a possible profit target, but recognize that there is also a risk of momentum failure.

Even ARK Innovation (ARKK), which represents speculative growth stocks, underwent a bullish island reversal, though its downtrend remains intact. If the rally continues, watch how the ETF performs near its trend line resistance.

In conclusion, the stock market is undergoing a relief rally in the context of an intermediate-term downtrend. It’s difficult to know exactly how far the rally can run. Investment-oriented accounts should take advantage of market strength to rebalance to a position of minimum risk. Traders who are long should use a stop-loss to define their risk.
Disclosure: Long TQQQ
Totally agree we are in a bear rally.
This chart of Fed Funds Futures shows how the rug is being pulled out from under the growth stock rally. Since the Fed meeting on Wednesday, a further quarter point future hike has been added and the line is pointing higher. Higher interest rates are the kryptonite of Growth stocks.
https://refini.tv/3Ix9wUM
I would expect that a longer term bull market in Growth will come when interest rates are declining after a future recession. At that time, economically sensitive Value stocks will have poor earnings prospects while Growth companies will keep growing.
Is there a possible low on Growth stocks before then? Yes. Look at Chinese Innovative Growth stocks in the Golden Dragon ETF. They crashed from 40X PE to 13X PE in a few months to last Tuesday before the Chinese government stepped in. They gave up ten years of stock gains in their high growth internet and technology stocks. It was like Apple and Alphabet going back to 10X PE and Tesla at 20X.
There is a strong chance that the low marked last Tuesday for Chinese Growth stocks is a long term low because the crash was so devastating and the government support is ‘all-in’ (Cam needs proof).
So in future, if American Growth crashes in a panic to truly cheap levels, we may have a durable bear low before a recession. BTW, Cathy Wood’s ARKK has a negative PE (and negative cash flow) so what is a bargain price for a bunch of losing Robinhood concept companies?
You know, markets are irrational, and it all depends on where the money goes.
If one wishes to use the 20% decline metric for declaring a bear market, I don’t , I care about recessions, real ones, not what happened in 2020 when the government flooded Main Street with free money. If this is the new normal, then future recessions will also be short lived until free money no longer works.
I think that inflation is largely due to free money, bottlenecks and opportunism by companies. The last one, could it be trying to get a quick buck while it is possible?
So what will happen with earnings? They should go down, only what if corporate buybacks get even higher ? Helps the P/Es. What about FOMO? Sentiment is so negative.
What about retail holding the bag? Are we with such sentiment?
What if companies are front running cost increases with prices, will there be one last earnings boost?
What this inflation spike has shown is how much outsourcing to Asia has contributed to low inflation since the 90s. Perhaps robotics will replace asian factory workers in time, a fair amount of time.
I know I sound like a broken record but I think this whole thing was way too telegraphed and we are in a bear trap, it could be the last one of this bull….but I think caution is warranted.
Maybe it is a bear market rally and when the bear reasserts itself it will be brutal, we just have to wait and see, but for me the moment of true capitulation will be when the market ignores the Fed.
Yesterday‘s post was dramatic with a big downgrade and another shoe to drop well telegraphed. So, I try to lay out major factors:
Headwinds- 1. Bottom is not in based on historical data, 2. Yield inversion will occur and they are predictive of recessions (how long after inversion occurs?) 3. Fed will not modify its path no matter what happens – they are bent on making a policy mistake and plunge the economy in a recession in an election year
Is this sufficient?? I would have liked to see more focus on earnings outlook and multiples.
On the other hand, Fed had telegraphed its policy, market had already done the work for them. 30 year mortgage is well above 4% and as prime rates go up, so will borrowing costs. Demand for capital goods should stabilise, spending is more on services, – a different demand pattern.
I think the market may be in a trading range till we get more clarity on war, inflation outlook and labor costs.
I find it difficult to see what brings the high prices back for companies with cash loosing hyper growth. They were overpriced. Market cannot degrade their technologies.
It’s not when the curve inverts, it’s when it reverts….but the market looks ahead…but if for example the curve inverts and only reverts a year later, there is a lot of time between the two for things to keep going up
Thanks for the clarification. See article on Morgan Stanley’s perspective. For now.
https://www.google.com/amp/s/finance.yahoo.com/amphtml/news/morgan-stanley-sees-u-curve-104026513.html
A Perspective from JPMORGAN:
https://www.chase.com/personal/investments/learning-and-insights/article/tmt-march-eighteen-twenty-two
The SPX is ST overbought. On the other hand, the extreme negativity from which it launched on Monday probably means the rally has further to go.
Longer term – I still think the pain trade is a decline that erases all of last week’s rally.
My plan? Assuming the SPX is likely to carve out a trading range over the next few weeks, I would consider going long on a retrace to 4350. Then again on a retrace to 4295. Then again on a retrace to 4170. Exit targets are not as well-defined, other than I would expect to see lower highs each time. Of course, we all know what happens to best-laid plans, so those are just my thoughts at this point in time.
Taking a pre-market swing at FXI on the -4% retracement of Friday’s move.
That was incorrectly worded. Meant to say -4% pullback, which represents about a -80% retracement of Friday’s move.
Taking a swing at BA (Boeing) as well.
Opening a position in TLT.
EEM.
IEF.
ASHR.
EWG.
BABA.
VEU.
BA (Boeing) off here for a +2.8% gain.
BABA off here for a +2.54% gain.
Adding a position in VT.
Reopening BABA.
Adding to VT.
Adding to VEU.
I’m looking to lighten up my equity holdings based on Cam’s recommendation. What do you all see as an upside target on this current rally?
Close last Friday.
Thanks Ken. I will prime the flux capacitor. 😉
Flux capacitor not required, rebalanced today. Thanks!
Strong 4 days: I would be careful – 2020 and 2011 were in bull markets, while 1970 and 1974 were during rebounds from deep slumps.
Closing FXI and BABA early in the premarket session for +3.3% and +8% overnight gains.
(Total gains on FXI/ BABA over the past week ~+12%/ +30% respectively. We always own too much when prices retreat, and never enough when prices spike!)
Closing EEM.
Closing all positions in VT/ VEU.
Closing ASHR.
Closing EWG.
Closing KRE.
Remaining positions are TLT/IEF, which currently display ‘paper losses’ of -1.89%/-1.08%. But position sizes are small, and I’m not too concerned about owning bonds here.
It’s definitely a bear market. Currently +11.2% ahead of the SPX ytd, which – given my bias towards capital preservation – ONLY happens in bear markets.
Taking another swing at GDX here.
GDX off here for a +1.1% gain.
It’s hit and run trading for now. Not a time for buy-and-hold.
Closing TLT/ IEF here for small losses.
Looks like Cam nailed another one. If his trading model was still bullish I would probably be looking for reentries in KRE/ VTV/ VT – since it’s neutral then so am I.