Did the stock market make a meaningful bottom last week? Financial markets had been taking a risk-off tone coming into the week, but when the Powell Fed was slightly more hawkish than expected, the market rallied.
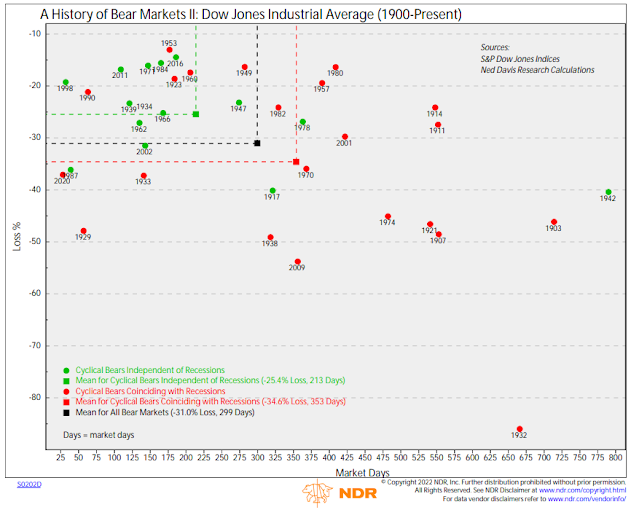
The S&P 500 was -14.6% peak-to-trough on an intraday basis in 2022. Ed Clissold of Ned Davis Research pointed out that the characteristics of cyclical bears and recession bears have been very different. Cyclical bears that don’t involve a recession tend to be shorter in length and less severe in magnitude compared to recession bears, though “most non-recession bears include a recession scare”.
Here are some ways of spotting a durable market bottom.
The Fed’s rosy scenario
If we were to cut through all the noise, it’s the Fed cycle that mainly dominates the stock market. The Powell Fed turned hawkish, as expected, at the March FOMC meeting. However, a number of unusual forecasts from its Summary of Economic Projections (SEP) caught my eye.
First, the “dot plot”, or expected Fed Funds rate, jumped from 0.9% to 1.9% by December 2022, which was roughly consistent with market expectations. The expected Fed Funds rate in 2023 and 2024 will overshoot its longer-run target, indicating an extra tight monetary policy. Core PCE inflation was revised up from 2.6% to 4.3% for 2022, indicating a hot inflationary environment, though Powell indicated in the press conference that he still expects inflation to moderate in the second half of 2022.
Here is the anomaly. Despite all of the tightening, the forecast GDP growth rate is still relatively strong at 2.8% for 2022 and 2.2% for 2023. Moreover, the unemployment rate forecast was unchanged at 3.5% in 2022 and 2023. The Fed expects a strong labor market and no recession.

This sounds like an unrealistic rosy scenario. If the Fed continues to anchor the long end of the Treasury yield curve with its guidance on the neutral policy rate, the yield curve will invert before the end of 2022. Inverted yield curves have been strong predictors of recessions. The Fed’s rosy scenario is leading monetary policy of tightening until something breaks.

If a recession is ahead, the downside risk to equity prices will be a lot more than the -14.6% peak-to-trough drawdown experienced recently. What could rescue the stock market from a recession bear?
The answer is financial instability, otherwise known as something breaking. Conventional measures of financial stress are rising, though readings are nowhere near crisis levels. Keep an eye on emerging market spreads (red line), which is raising a cautionary flag.
A key risk is the Russia-Ukraine war spikes food prices. The last time food prices rose sharply, it created political instability in the form of the Arab Spring in emerging and frontier markets. While that scenario may fraught with risk on paper, many EM countries are commodity exporters that benefit from higher commodity prices, especially in Latin America. Even in Africa, many countries have partial natural hedges. The UN defines a country as commodity-dependent if it is more than 60% of its physical exports are commodities, and 83% of Africa is in that category.

The elephant in the emerging market room is China, which is a voracious importer of commodities. The key question is its pandemic management policy in the face of its zero-COVID policy. While the recent market-friendly pivot is helpful for financial stability, those policies will do nothing if the Chinese economy slows and snarls global supply chains because of ongoing pandemic lockdowns.

Market positioning
While an analysis of Fed policy may point to a recession bear, the risk-on rally in the face of a hawkish Fed last week may be a reflection of excessively bearish positioning. The BoA Global Fund Manager Survey shows that respondents are all-in on their recessionary outlook. As well, a recent CNBC poll of Fed watchers saw a 33% chance of a recession within the next 12-months.

Consequently, manager risk appetite has plunged.

Mark Hulbert also pointed out that short-selling is virtually nonexistent, which is potentially bullish.

On the other hand, insider buying is also nowhere to be found, though there was a brief episode of insider buys exceeding sales at the January low.

As a reminder, here is what insider activity looked like during the GFC market bottom. There were strong clusters of insider purchases that exceeded sales.

Here is the history of insider activity during the recent COVID Crash bottom.

As well, S&P 500 futures positioning is not signaling a capitulation bottom. Historically, hedge funds have been in crowded shorts in S&P 500 futures at past major market bottoms. Readings are still net long and hedge funds aren’t panicked just yet.

Insufficiently oversold
From a technical perspective, the market is insufficiently oversold for a major market bottom. I have highlighted the “good overbought” advance from the March 2020 bottom before. This was evidenced by the percentage of S&P 500 stocks above their 200 dma rising to 90% and remaining there. The overbought condition recycled in mid-2021 (top panel). Historically, such declines don’t end until the percentage of stocks above their 50 dma fall below 20% (bottom panel). The recent market weakness reached 25% and recovered. This analysis indicates further downside risk ahead.

In addition, the NYSE McClellan Summation Index (NYSI) has signaled major bottoms whenever it fell to -1000 or less. This indicator isn’t perfect as it was early to flash buy signals in 2008. Nevertheless, readings of -1000 have shown a strong track record of calling bottoms in the past.

Recession ahead?
Where does that leave us? I am about two-thirds of the way down the path to the recession camp, though my models are not calling for a recession just yet and I don’t like to front-run model readings. The path of Fed policy seems to be to tighten until something breaks. An inverted yield curve is almost inevitable at this point and other economic indicators are deteriorating.
Regardless of whether there will be a recession, analysis from Ned Davis Research indicated that stocks struggle during the first year of a fast tightening cycle. In the current circumstances, both the “dot plot” and market expectations are indicating a fast tightening cycle.

I am downgrading the reading of my Trend Asset Allocation Model from neutral to negative. Investment-oriented accounts should shift to a maximum defensive posture.

This is a bear market. The current episode of stock market strength is a bear market rally. Don’t be fooled. Sell into strength.
Totally agree on everything but ….
There is a new heavyweight in the investment world that is shaking up the old order. That is China and the Asian region.
The rally this week starting on the 16th wasn’t due to anything in America. It was a major low marked in China with a government pivot that spilled into US tech stocks.
If you take Cam’s description of what is necessary for a real bear market low and apply it to Chinese stock markets, you will see that March 15 was a bear market low there. The % decline was there, the panic sentiment, the Central Bank and government rescue (remember the Fed and Congress in April of 2020 here) and junk debt is now in rally mode. Check, check, check, check.
The Chinese government has said they are ‘all-in’ to stop the hemorrhaging. I believe them. People in the region believe them. I suggest believing them just as we should have believed the U.S. Fed and Congress in April 2020.
The entire Asia Pacific region from New Zealand to India east west and Korea to Australia north south have marked durable lows. Emerging Asia and Developed Asia are together in starting a bull market on the back of China’s pivot.
I thought it was interesting to see metal commodity related sectors do very well from the March 15 low even in the face of peace progress in Ukraine. This tells me that recent weakness in commodities was a lot because of the Chinese implosion before the government rescue pivot. I prefer PICK international miners to XME American miners now for this reason.
Global ex-US ETF is outperforming since the Chinese pivot. Europe is doing better than the US as hope for a settlement with Russia is closer. It is not doing as well as Asia. As others have been touting non-American/Canadian markets for the last year, I stayed and America has outperformed. I suspect that has changed. In my experience, it is much safer and profitable to be in countries where the government is aggressively supporting stock markets like China now as opposed to those that are aggressively tightening policy like America. Call me simple.
I have rebased ETF sectors to March 15 and will track momentum from there. Of course, the whole Reddit/Cathy Woods stocks soared with Chinese tech stocks. Those might rally for a while but the U.S. rising interest rates and the unfolding popping of the bubble makes the Innovative Growth area very suspect except for a quick trade.
Many political scientists have speculated the world is dividing into three main spheres, the Americas, Europe and Asia. March 16, could be the first day when we see the birthing of a new bull market in Asia while America is only having a bear market rally in a continuing bear market. Who is the tail and who is the dog when it comes to wagging whom going forward?
My goal is always to get a decent rate of return safely anywhere in the world.
Hi Ken what we are witnessing is the bastardization of free markets in front of our eyes for sometime. In the past they tried to do it surreptitiously but now it is front and center. China is not the only country that intervenes in the market. Our ex- president was notorious for making nonfactual statements to prop the stock market. We live in a new era. Bank accounts are frozen in Canada. The Federal Reserve with the support of US Government uses the US dollar and Swift system to bludgeon countries with sanctions. The notion of true price discovery it out the door. Short sellers go to bed worried. Unless of course you were short Nickel!!!. Imagine being long Nickel and your trades are cancelled – Wow. Not in a third world country but in England.
In any case, as Warren Buffet said you don’t know who is swimming naked till the tide goes out. Apparently, there are large Commodity Houses that are leveraged and are having difficulty meeting margin calls. The true bottom in the US market will come when some large institution in America or overseas fails. Think Long Term Capital Management, Bear Stearn, Lehman and AIG.
Of course, the Government will step in to save them. To big to fail.
I reserve my comments until the Asian markets settle out. So far, the other Asian markets, e.g. Taiwan, Korea, Singapore, Japan, still look weak.
Here is a chart on Asian High Yield ETF with the recent low marked. When a new bull market starts, junk high yield keeps recovering. If the recent low is breached, the bear market in Asia is back on.
https://refini.tv/3pzpOFS
Hi Cam, I agree with your assessment. I assume being defensive with regards to your trend model allocation is now 80% IEF, and 20% SPY. My question to you is this: What about extending duration in the bond allocation? ie TLT, or derivative fixed income vehicles such as XLU, instead of just all IEF.
Thanks for your insight Cam, and stay well!
Mike
Also interested to know what typically happens to long bonds in a stagflation scenario. Slower growth would be a positive but would it offset increased inflation?
Model portfolio based on Trend Model signals:
Bullish: 80% SPY, 20% IEF
Neutral: 60% SPY, 40% IEF
Bearish: 40% SPY, 60% IEF
The idea is to swing 20% around a 60/40 allocation.
But your mileage will vary depending on your circumstances.
Cam- Given your connection with Bob Farrell’s work, what’s your take on Helene Meisler’s recent observation that the Bob Farrell AAII sentiment indicator is at the lowest level ever (or at least since October 1994).
My understanding is that a buy signal occurs when the 10-week average falls under 0.50 and then rises from there. Currently looks to be around 0.4x.
That’s a tactical trading signal. Helene also noted that the Farrell model doesn’t pick exact bottoms.
We are likely undergoing a bear market rally. More on that tomorrow.
Cam,
In another subscription service I have they say that the market is being “artificially” supported by the Buy/Sell side institutions as a “patriotic” gesture because of the Ukraine war.
As well as this there are lots of individual companies using buybacks to support their share price.
Do you have any comment on this? Thanks.
Good article from Bloomberg. BTW Bloomberg is a cheap great source of timely investment news and international stock/bond/commodity/FX quotes.
China Put Can Be Game Changer for Stock Market After Global Rout
https://www.bloomberg.com/news/articles/2022-03-19/china-put-can-be-game-changer-for-stock-market-after-global-rout