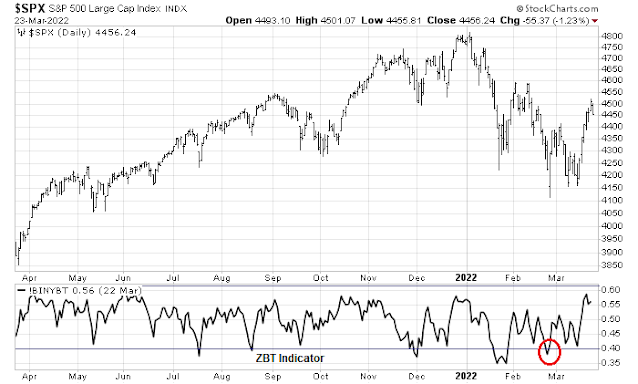
Mid-week market update: The strength of the rally off the mid-March lows has been breathtaking. Ed Clissold of NDR Research pointed out that the market experienced several breadth thrust buy signals. The % of stocks above their 10 dma surged from under 10% to above 90% in a short time, which is historically bullish. He also observed that their version of the Zweig Breadth Thrust model using a common stock only universe also flashed a buy signal last Friday.
That’s where the controversy begins.
An uncertain breadth thrust
Much depends on what you call a “breadth thrust”. The term refers to a burst of positive price momentum over a short period, usually defined as a move from an oversold to overbought condition within 5-10 trading days.
An analysis of the % of S&P 500 above their 10 dma is not confirming the NDR buy signal. The market fell under 10% on this metric on February 24, 2022, and rose above 90% last week, which is not within a 10-day trading window. In all likelihood, NDR uses a different sample universe, such as NYSE issues, but this analysis casts some doubt on the breadth thrust conclusion.
Similarly, the classic Zweig Breadth Thrust indicator using all NYSE-listed issues rose above its oversold condition on February 24, 2022, and it has not reached an overbought condition.
Strike two.
Occam’s razor
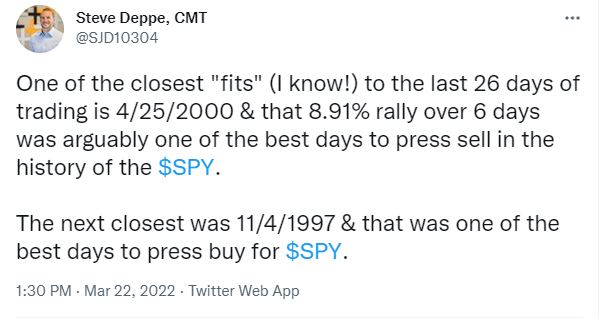
In light of these closely competing narratives, what should we make of these breadth thrust claims? Steve Deppe put it best when he threw up his hands when he analyzed historical analogs. One was wildly bullish, the other bearish.
I prefer the Occam’s Razor approach of using the simplest explanation instead of more complex and convoluted analysis. The rally off the mid-March bottom was a short-covering rally driven mainly by the fast money crowd that was overly short the market. Sentiment was in a crowded short condition going into the FOMC meeting. Even though the Fed was hawkish as expected, it wasn’t enough. Buy the rumor, sell the news.
Even though sentiment surveys were at bearish extremes, the analysis of equity positioning showed that investors were cautious but readings were not at capitulation lows.
My base case scenario is the advance off the mid-March lows is a bear market rally, which tends to br short but vicious.
A stall ahead
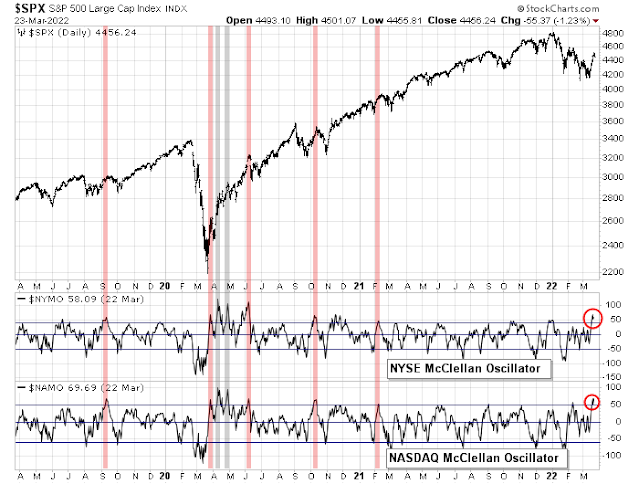
The rally appears to be stalling. Both the NYMO and NAMO have reached overbought conditions. There were seven instances when this happened in the last three years and five of them resolved with market stalls. The only exceptions occurred when the market surged off the March 2020 bottom.
I had highlighted evidence of a bottom by the widespread incidence of bullish island reversals in washed-out pockets of the market. Here is ARK Innovation (ARKK), which exhibited an island reversal but the rally seems to have stalled.
The Euro STOXX 50 ETF (FEZ) is exhibiting a similar pattern of island reversal and stalled rally/
So is MSCI China.
My crystal ball is a little cloudy and I am not sure about the direction of the next major market move. I do know that bullish momentum is fading. Subscribers received an alert yesterday that my inner trader had closed out his long position and stepped to the sidelines.
The balance of risks is tilting to the downside. Jerome Powell’s testimony on Monday was very hawkish and the market is now discounting half-point hikes at the next two FOMC meetings.
The Russian offensive has stalled and the Ukrainians have made some successful local counter-attacks. The risk of escalation remains high, which could spook the market.
My inner investor believes this is a time for prudence. My inner trader doesn’t have an edge and so he is stepping aside in wait for a better opportunity.


Stepping aside seems like a good idea. When in doubt, get/stay out.
The weekly S&P and NAZ summation indices (red and green respectively in this single chart link) which nobody looks at is still saying a bottoming process is on going and the bulls have nothing to be excited about. Most market technicians just look at the daily summation. This weekly summation chart is usually slow to read the bottom but will spot a weakening top pretty reliably and it did that in the week after Nov 19, 2021. The double cyan line is saying we have a weekly gap from Apr 2, 2021 which could still be filled.
https://ibi.sandisk.com/public/d2018a5d-478a-4b53-bfa3-e94a9ab14e46/file
I think the narratives are all wrong.
Raising rates will not cure inflation, a recession will. It’s true that raising rates in the presence of massive debts will cause problems, aka a recession or worse.
Perhaps there will be 2 tiers of debt…public that gets rolled over between Fed and Treasury at very low rates, and then the rest of us pay more realistic rates…so they change the spread.
When the crashes of 2000 and 2008 happened, they dropped rates , and what happened? The market ignored this and kept going down.
In the 70s we had stagflation, well we got hit with OPECs special operation (are we still allowed to say that?) so this hit the economy hard. Debt was much less, rates could go up. But in the 70s the baby boomers came of age…ie 18 which = credit cards=huge credit expansion, in the general economy…similar to helicopter money courtesy of Covid. In the 70s as the boomers matured, they borrowed more and more = more credit expansion.
Now I confess, I don’t know the situation for the millennials, and how much credit expansion they will create.
Another bug in my bonnet is debt and gdp growth….who prefers to go into debt? nobody…so why do we go into debt? Because we don’t have enough money…why don’t we have enough money to maintain our lifestyle? Because we are not growing our income as fast….so rising debt is a leading indicator of slowing GDP growth, so it’s no big surprise if high debt is associated with slower GDP growth.
You can’t just wipe out debt because for every unit of debt there is a unit of credit.
Anyways, whether they raise rates or not, we have huge debt, insane market pricing, and so at some point we get a recession, which will be painful.
This is all a CYA operation, because after the recession, (they will be able to say they fought inflation) the debt will be crushing, so they will try to inflate it away, but then they will have another excuse, namely preventing a depression.
This has nothing to do of course with what the markets will do in the coming days or months, although I still sense a bear trap
Opening very ST trades in EWG/ FXI/ BABA.
GDX.
GDX off.
All positions off here more or less flat. Starting to think I’ll see better entries near the close or premarket on Friday.
In order for a fake-out break to the upside to work, it has to seem real. One more push to let’s say 4550 might do it.
Opening FXI/ BABA on respective -2%/ -4% declines in the premarket session.
Opening starters in TLT/ IEF/ TIP.
Opening NIO.
Adding to TLT/ IEF.
Opening AA.
Paring back on BABA.
Adding to NIO.
AA off for a loss.
Adding a third allocation to TLT. However, if the position fails to turn around soon I’ll be taking the hit and moving on.
Taking profits on last allocation of TLT.
Paring back further on BABA.
First two allocations of TLT off for a loss.
Reopening positions in QQQ/ VT.
Imminent short squeeze?
I can think of absolutely no reason to be long right now…which may be reason enough to be long.
NIO off here for a minor loss.
Taking profits on FXI/ BABA.
Taking profits on QQQ/ VT.
All remaining positions (IEF/ TIP) off here.
Turned out to be a pretty good day – partly due to gains in FXI/ BABA, but mostly due to very ST gains in QQQ/ VT.
Intraday high in the SPX thus far is 4546. That may be enough to take the index into overbought territory and trigger the next downside move.
Taking a flyer in SPXU.
And that, in a nutshell – is exactly why I never short. Way too easy to get squeezed. Closing the position for a small loss.