Preface: Explaining our market timing models
We maintain several market timing models, each with differing time horizons. The “Ultimate Market Timing Model” is a long-term market timing model based on the research outlined in our post, Building the ultimate market timing model. This model tends to generate only a handful of signals each decade.
The Trend Asset Allocation Model is an asset allocation model that applies trend following principles based on the inputs of global stock and commodity price. This model has a shorter time horizon and tends to turn over about 4-6 times a year. The performance and full details of a model portfolio based on the out-of-sample signals of the Trend Model can bsoe found here.

My inner trader uses a trading model, which is a blend of price momentum (is the Trend Model becoming more bullish, or bearish?) and overbought/oversold extremes (don’t buy if the trend is overbought, and vice versa). Subscribers receive real-time alerts of model changes, and a hypothetical trading record of the email alerts is updated weekly here. The hypothetical trading record of the trading model of the real-time alerts that began in March 2016 is shown below.

The latest signals of each model are as follows:
- Ultimate market timing model: Buy equities
- Trend Model signal: Bearish
- Trading model: Neutral
Update schedule: I generally update model readings on my site on weekends and tweet mid-week observations at @humblestudent. Subscribers receive real-time alerts of trading model changes, and a hypothetical trading record of those email alerts is shown here.
Subscribers can access the latest signal in real-time here.
A sentiment reset
The stock market staged a relief rally, sparked by excessively bearish sentiment readings. The weekly AAII bull-bear spread had fallen into buy signal territory. Not surprisingly, the stock market bounced. The latest AAII readings have begun to normalize into neutral territory.

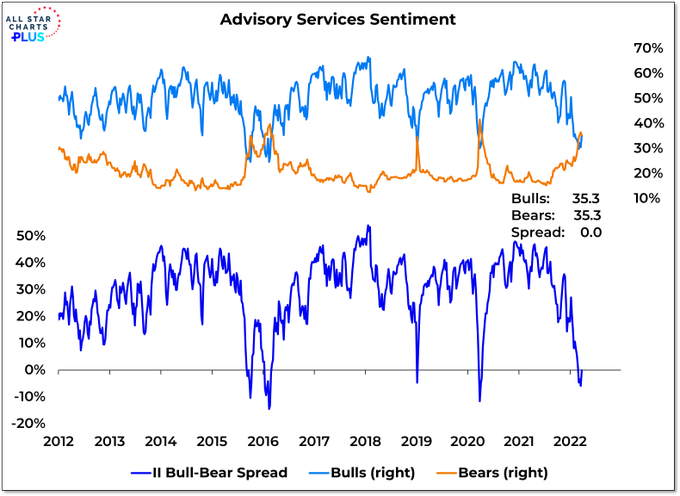
An analysis of Investors Intelligence tells a similar story. The bull-bear spread has begun to revert from negative, which is historically a tactical buy signal, to zero.
Can the bullish impulse continue? Here are bull and bear cases.
Strong momentum
The stock market exhibited strong positive momentum in the latest rally. Numerous historical studies, such as this one from Jonathan Harrier, indicate that forward returns after such events were extremely strong. The blogger Macro Charts also posted a study with similar bullish conclusions based on NASDAQ 100 returns.

I outlined the reasons why I believe this is a bear market and to be intermediate-term cautious last week (see Trading the Relief Rally). While bear market rallies are normally short and vicious, Real Money columnist Helene Meisler documented instances when bear market rallies can be long lasting. She cited the example of the 9/11 market bottom in 2001, the subsequent advance in 2002, followed by a second low in July 2002.

She also highlighted the multi-month bear market rally in 2008 before the market fell to a final panic low.

Can momentum win the day?
The key question for traders is whether price momentum can prevail and win the day. Friday’s release of the Commitment of Traders report showed that large speculators, or hedge funds, sold the rally. (As a reminder, the CoT report shows positions from Tuesday to Tuesday and it is released Friday afternoon). While CoT data leads to a contrarian bullish conclusion, the S&P 500 exhibited a negative RSI momentum divergence, which is bearish.

What stood out in the CoT report was the heavy sales in S&P 500 futures, as large speculator positions moved from substantially net long to net short.

Net sales were observed across the board. Large speculators sold NASDAQ 100 futures…

…And they sold Russell 2000 futures, though the magnitude of the sales was not as large as the ones seen in S&P 500 futures.

Macro
Charts pointed out that this level of sales has a record of being contrarian bullish.
Charts pointed out that this level of sales has a record of being contrarian bullish.

A weak overbought market
The bull and bear debate comes down to the strength of the momentum signal. The market is short-term overbought. Both the NYSE and NASDAQ McClellan Oscillators reached overbought conditions last week, which are cautionary signals.

While the market is overbought, it is not showing a strong “good overbought” condition that is characteristic of a momentum-driven advance. The percentage of S&P 500 bullish on point and figure charts stalled at about the 70% level, which is shy of the 80% threshold for a “good overbought” reading. As well, both NYSE and NASDAQ net 52-week highs-lows are weak, which is also indicative of weak momentum.

As well, equity risk appetite, as measured by the equal-weighted consumer discretionary to staples ratio and the high beta to low volatility stock ratio, is exhibiting negative divergences against the S&P 500.

If price momentum were to falter, that would be the setup for a sell signal. The S&P 500 Intermediate-Term Breadth Oscillator reached an overbought condition last week. A sell signal is generated when it recycles back to neutral. In the past five years, there were 21 such signals; 14 of them resolved in a bearish manner (pink lines) and 7 bullishly (grey lines). These episodes include strong rallies off V-shaped bottoms in 2019 and 2020.

A sell signal may be imminent. Do you want to play those odds of this model if momentum were to weaken?
In conclusion, the market is extended in the short run and rally may be starting to show signs of exhaustion. While momentum is strong strong and it would be too soon for traders to take bearish positions, I am seeing the set-up for a sell signal, which should appear soon.

The Harrier chart shows days to max drawdown less than days to max gain for all time perspectives, in particular 1 month. This implies a drop first.
Secondly, the RSI shows slowing momentum. Two aggravating factors: the very tops have been flattened by the nature of the RSI, and it shows a 5-day average, which mean the instantaneous momentum is lower than it looks. Also, at this level it is very prone to quick drops. I expect negative momentum within 1 or 2 days.
That’s the first thing I noticed as well. A rather quick pullback followed by a steep rally. Followed in turn by deeper pullbacks that take longer to recover.
On March 1 I had some money that I was not using for trading. I decided to invest in the stock market with only one criteria – that the sectors I selected should be up for the year. Equal sum of money was invested in each sector. The following trades were made close to the open:
XME 54.18 63.33
XOP 119.75 138.60
XAR 122.618 126.59
DBA 21.34 22.25
GDX 35.67 38.72
On the right are the closing prices. To my surprise the results are amazing – 9.74%. Granted, there was an element of luck that selection included XOP. However, it does not negate from the fact that more important then “market timing” i.e. RSI, Put Call ratio, Over Bought Over Sold etc., Sector Selection and Stock Selection is more important based on momentum and Relative Strength (not RSI) but compared to the S&P.
Here is Newton’s Law:
Newton’s second law, in its most general form, says that the rate of a change of a particle’s momentum p is given by the force acting on the particle; i.e., F = dp/dt.
In the Stock Market in my case prices were going up in a down market and were up for the year.
This chart of FedFunds futures sends a chill right through me. It is like a destructive asteroid heading to financial markets.
https://product.datastream.com/dscharting/gateway.aspx?guid=b09a8fcf-74a4-4e00-a5dd-62ef2d431b37&action=REFRESH
The futures for this December are up fully one percent in the last three weeks to 2.25% or eight quarter point hikes or four half points.
Bonds are also plunging. These are bull market killers since they create recessions. Note Home Construction ETF a key economic sector is crashing.
The rocketing Fed Fund Futures remind me of February 2020 when experts were warning about the pandemic and few investors listened.
The downswing on 2018 and 2020 were short and the bull was back on. The Fed and government spending saved the day quickly. With inflation soaring and employment super strong don’t expect a Fed rescue. This bear could be long and nasty.
I’m proud to say I’ve been short listed (10) for Wealth Professional Magazine’s Discretionary Portfolio Manager of the Year Award in Canada. I have to submit my story. Early June is the announcement of the winner.
If the judges finally favor forward looking asset allocation that I use over classic fixed structure that others use, I have a good shot of winning.
Cam and your guys learned comments are a big help. Thanks.
Good Job Ken,
Congratulations.
Congratulations, Ken!
I view being short listed as a greater honor than whether one wins the final award, as 99% of the recognition lies in making the list.
Congrats Ken!
Congratulations, Ken!
Well-deserved!
Congratulations Ken!
Congrats!
Congratulations.
Congrats Ken, would be well reserved.
Call me stupid if you wish, but I don’t see a recession helping the average Joe. Great you are saving gas money because you have no job, or the price of food is down because more people cannot afford food. The logic is circular and makes no sense. Of course if stuff is not selling, a bottleneck in production doesn’t matter does it?
What will happen of course ,will happen, but there is a factor that I would like to point out. The USA has lots of natural gas, and at way better prices than Europe or Japan. We also have great supplies of oil compared to Europe and Japan. Fertilizer, food etc we are not as impacted as Europe or Japan. I don’t know about Brazil and oil, how Petrobras is doing, but my point is that America may have a competitive advantage. The cases of covid in the USA are less than in Europe, so money may move to the US market based on this and appreciating Forex rates.
We could find ourselves watching the last hurrah of the S&P even though things look nasty. In the Dotcom bust there was a similar phenomenon…Y2k bug…everyone was freaking out getting their hardware/software upgraded for the biggest CyberDerp of the century…nothing happened, but the tech stocks that were most at risk went parabolic in the face of this uncertainty and then once 2000 rolled in and nothing happened, the peak was in by March and it was over. So now in spite of the rate hike threat, we might see the same thing. Markets are not rational.
Has Powell said anything about how the Federal deficit will be handled once rates are up by 500 to 1000%? How’s that going to work?
I’d also add that the US economy is already slowing down. You can see the impact on higher inflation and higher mortgage rates. Perversely, this may force the hands of the Fed. Forget about 7-8 25bps rate hikes this year. The Fed might be done much sooner. If that happens, it may also provide a boost to equities (growth stocks).
Congratulations Ken! You help us a lot
Congratulations Ken! Thanks for your comments.
Reopening a position in GDX in the premarket session ~37.0x. Risk/reward seems good here.
Smaller position in AA on the early -5% pullback.
What’s driving today’s rebalancing is potentially positive news re a ceasefire.
Buy on the sound of cannons. Sell at the sound of trumpets?
EWG gapping up +3.74%. Is it a buy here, or do you wait for a pullback?
Prices always move farther (up or down) than we think possible.
Bonds might be the next big trade…
Lots of emotional rebalancing going on.
Closing GDX here for a minor gain.
Closing AA here for a minor loss.
I’m going to sit things out until I have a better plan in mind.
Opening VT/ FXI here.
What’s the last thing anyone expects here? Probably a melt-up.
Not saying that’s the high odds trade. But it may be the trade to take…
Adding to VT/ FXI here. Opening a position in BABA.
My sense is that FOMO will really kick in once a Russian withdrawal sinks in. Also that the early morning pullback may be the best entry price we’ll see…
Biting the bullet and opening EWG here. I hate to chase…but the decision comes down to whether I think it trades higher from here.
I think it’s appropriate to view the following with skepticism. But it’s the skepticism that may (or may not) be presenting an interim buying opp.
“‘Moscow says it will “drastically reduce military activity” on two fronts — Kyiv and Chernihiv — according to the Russian Ministry of Defense Telegram channel.
“Russian Deputy Defense Minister Alexander Fomin confirmed “to radically, at times, reduce military activity,” according to state media RIA.
The move follows talks between Russian and Ukrainian delegations in Istanbul on Tuesday.
“”Due to the fact that negotiations on the preparation of an agreement on the neutrality and non-nuclear status of Ukraine, as well as on the provision of security guarantees to Ukraine, are moving into practice, taking into account the principles discussed during today’s meeting, by the Ministry of Defense of the Russian Federation in order to increase mutual trust and create the necessary conditions for further negotiations and achieving the ultimate goal of agreeing on the signing of the above agreement, a decision was made to radically, at times, reduce military activity in the Kiev and Chernigov direction,” Fomin told reporters.”
That Russia’s advance on Kiev had failed for the moment was actually old news. The economically important decision looms now that Europeans have decided not to pay for gas in Rubles and Russia wants to make a decision until Thursday if that means that gas “shipments” are now subject to being halted. Putin’s tactic is to signal progress in peace talks in order to make EU and US hesitant to impose more sanctions while military forces are being regrouped and reinforcements are coming in.
Marketwatch ran a headline yesterday labeling Cramer’s call re the end of the bear market a contrarian call to fade. Which in hindsight may have itself been a contrarian call to fade.
Closing positions in BABA here.
Closing FXI.
Closing all remaining positions (VT/ EWG) here.
Not seeing the kind of follow-through momentum I expected. Will look for reentries later in the day.
Looks like I bailed just in time.
If the selling accelerates in the close I would consider opening small positions in KRE/ SMH for an after hours/ early morning bounce.
Wasn’t fast enough to catch the bounce.
Should have given bonds a little more room.