Preface: Explaining our market timing models
We maintain several market timing models, each with differing time horizons. The “
Ultimate Market Timing Model” is a long-term market timing model based on the research outlined in our post,
Building the ultimate market timing model. This model tends to generate only a handful of signals each decade.
The
Trend Asset Allocation Model is an asset allocation model that applies trend following principles based on the inputs of global stock and commodity prices. This model has a shorter time horizon and tends to turn over about 4-6 times a year. The performance and full details of a model portfolio based on the out-of-sample signals of the Trend Model can be found
here.
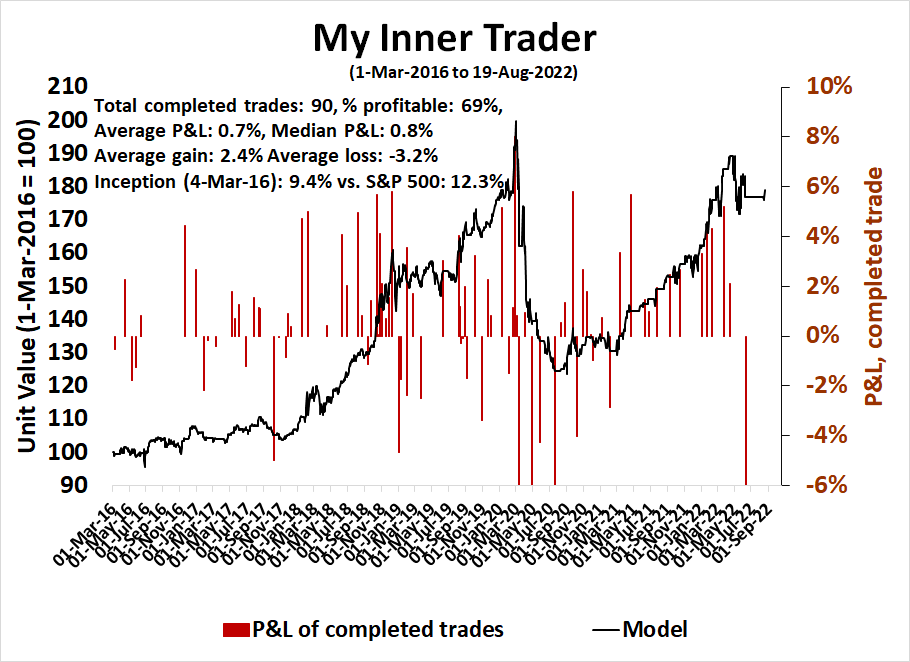
My inner trader uses a
trading model, which is a blend of price momentum (is the Trend Model becoming more bullish, or bearish?) and overbought/oversold extremes (don’t buy if the trend is overbought, and vice versa). Subscribers receive real-time alerts of model changes, and a hypothetical trading record of the email alerts is updated weekly
here. The hypothetical trading record of the trading model of the real-time alerts that began in March 2016 is shown below.
The latest signals of each model are as follows:
- Ultimate market timing model: Sell equities
- Trend Model signal: Bearish
- Trading model: Neutral
Update schedule: I generally update model readings on my site on weekends and tweet mid-week observations at @humblestudent. Subscribers receive real-time alerts of trading model changes, and a hypothetical trading record of those email alerts is shown here.
Subscribers can access the latest signal in real-time here.
A bullish reversal
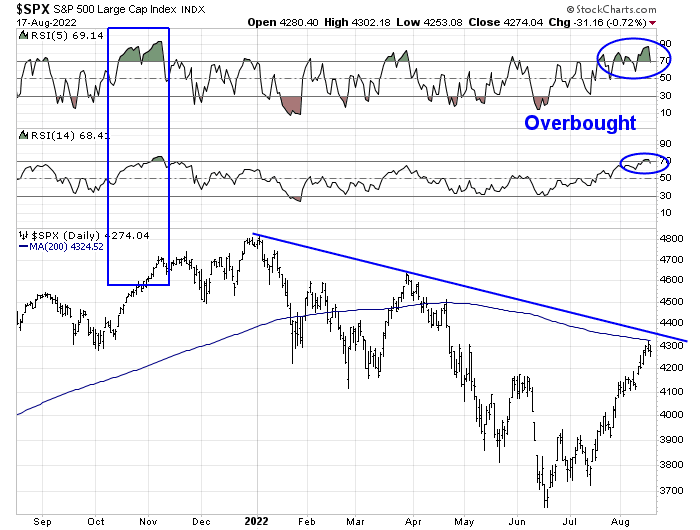
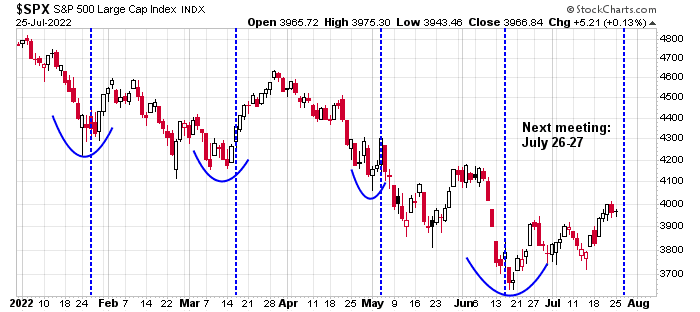
In the past month, I have been constructive on US equities in the face of growing doubts about the macro and fundamental environment. our cautious optimism had been met with skepticism. Now that the S&P 500 has rallied above a falling channel and regained its 50 dma, the tone on our social media feed has turned more bullish.
While it’s nice to feel some vindication, investors shouldn’t make the complete about-face from bear to bull just yet.
A turn in sentiment
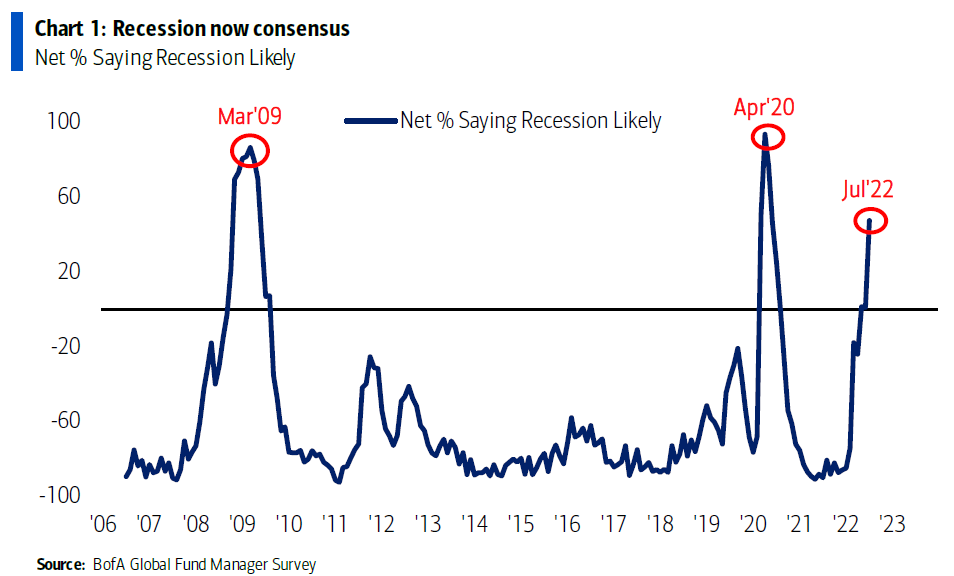
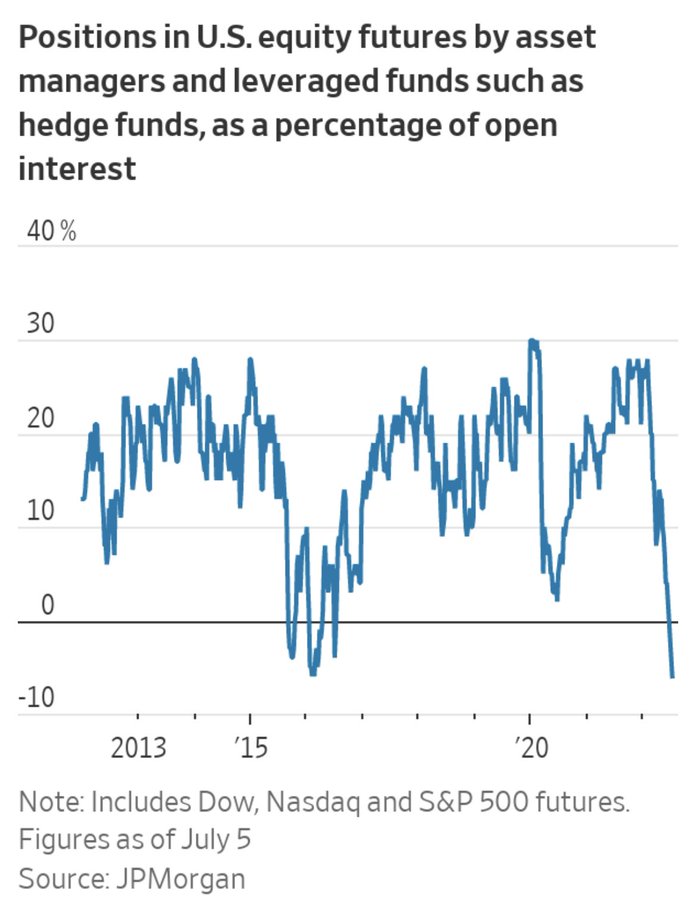
The narrative is changing. The latest BoA Global Fund Manager Survey shows institutional risk positioning at a historical extreme, which led to a stampede of contrarian bullish calls.
Sentiment model readings have begun to normalize. The AAII bull-bear spread has recycled from a bearish extreme reading to -12.6, which is in the neutral zone.
Similarly, the Investors Intelligence bull-bear spread has risen to zero from negative for the first time in 12 weeks. There are now an equal number of bulls and bears.
Market breadth is improving. The percentage of S&P 500 stocks above their 50 dma has risen to just under 60% from a bearish extreme of 2.6% at the June low. While net new highs are still negative, the trend has been steadily rising.
Does that mean the bulls have seized control of the tape?
A bear market rally?
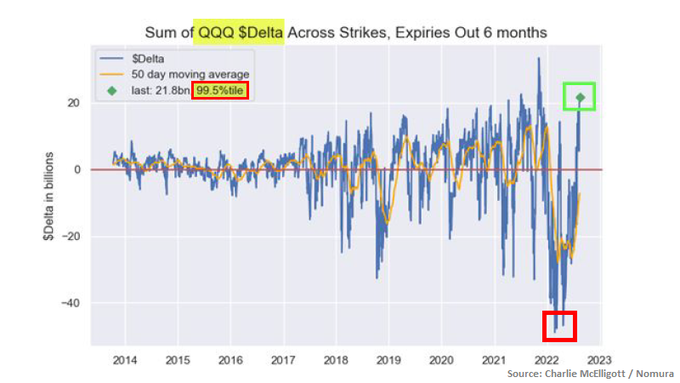
While I am open to the possibility that this is the beginning of a new bull leg, some caution is warranted. Keep in mind that the current rally has mainly been driven by short covering.
Don’t forget that the NASDAQ 100 underwent several powerful bear market rallies during the 2000-2002 period before it finally bottomed. Many of those episodes featured strong overbought readings which could have been signs of “good overbought” advances.
Key risks
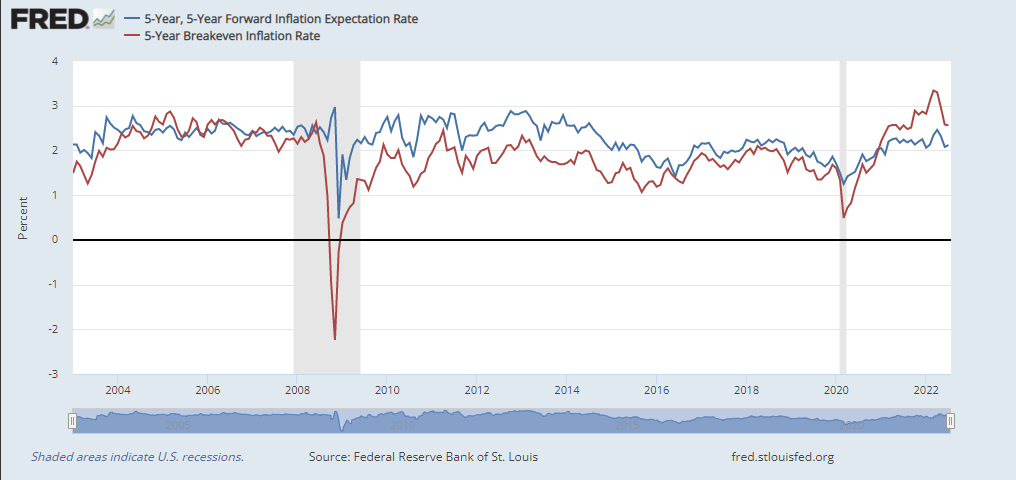
Here are some of the risks that are keeping me awake at night. The Conference Board’s Leading Economic Index (LEI) fell -3.7% annualized in the last six months. Going back to 1960 a recession has always occurred when the LEI reached this level.
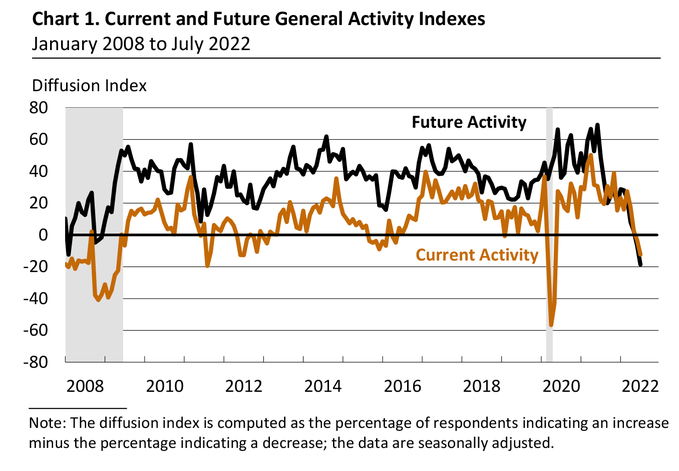
The Philly Fed’s Manufacturing Business Outlook Survey is painting a picture of tanking economic activity as the FOMC meets next week and hikes into a weakening economy.
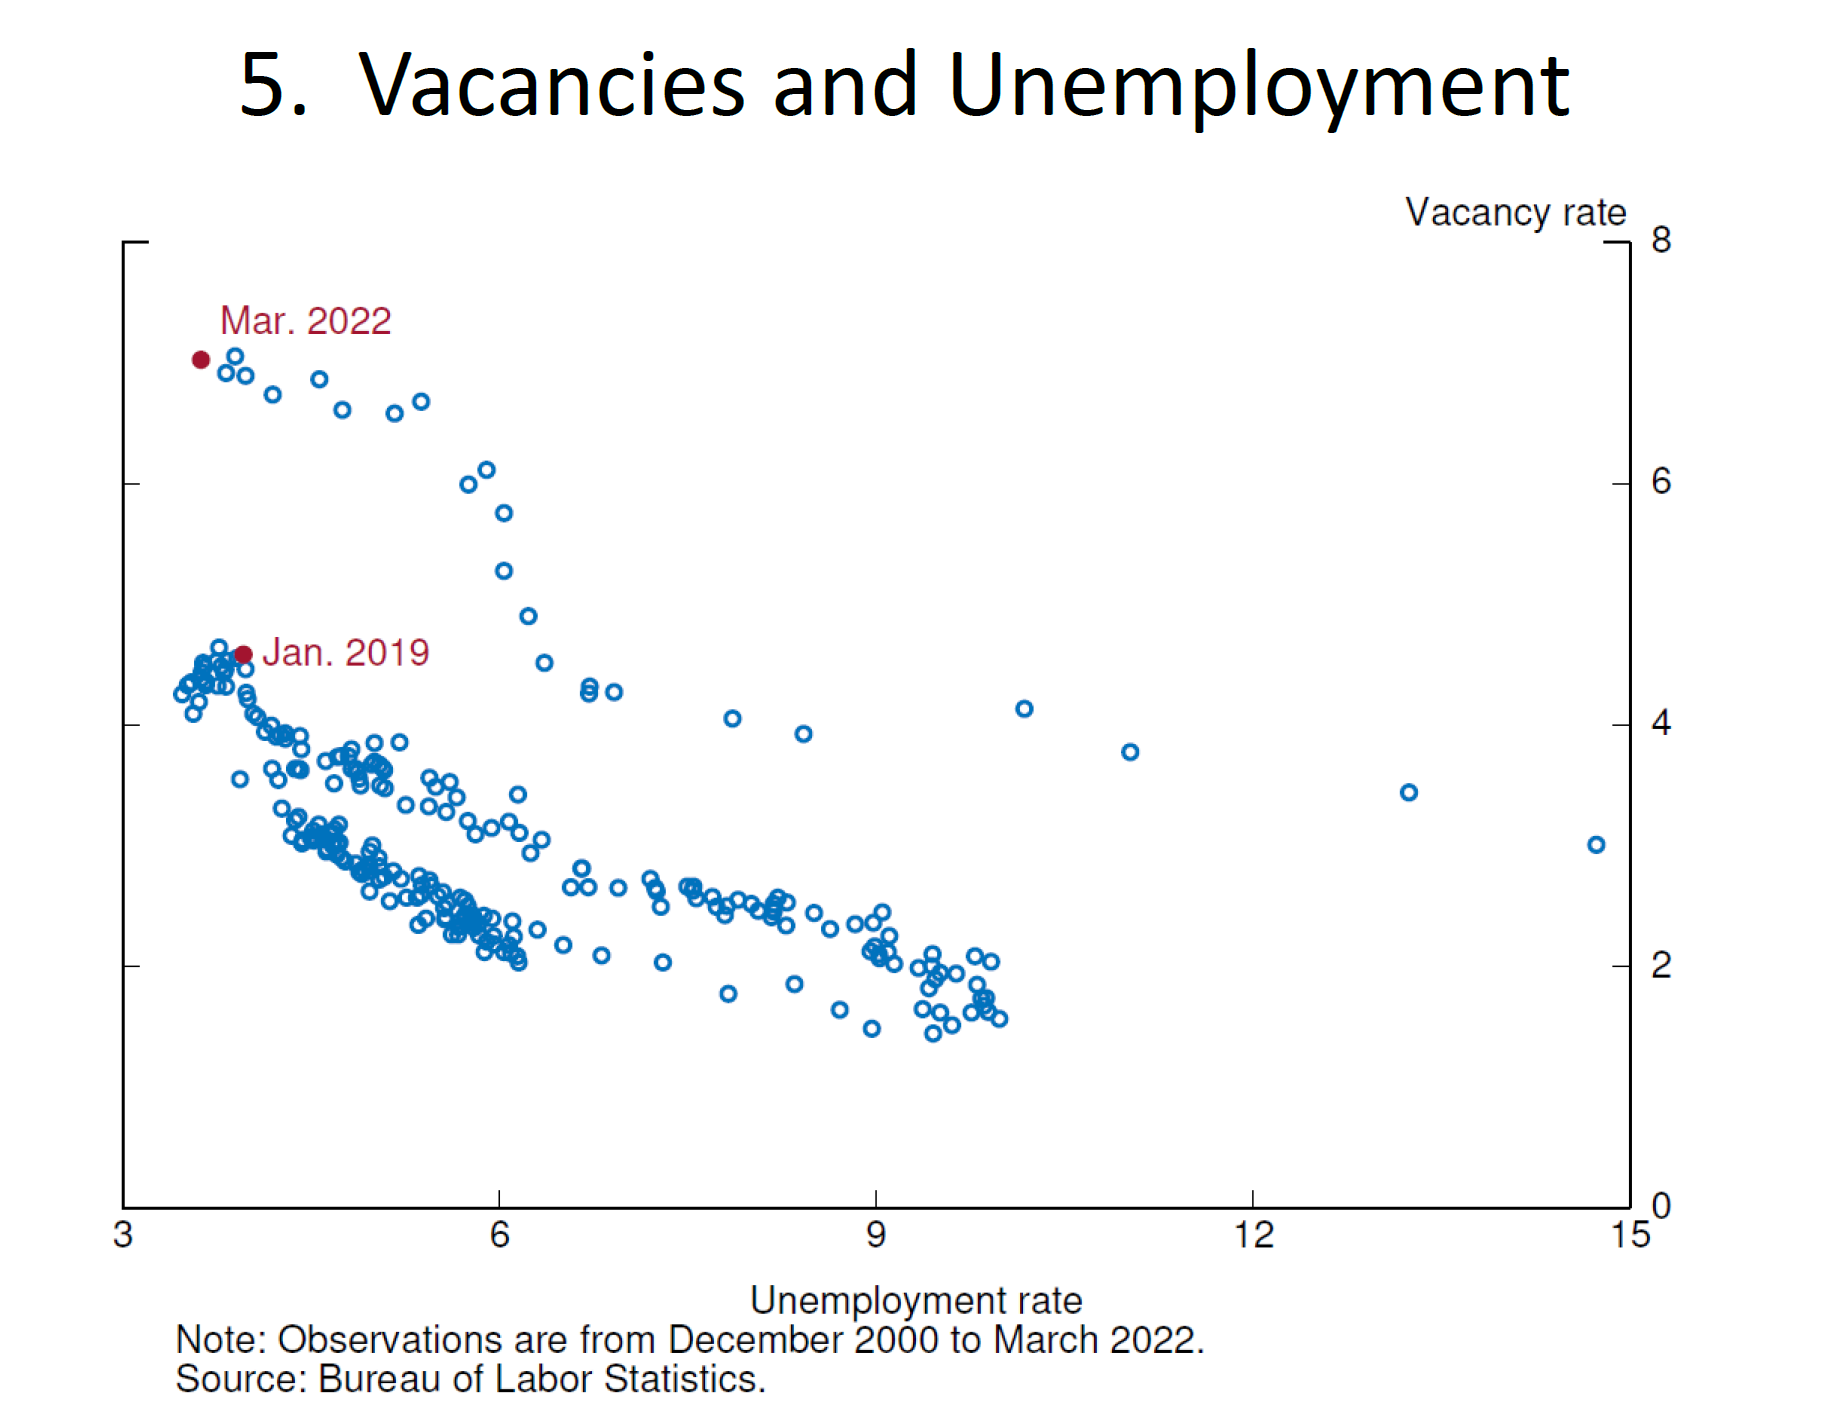
Initial jobless claims have bottomed and they are rising. This is a sign of a weakening jobs market, just as the Fed adopts an aggressive tightening policy.
European risks
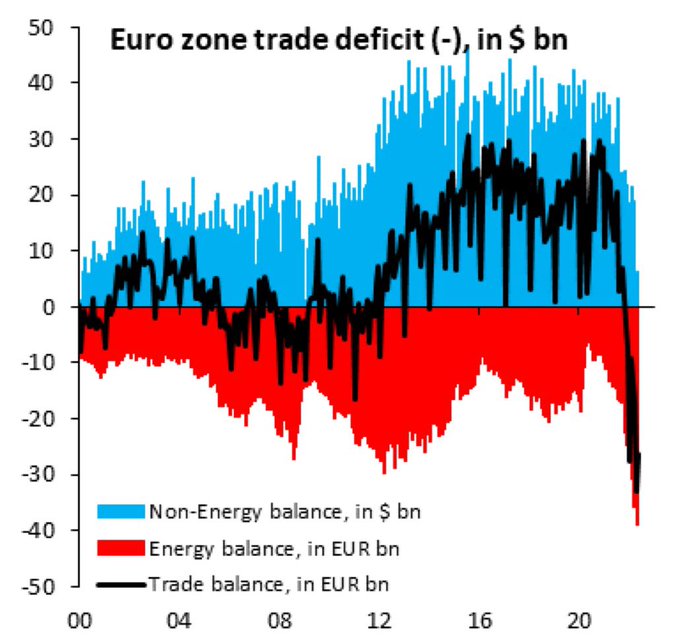
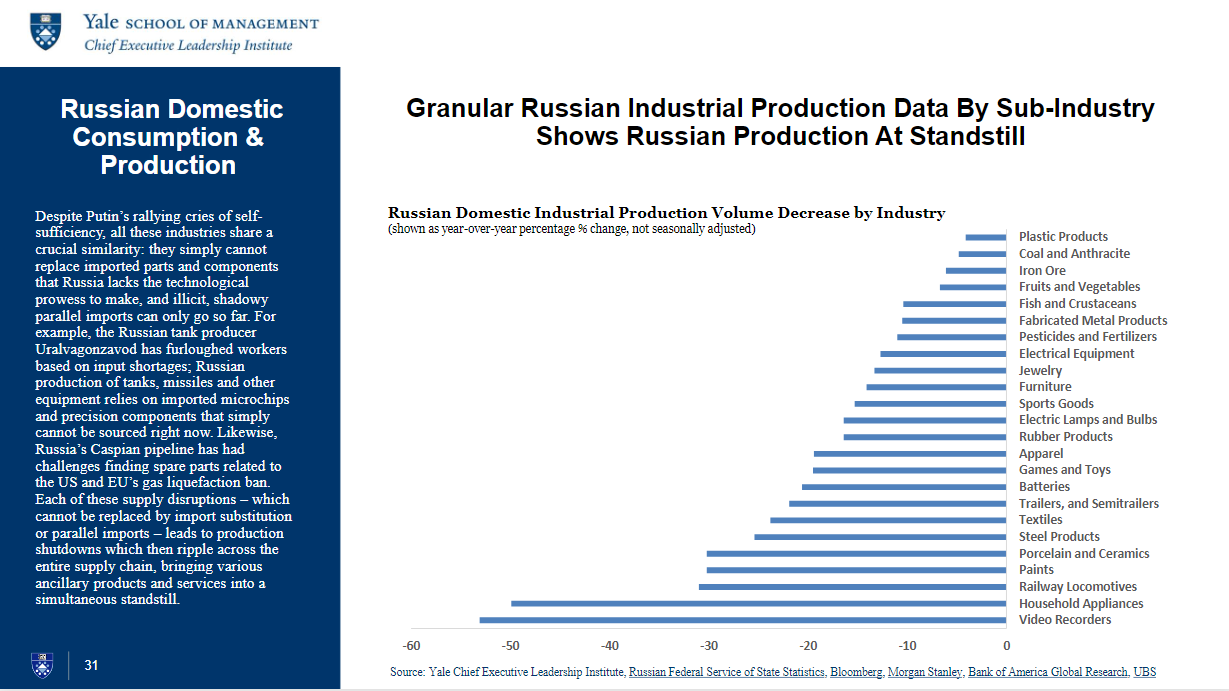
Across the Atlantic, Europe has been buffeted by a combination of war and a heatwave that underscores the EU’s vulnerability to climate change.
Germans breathed a brief sigh of relief when the Nord Stream 1 gas pipeline restarted after a scheduled shutdown for maintenance. Initial flow rates have begun at 30% of capacity, but as the history of gas supplies shows, Putin has weaponized energy in retaliation for EU sanctions in the aftermath of the war.
In response, the European Commission proposed a plan to reduce natural gas consumption by 15% through rationing, but it appears to be in very serious trouble. Spain, Greece and Portugal have rejected it. Others, such as Italy and Poland, have raised deep reservations.
Even as Germany reluctantly pivoted to the use of coal as a substitute for gas as an energy source, the heatwave has lowered river levels. Water levels on the Rhine are the lowest for the time of year for over a quarter of a century. This restricts freight traffic and is an indication of the stress for coal and nuclear power plants which rely on river water for cooling.

The monetary authorities aren’t helping matters. The ECB just raised rates by 50 bps and rolled out a Transmission Protection Instrument (TPI) to control “fragmentation”, or peripheral spreads blowing out. TPI “would be conducted such that they cause no persistent impact on the overall Eurosystem balance sheet and hence on the monetary policy stance”. In other words, it’s an Operations Twist where the ECB buys peripheral paper at the expense of core debt. Christine Lagarde has in effect traded support for the periphery for a more hawkish rate hike. It remains to be seen how this policy will play out, especially when the Mario Draghi’s government lost support in Italy and an election may have to be called.

Just like the U.S., eurozone monetary tightening is occurring just when the economy is slowing. Eurozone July Flash PMI fell from 52.0 to 49.4, indicating contraction. The last time the ECB hiked into falling PMI readings was 2011 and monetary policy was reversed as rates eventually turned negative. It will be difficult for the ECB to repeat that performance in the face of global inflationary pressures.
Emerging market risks
It is said that central banks tend to raise rates until something breaks. The canaries in the global coal mine are the emerging market economies, and EM countries are breaking.
In the past few weeks, the government in Sri Lanka fell because of protests over a collapsing economy. Pakistan is teetering. Inflation sparked riots have appeared in Panama, Malawi, and Uraguay. EM debt defaults have spiked to historically high levels. Turkey announced that it brokered a deal between Russia and Ukraine to ship grain through the Black Sea. Hopefully, the agreement should alleviate some of the pressures on food supplies and on inflation.
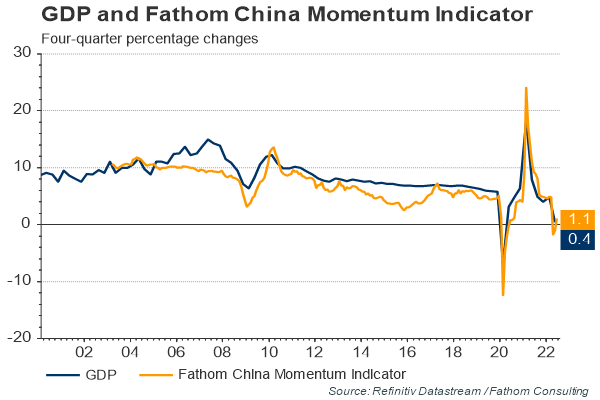
China, the EM elephant, is seeing weakness in its property market.
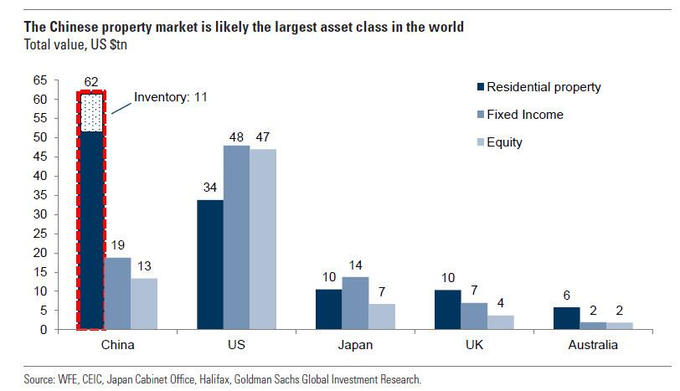
As a sign of desperation, some property developers are accepting produce, such as garlic, watermelons, wheat and barley as down payments from farmers on new apartments. Some homebuyers have gone on strike and refused to pay the mortgage on incomplete projects where the developers have stopped work. Contagion risk is rising as some suppliers have also joined the boycott until the developers pay them. Beijing is considering declaring a mortgage grace period for buyers to alleviate pressure, but it remains to be seen whether how much of the stress leaks into the Chinese banking system. This matters because China’s property market may be the largest asset class in the world.
Bottom calls everywhere
Despite the negative macro backdrop, there is still hope for the bulls. That’s because markets are inherently forward-looking and price behavior is a key factor in the equity market’s outlook.
Indeed, bottom calls are all coming out of the woodwork. Jason Goepfert of SentimenTrader recently pointed to an indicator with a perfect track record, though the sample size is small.
I have two ways of resolving the question of whether the latest advance represents a bear market rally, or the start of a V-shaped recovery. One is fundamental and the other technical.
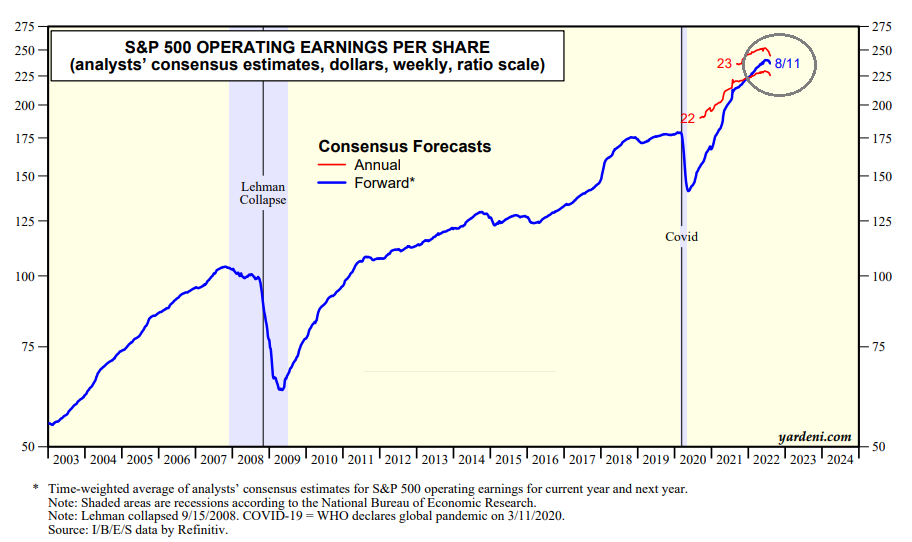
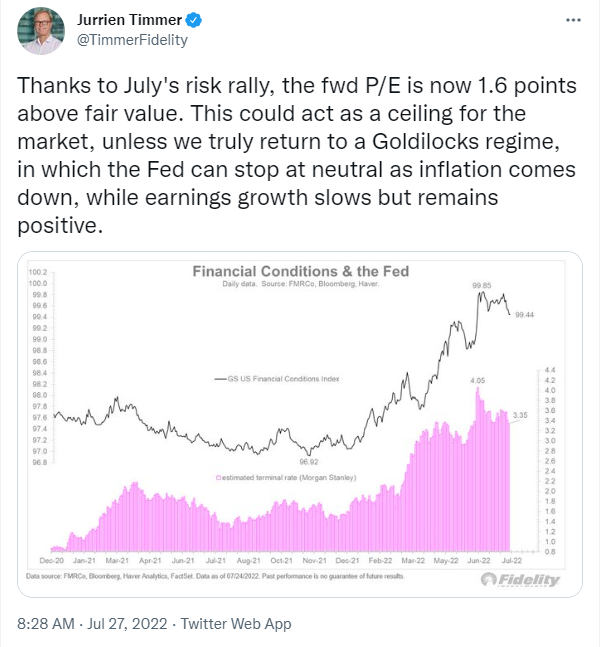
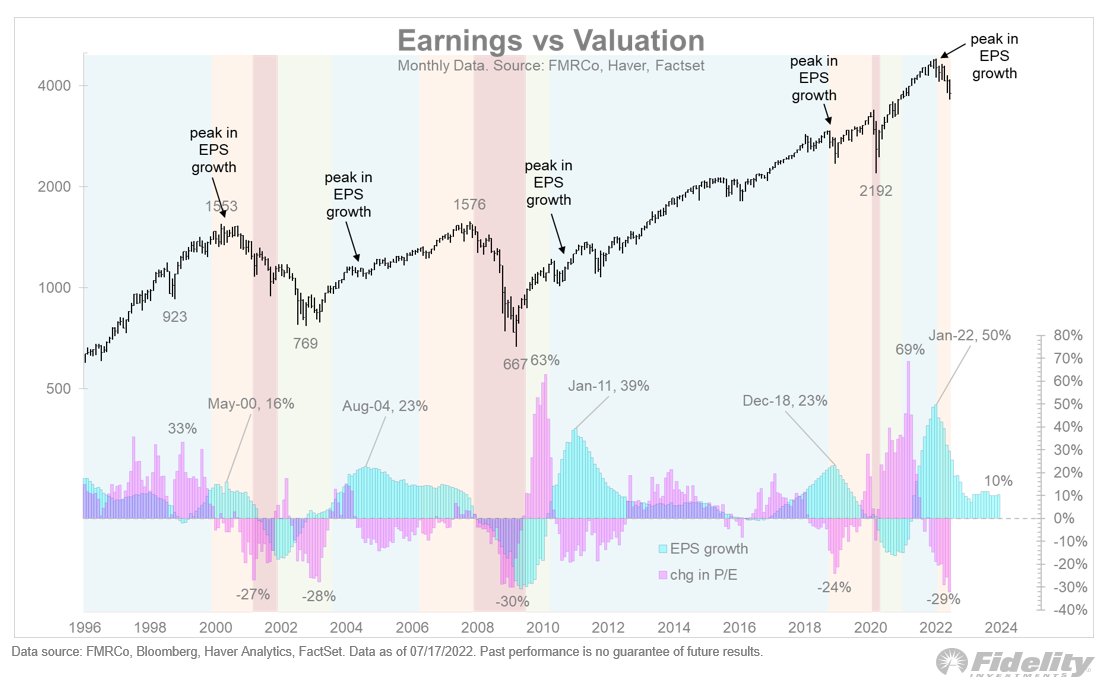
Jurrien Timmer at Fidelity showed this chart of changes in the P/E ratio (pink) compared to forecast earnings growth (cyan) and rhetorically asked:
Are we witnessing the beginning of an earnings contraction, or is the rate of growth merely slowing? The answer will determine whether the current 25% drawdown will be the end of this valuation reset, or the start of a full-fledged recession bear market.
While it’s still early in Q2 earnings season, the preliminary results show that both EPS and sales growth beat rates are coming in at below historical averages. Investors will find out if the Street aggressively downgrades EPS forecasts in the coming weeks.
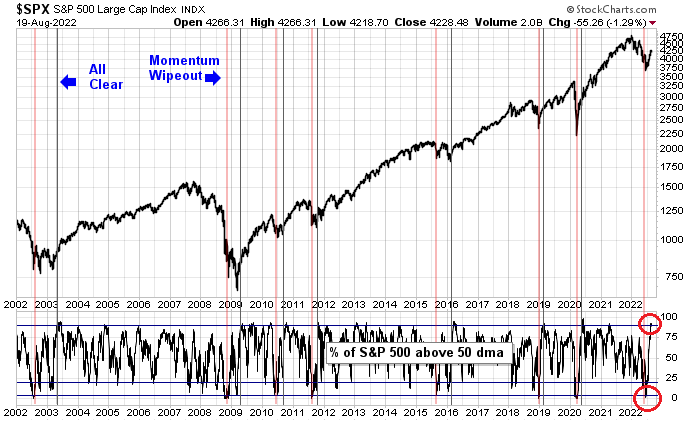
From a technical perspective, the market experienced a breadth wipeout when the percentage of S&P 500 stocks above their 50 dma fell below 5% and recovered to above 20%. There have been seven similar episodes in the last 20 years and all have marked major market bottoms. However, the market went on to weaken and re-test the old lows in five of the seven episodes. Only two were V-shaped bottoms. The rest saw positive 14-day RSI divergences on the re-tests.
I am inclined to play the odds. My base case scenario calls for a failed rally, followed by a re-test of the lows. However, we remain open to the possibility of a V-shaped bottom, but the bulls need to demonstrate strong positive price momentum to convince me. Dean Christians at SentimenTrader offered his “bear killer” model, where he looks for the first instance of the percentage of S&P 500 stocks above their 50 dma to spike above 90% after an initial decline of -20% in the S&P 500. This model has not flashed a buy signal yet.

In conclusion, the tone of stock market action has become more constructive and investor sentiment is turning from bearish to bullish. While I am turning more bullish on stocks longer term, the jury is still out as to whether the latest advance is the start of a V-shaped bottom. Fundamentally, I am monitoring the evolution of earnings estimates as Q2 earnings season progresses. As well, durable advances are accompanied by strong price momentum, which the bulls haven’t demonstrated yet.