Preface: Explaining our market timing models
We maintain several market timing models, each with differing time horizons. The “Ultimate Market Timing Model” is a long-term market timing model based on the research outlined in our post, Building the ultimate market timing model. This model tends to generate only a handful of signals each decade.
The Trend Asset Allocation Model is an asset allocation model that applies trend following principles based on the inputs of global stock and commodity price. This model has a shorter time horizon and tends to turn over about 4-6 times a year. The performance and full details of a model portfolio based on the out-of-sample signals of the Trend Model can bsoe found here.

My inner trader uses a trading model, which is a blend of price momentum (is the Trend Model becoming more bullish, or bearish?) and overbought/oversold extremes (don’t buy if the trend is overbought, and vice versa). Subscribers receive real-time alerts of model changes, and a hypothetical trading record of the email alerts is updated weekly here. The hypothetical trading record of the trading model of the real-time alerts that began in March 2016 is shown below.

The latest signals of each model are as follows:
- Ultimate market timing model: Buy equities
- Trend Model signal: Neutral
- Trading model: Bullish
Update schedule: I generally update model readings on my site on weekends and tweet mid-week observations at @humblestudent. Subscribers receive real-time alerts of trading model changes, and a hypothetical trading record of those email alerts is shown here.
Subscribers can access the latest signal in real-time here.
Estimating downside risk
Last week, I highlighted a sell signal from the intermediate-term breadth momentum oscillator (ITBM). The 14-day RSI of ITBM had recycled from an overbought condition, which was a sell signal for the stock market. In the past, ITBM sell signals have resolved with 5-10% drawdowns and the market bottomed with the ITBM RSI fell to an oversold or near oversold condition.

The S&P 500 fell -5.8% since the sell signal and RSI is oversold. Does this indicate a short-term bottom, or is this the start of a major bear leg?
The bull case
Here are the bull and bear cases. The market is oversold and due for a relief rally. The percentage of S&P 500 stocks above their 10-day moving averages (dma) has reached levels consistent with short-term bottoms.

As well, the Zweig Breadth Thrust Indicator has fallen into oversold territory (grey bars). As a reminder, a ZBT buy signal occurs when the indicator rises from an oversold to overbought condition within 10 trading days. These signals are extremely rare (red dotted line) and I am not anticipating such a buy signal. Nevertheless, a ZBT Indicator oversold condition has usually marked short-term bottoms in the past.

Two of the four components of my bottom spotting model have flashed buy signals. In the past, such episodes have signaled tradable bottoms with reasonable accuracy. The VIX Index spiked above its upper Bollinger Band, indicating oversold conditions, and the NYSE McClellan Oscillator (NYMO) has also fallen to oversold levels. Only the term structure of the VIX hasn’t inverted and TRIN hasn’t risen above 2, which are indicators of short-term panic.

While market-based sentiment indicators such as the VIX term structure and TRIN have not signaled fear, survey-based indicators have. Mark Hulbert revealed that his newsletter sample of NASDAQ market timers had become sufficiently bearish to flash a contrarian buy signal. Sentiment is more bearish than it was at the March 2020 bottom.

Indeed, the normalized ratio of the NASDAQ 100 to S&P 500 has reached historically important oversold conditions that NASDAQ stocks are likely to see low relative downside risk at current levels.

That said, Hulbert also his regular sample of market timers are not bearish enough to be in the lowest decile reading to flash a contrarian buy signal, though readings are close.

Similarly, the latest AAII weekly survey shows a spike in bearish sentiment and a bull-bear spread of -25.7. In the past, bull-bear sentiment spreads below -20 have marked low-risk long entry zones for equity investors.

The bear case
While sentiment models are showing a retreat in bullishness, some models indicate a stubborn lack of bearishness. This could be interpreted as the market due for a short-term bounce, but a durable bottom isn’t in sight just yet.
For example, the Investors Intelligence survey shows the bull-bear spread in retreat, but a lack of a spike in bearishness. This could be interpreted as an oversold market, but the absence of panic and washout translates to greater intermediate-term downside risk.

Helene Meisler conducts a weekly unscieintific poll every weekend. To my surprise, the bulls slightly edged the bears despite last week’s carnage in stock prices. Sentiment may still be too complacent and traders are not panicked enough yet.

Similarly, while the VIX Index had risen above its upper Bollinger Band, indicating an oversold market, the width of the Bollinger Band remains relatively narrow and not wide enough to be consistent with intermediate-term bottoms.

Other market internals are also problematic. Indicators of equity risk appetite are exhibiting negative divergences, which is disturbing for the bulls.
 |
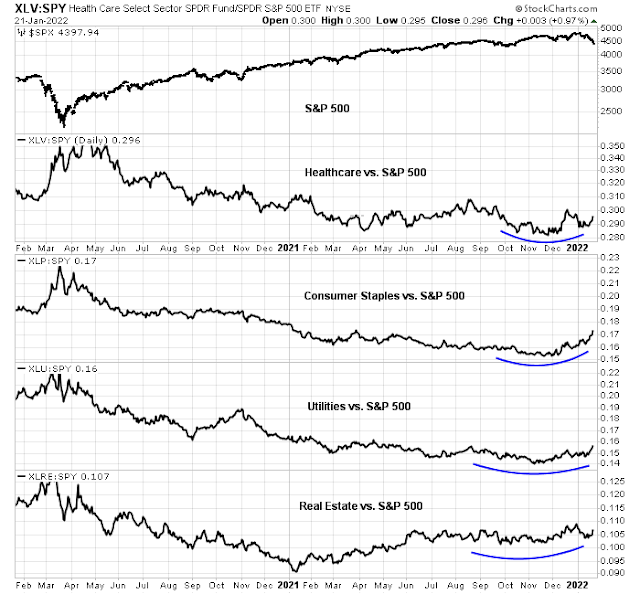
The relative performances of defensive sectors are all forming saucer-shaped bottoms, indicating that the bears have gained control of the tape.
What to watch
How can we resolve this bull and bear debate? First, recognize that the market is stretched to the downside and a short-term relief rally can happen at any time. Much will depend on how the market behaves after the bounce.
Here is what I am watching. The percentage of S&P 500 stocks has fallen through the 50-60% zone that defines up and downtrends. If the market were to rally, can this indicator regain the 60% level?

Support and breadth indicators can also be useful guides. The S&P 500 is testing its 200 dma, which should act as a support level. As well, the weakness in the S&P 500 is overstating index weakness. The equal-weighted S&P 500, which represents the average stock in the index, has been outperforming its float-weighted counterpart since early December, which is constructive.

In conclusion, the stock market is sufficiently oversold that a relief rally is likely in the short run. However, stock prices remain vulnerable to intermediate-term downside risk. Subscribers received an email alert that my inner trader had bought an S&P 500 position as a short-term trade.
Traders and investors should monitor the development of market internals should the rally materialize. The FOMC meeting in the coming week could prove to be a catalyst for volatility and greater clarity on market direction.
Disclosure: Long SPXL
Given that I’m currently positioned long, I have three interesting scenarios around which to trade.
(a) Does Friday’s selloff mark the end of the current decline?
(b) If so, does Friday’s level mark a durable low?
(c) If not, how much further downside am I willing to endure?
As of this morning, I’m assigning odds of 70/30 and 50/50 to (a) and (b), and an additional -2% to (c).
The numbers really don’t mean much in terms of predictive power – but since I’m the guy responsible for making my trading decisions, they provide a mental framework around which I’m able to make adjustments. And there’s nothing worse when trading than being unprepared.
For trading purposes, I am watching VIX closely. I have triggers for VIX declining to 26 and 24 to initiate and add to long trading positions. VIX is currently lower than it was at the last 5% pullback indicating somewhat less fear.
The support level on SPX that I am watching is 4280-4240, about 3% lower. I intend to go long for trading at that point as well.
What I have been musing about all weekend is “The wall of worry”….it just really fits somehow….so I am expecting a difficult time grinding up.
The market is telling us what? Well, we have a pandemic, messed up supply chains, inflation, the Fed talk of tightening….none of this is new, and what is the market telling us? In spite of all this we are near an all time high, this little dip of the last 2 months is so small on a 10 year chart. What is it they say about a market that shakes off bad news, or the one that ignores good news?
It is also an interesting phenomenon to observes one’s emotional response to prices…only last august as the market made new all time highs at these current prices everything was great, now we have fear at prices that 6 months ago were records. Call it anchoring if you wish.
Well said. However, the character and environment are different. Interest rates are expected to rise, Long duration assets have significantly repriced(I don’t consider FB, GOOGL, MSFT etc. as long duration). Odds of Fed policy error are higher. They are learning as they go and will have five new Governors.
Additional fiscal support is likely limited.
Lot has changed!!
This is a reply to Yodoc2003 above.
Yes things are different, but what about the Fed Put. Maybe I am listening to the wrong people, but I hear a lot of “The market will drop because of rates and tightening, and eventually the Fed will cave and reverse”. Market is overpriced but until it is really “risk off” it can just keep going on. I am very nervous about things, but even though I worry about this being a top, I don’t really think it is yet. For such a super bubble I can’t believe it will go out with a whimper.
The sell-off this month is largely tied to rise of real IR. In three weeks it has gone up >2 sigma, apparently triggering a lot of algos into selling. Surprisingly many firms’ algos have about the same VaR parameters. Just herding. A small group of people front-running IR curves can trigger massive amount of selling.
Surely it does not help that the market is pricey and the leverage is high. Over the weekend crytos continue to drop. Now bitcoin has lost more than half of its market value, more than 600B. So from this perspective market might be even more vulnerable to selling. Bitcoin and tech names together can cause even more index drops, due to the unwinding of leverage.
I could be wrong. But just mentally be prepared. Everything is data-dependent, Powell style.
Even so, one dependable gentleman in the Elliot wave-fib analysis says 4,400 spx area is probably the bottom area of this 4th wave, but with significant whipsaw in 1Q22. So you have several opportunities to bottom-fish, just in tranches. And 5,500 is the target of this wave at end of this year or early next year. Obviously path-dependent. But we should open to all possibilities.
For me, just hunker down and go fishing.
Where you gonna go fish? That is my 2022 plan…go fishing. Covid permitting.
My usual spots are Santa Cruz, Half-Moon Bay, and Berkeley marina, although I have been to Sacramento delta. I usually drop off fishes to my friends’ places in these towns. Some of them are 60s/70s hippies, very interesting and smart people. I feel sad they are passing one by one over the last 10 years.
I live south of Long Beach, but my plan is fly fishing in small streams for trout….did that long ago as a kid…well, we’ll see
I believe some of the inflation we’ve been seeing since Q1 2021 were due to crypto (people actually taking out some of the profits to buy real world goods. For example, a neighbor semi-bragged about how his crypto trading profits paid for his bathroom reno in Oct.
Perhaps with the crypto market cut in half, some of the inflation pressure got evaporated as well for the remainder of 2022.
I believe a lot of traders who have been on the right side of this move closed their shorts last week. It seems we need to make up for the lack of volatility in 2021.
Red sky in the morning, sailors take warning.
For the stock market, we’re in the midst of a normal correction. For cryptocurrencies, it’s a little more than that.
I still believe it’s a better time to buy than it is to sell. In order to be effective, each shakeout needs to elicit real panic. We’re closing in on that point.
SPY will enter correction territory this morning.
No doubt in my mind that many traders have already capitulated in premarket session.
Adding to SPY here @ 430 and change – almost a reflex buy.
Calling the bottom of a market entails risk. There have been occasions that I have puked at the bottom saying I can’t take it anymore. Safer to trade with the trend – which is down.
Size of the trade matters when one is exposing oneself against the trend. Another is this:
https://therobusttrader.com/maximum-adverse-excursion/
anyone actually go long?
I’ve added to existing longs. I’m generally early, but I think we’re witnessing a great buying opp in real time. JMO, of course.
This is what panic looks like 🙂
I wrote an out of the money put….small putatoes…couldn’t resist….when you just stick a toe in the market to write a put
At some point, I may panic out as well. That’s also part of the game.
and the world goes crazy
Feels like with the news today about Ukraine there is some more downside, maybe until JayP soothes everyone mid week.
I think seeing these big declines in the winners of recent speculation (crypto, electric cars) is a positive. Good for the broader market to let some steam out of those IMO.
I agree. Crypto/meme stocks are two sectors where panic is warranted.
it makes sense that if sitting on a huge profit, that when things get shaky you take some gains. Gold is down a bit, bonds up, cryptos have been following the market…so where is safety? gold and bonds but not crypto? maybe with all the etfs on cryptos the market will influence cryptos more than in the past. So were they gunning the stops at the October lows?
My 70/30 take on Friday being the end of the current decline is now water under the bridge.
My 50/50 take on whether the current decline is a durable low is now a 60/40 take.
It may be difficult to appreciate at this moment, but today’s panic is a major, major plus in terms of setting a durable low. It’s a highly effective shakeout. When the market reverses to the upside, I’ll have more confidence in the rally (and be less inclined to sell early).
VT has filled a gap going back to April 1 of 2021.
Really brutal, but to the point where I’m embracing the selloff as the pause that refreshes.
SPY 420? I’m able to sound calm and collected about that number right now, but to be honest I’m not sure how I would have handled that in real time. My wife and I were in the midst of our annual exams when that number hit – and it may head even lower before the close.