The ominously named Hindenburg Omen was developed by Jim Miekka to spot major stock market tops. Unfortunately, it has also had a history of crying wolf too many times with false positives. Its inconsistency prompted one commentary to call it a warning to avoid traveling by blimp.
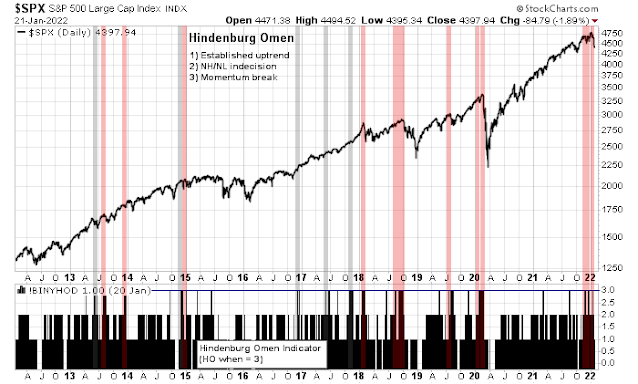
David Keller recently penned an article that analyzed the Hindenburg Omen in detail. He called it a breadth indicator with three specific components:
- The stock market has to be in an established uptrend;
- An expansion in both new 52-week highs and lows that indicate indecision; and
- The market exhibits a price momentum break.
Keller further explained, “A valid Hindenburg Omen signal needs to have multiple signals within a 30-day window to actually register a valid bearish indication.”
A chart of the Hindenburg Omen is shown below. The indicator is displayed in the lower panel and a valid signal has a value of 3. History shows that there were 11 such warnings in the last 10 years. Six saw declines (shown in pink). The market continued to advance or the Omen was too late in warning of declines in four instances (grey). One resolved in a sideways choppy market (grey/pink). While these results are marginally useful, this indicator’s sell signals don’t inspire a high level of confidence.
The Hindenburg Omen has recently flashed a series of sell signals. How should investors react?
A condition indicator
I conducted a more detailed analysis of the history of this indicator going back to the 1990’s and found that it spotted most major market declines ahead of time, such as the dot-com top in 1999 and 2000 and the market top in 2007 and subsequent Great Financial Crisis in 2008. The only one it missed was the Long-Term Capital Management Russia Crisis meltdown.
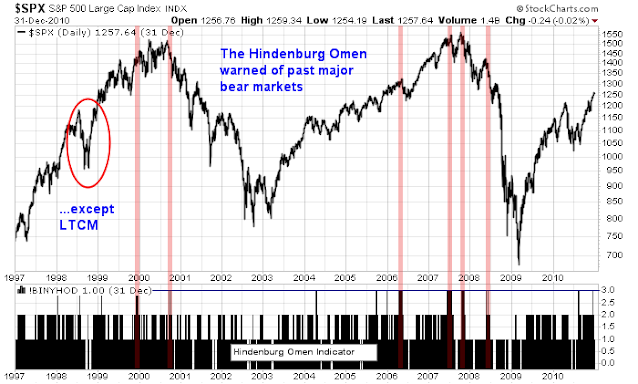
I conclude that this is an indicator with a spotty success record with a strong left return tail. Despite the record of false positives, it has warned of almost every major past bearish episode. I call this a condition indicator that is a signal of potential large downside risk but needs confirmation from other indicators for investors to turn cautious.
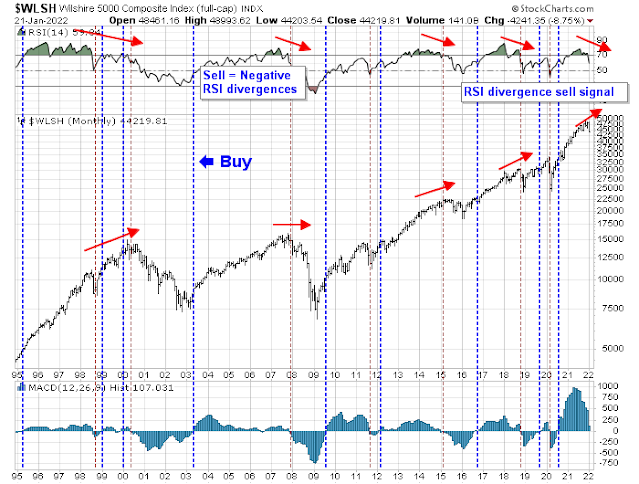
As a reminder, I recently pointed out that the Wilshire 5000 and its negative monthly RSI divergence flashed a sell signal. While the Wilshire 5000 sell signal can take anywhere from two months to over a year to resolve bearishly, the combination of these bearish warnings should raise the level of cautiousness for investors.
A Trend Model downgrade
In addition, my Trend Asset Allocation Model has been downgraded from bullish to neutral. As a reminder, the Trend Model is based on a composite of global stock and commodity markets. It has a history of out-of-sample signals since 2013. A model portfolio that varies 20% in weight from a 60/40 benchmark has shown a record of equity-like returns with balanced fund-like risk.
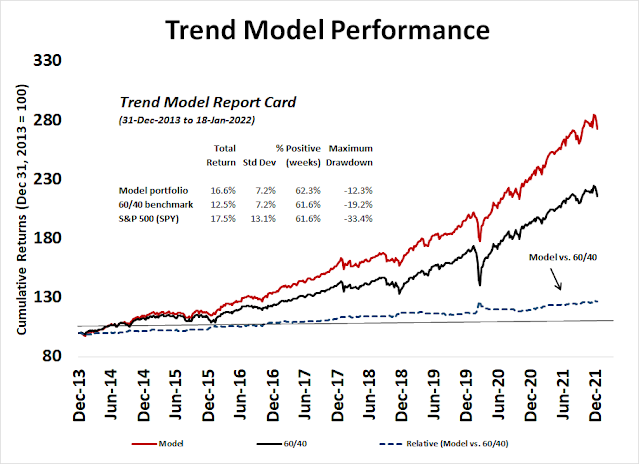
Investors should interpret the downgrade as a signal to de-risk from an aggressive to a neutral position. It is not the Apocalypse.
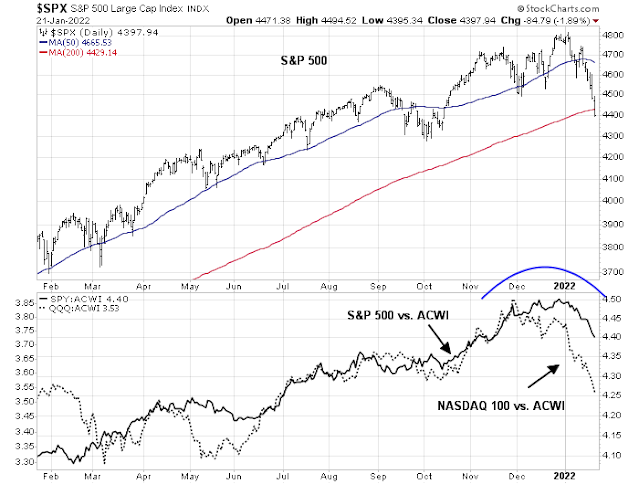
Let’s take a look. In the US, the S&P 500 has violated its 50-day moving average (dma) and testing its 200 dma. Both the S&P 500 and NASDAQ 100 have begun to lag global stocks, as measured by the MSCI All-Country World Index (ACWI).
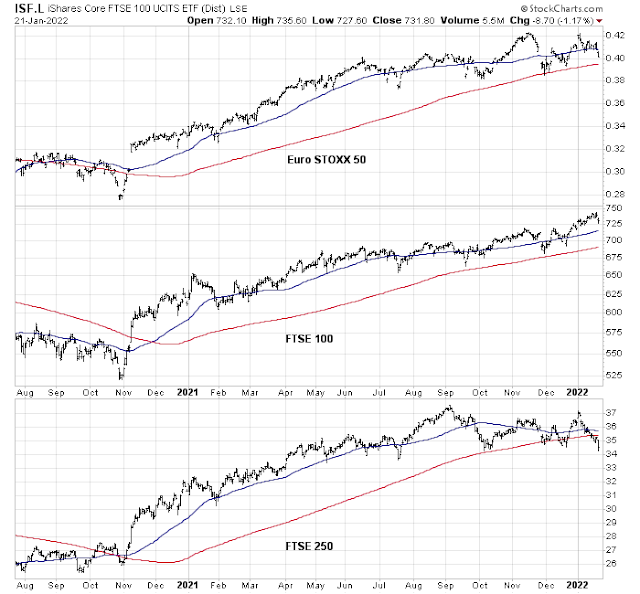
In Europe, the Euro STOXX 50 is struggling to hold its 50 dma. The FTSE 100 has held up well, mainly because of its heavier weighting in energy and financial stocks, which have outperformed. The mid-cap FTSE 250, which is more reflective of the British economy, has violated both the 50 and 200 dma.
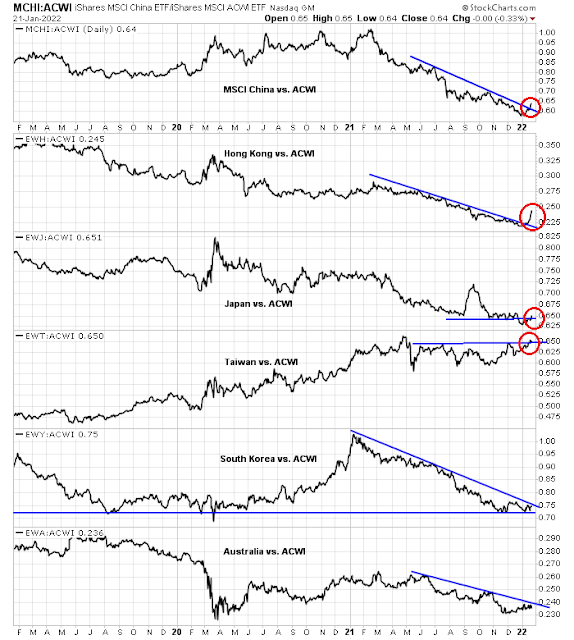
Asian markets, on the other hand, are showing signs of stabilization after a period of poor performance. Both China and Hong Kong have begun to turn up relative to ACWI. The PBoC has begun to ease, though it’s still an open question whether the change in policy will stimulate the Chinese economy or just stabilize the growth downturn from the property developer implosion. Monetary policy will not be able to address the growth challenges posed by China’s zero COVID policy of locking down areas whenever an infection is found. Other Asian markets are also exhibiting constructive signs of forming relative bottoms.
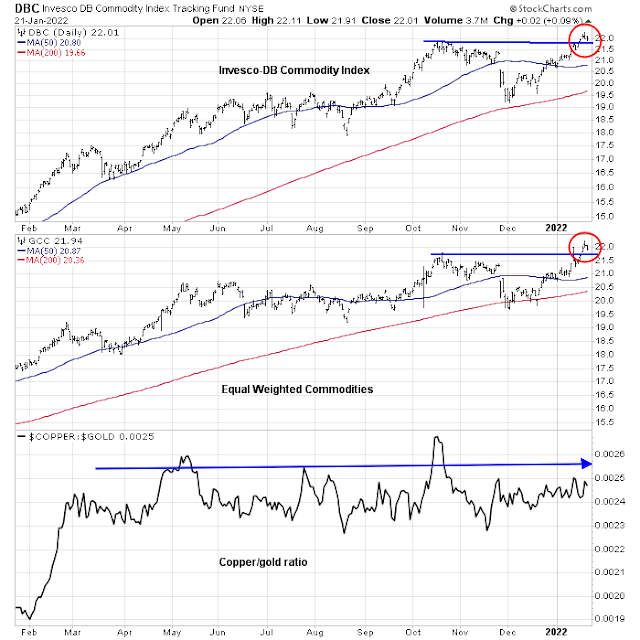
Commodity prices present a mixed picture. On one hand, they are strong and broke out to new recovery highs. On the other hand, the cyclically sensitive copper/gold ratio has been trading sideways for about a year, indicating neither strong economic strength nor weakness.
These readings support the Trend Asset Allocation Model’s shift to de-risk, but markets are not a complete disaster.
Cognitive dissonance
Two recent institutional investor surveys are highlighting a case of cognitive dissonance, the need for caution and the potential of a rush for the exits should risks materialize. The BoA Global Fund Manager Survey found that respondents were piling into value and cyclical sectors.
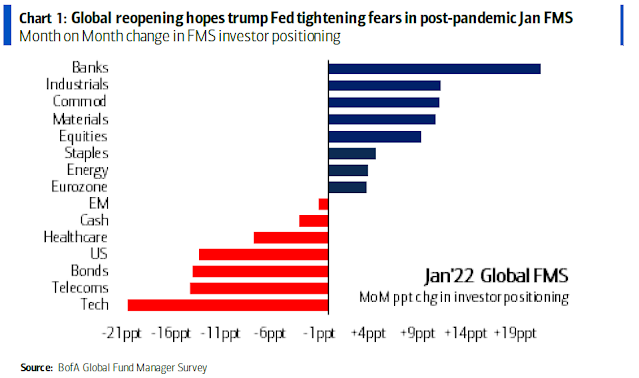
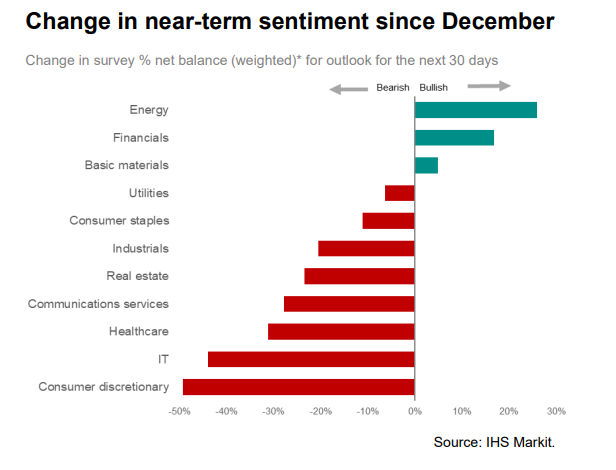
The IHS Markit Survey of Managers found a similar preference for cyclical exposure.
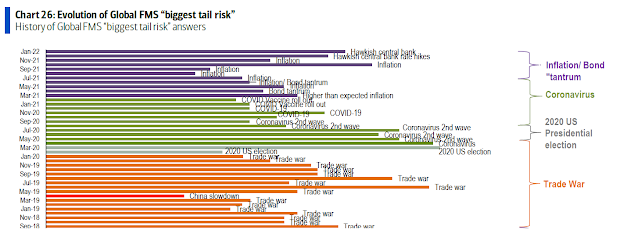
Here is where the cognitive dissonance comes in. The BoA Fund Manager Survey shows that the biggest tail-risk is a hawkish central bank. Why on earth would you stampede into cyclical stocks if you are worried about the Fed raising rates?
I pointed out before that equity investors face an elevated level of risk with value and cyclical stocks in the current environment (see Fade the value rebound). The market should gain greater clarity on this question after the January FOMC meeting next week. Notwithstanding the geopolitical risk of a Russia-Ukraine conflict, the FOMC meeting could represent an inflection point in risk appetite.
In conclusion, I am seeing signs of technical deterioration from a variety of sources, such as the Hindenburg Omen, a long-term Wilshire 5000 sell signal, and a Trend Asset Allocation Model downgrade. At a minimum, investment-oriented accounts should de-risk their portfolios and shift to a neutral equity weighting position consistent with their benchmark targets.
At first I was reminded of January 2014, but the loss of momentum in the Wilshire 5000 is much more severe than it was at the end of January 2014.
I am thinking about similarities with 2016. The same awfull January or 2018 Jan.
My move to ‘Winter’ investment season last weekend is playing out.
We are experiencing a rare factor phenomina, an Anti-Beta Crash.
As a student of Factors, let me share this Factor dynamic that is overlooked to where it is basically unknown nowadays. That is Anti-Beta. Long term (almost 100 years) French/Fama analysis show a long/short portfolio of long Low Beta stocks versus short High Beta ones, outperforms. The explanation is that like the tortoise and the hare fable, Low Beta stocks are the solid, unglamorous companies that do well as high beta exciting stocks rise big and then flame out. The Anti-Beta portfolio did well until the last decade when high beta tech and social media companies are beating low beta defensives and Value.
But every long while, High Beta gets so overdone that it crashes under its own weight of over valuation and bubble popularity. The Low Beta at those times is much more stable and therefore the Anti-Beta long short goes up is a big way.
Check out the chart of the Market Neutral Anti-Beta ETF BTAL, today it was the only green (showing up price) on my screen.
There was a big Anti-Beta Crash in the year 2000 and a smaller one in 2018 after the big runup in Tech in 2017.
The current bear market might confuse investors because there are no economic stressors now. Forward earnings are going up and high yield spreads are tame. But a bear market caused by a Beta-Crash does not need a recession. It’s reaction to an extremely positive investment environment that gets to bubble valuations and extremes of optimism.
A Anti-Beta Crash can lead to a decline in the whole market as it did after the year 2000 drop. The fourth quarter of 2018 had all sectors weak but that might have been due to the Fed tightening then.
The Anti-Beta Crash started in the ARKK-type stocks after mid-2021and is now infecting the S&P 500 quality growth stocks that got too high as well. The low beta Value areas might join in the bear market if Fed tightening and Omicron hurts the economy. That happened in the year 2001.
Anti-Beta Crashes can be short lived and intense. Watch BTAL ETF for signs it’s over. My guess is will be with us for 3-6 months.
Is your model expecting a bear market in US? Are your clients out of the market 100%? If so, when did they get out? Or, your model is negative on growth but favors value? A bit more clarity and transparency would be appreciated.
Cam’s model has become market neutral. He cautioned subscribers to start de risking a few weeks ago!! He posts the performance metrics for us to evaluate.
I can`t speak for Ken, but very few portfolio managers will go to an all-cash portfolio.
People recognize that they`re not right all of the time and make bets based on the risk that they are wrong. That`s why individual clients will have investment policy statements (IPS). A PM can vary a defined amount against the policy benchmark, e.g. +/- 20% against a 60/40. Exceeding those limits will yield a call from Compliance. The firm has to manage its liability risk that individual PMs are not engaged in inappropriate investments for clients with differing risk profiles.
Cam, I’m sure there are more than a few individual investors here who are just trying to maximize their returns. Some may have a large percentage of their assets in 401K.
They won’t mind going all-cash to protect their capital. They don’t have to respond to Compliance, or take career risk.
Not going to tell you what the appropriate amount of risk that you or any individual takes. However, fiduciaries have significant career risk if they’re wrong.
It’s like going for it when you have the ball on 4th down in football, or pulling your goalie for an extra attacker if you’re down a goal with a minute left in the game.
It depends on your pain threshold. How tolerant are you of being wrong? More importantly, if you go to cash, do you have a rule to get back in?
Here is another reason why the Trend Asset Allocation Model isn’t more defensive. Willie Delwiche wrote “on a global basis, nearly 60% of ACWI markets (35% of DM & 80% of EM) are still above their 50-day averages”.
https://twitter.com/WillieDelwiche/status/1484922494721171460
Unpleasant but not a complete disaster.
Winter Investment season IS the bear market. So not expecting a bear market, I’m saying we’ve started one when ‘Winter’ arrives.
For my Balanced Model, I was extremely high overweight in diversified equities (80%) from the November 2020 Vaccine Day to November 2021. I then started shifting from equities during the ‘Autumn’ investment season from the beginning of December as I’ve talked about in this blog as the season that warns of frosty days ahead. By year end, balanced clients were at 47% very short term fixed income or cash, 18% market neutral alternatives, 10% gold, and 5% Low Vol ETF. So just 20% in normal equities (yes, Value). Omicron and the Fed hawkish turn sent me faster than normal from Autumn to Winter preparations.
This defensive mix has completely avoided the YTD crashing markets.
That is tactical asset allocation (with a Factor influence) in action.
BTW none of this is an investment recommendation since I don’t know your financial needs or risk tolerance.
As per Cam’s post above about compliance oversight, my industry target weighting for balanced is 70:30. The industry is recognizing the new fixed income realities so no longer 60:40. I’m allowed to be a little offside so not problem with the 80:20 I carried for a year. The investment policy statement allows large deviations for a 90 day period for special circumstances which compliance oversees. They are more willing to approve actions that reduce risk, like I have done now. This 90 day window is what I am using to be currently very underweight weight equities.
“47% very short term fixed income or cash, 18% market neutral alternatives, 10% gold, and 5% Low Vol ETF. So just 20% in normal equities (yes, Value)”.
What are “market neutral alternatives”?
You have a 25% equity exposure?
20% equity exposure to Value stocks
A market neutral Alternative is a Long/Short vehicle that is net zero in stocks. So they are long 100% and short 100%. You hope the manager has the shorted stocks doing worse than her longs. The Anti-Beta ETF BTAL is an example. If both side do the same performance, the vehicle goes sideways regardless of how big the market plunge or rally.
These are hard to find because they do poorly when long only vehicles are having a bull market party. So managers close them down due to lack of interest just about the time (Autumn/Winter) when they start to outperform.
If anyone finds one, let me know.
You can artificially construct a long short yourself by matching a favorite holding in your portfolio with single short index ETF such as SH for S&P 500 versus a S&P 500 long equity or maybe a NASDAQ short ETF PSQ versus a NASDAQ stock. You get the idea.
BTW this is not a recommendation because I don’t know your situation.
We use CMNIX – Calamos Market Neutral Income Fund and CXGCX – Calamos Global Convertible in one of the portfolios.
Thanks for your insights. It seems that you are in investing Winter while Cam is in investing late summer using your metaphors.
Fidelity’s research talks about a transition to mid cycle expansion. JPMORGAN expects market to do well post hiccups in the first half.
One has to synthesize all the info into a strategy based on their goals and circumstances. Good Luck!
So, what happens at the end of 90 days window even if you see the Winter continuing? Will you be forced to change allocation even though it doesn’t match your investment conviction?
I try not to get too close to zero equities although I was at 5% in March of 2020.
In 2008 GFC Crash, I had a short index ETF against my longs to get to net zero exposure.
I don’t envision anything like that over the next few years since real interest rates will stay negative. Inflation-loving sectors could be a profitable play. I think a 1% rise in Fed funds is tiny and just appears scary. There can be some good rallies within a bear market especially if Omicron leads us out of a pandemic to endemic. The current Beta crash is simply absurd Growth Factor overvaluation getting wrung out.
Thank you, Ken. I appreciate your response and your insights you share with all of us here.
Well, it’s not Doomsday.
Cam’s Trend Asset Allocation Model is neutral – which is neither bullish nor bearish.
His Trading Model is bullish.
There is always the risk of a drawdown – perhaps elevated when bears have control of the tape, but also present in strong bull markets. In addition, bear markets are marked by violent countertrend rallies that eclipse in strength and speed the rallies seen in bull markets. Hence the real possibility of spectacular ST rallies in the near term.
“Long term (almost 100 years) French/Fama analysis show a long/short portfolio of long Low Beta stocks versus short High Beta ones, outperforms”.
Was Fama and French the first ones to come up with this idea?
Likely but not sure. There has been a lot of quant research afterwards. Like I say, the Anti-Beta strategy has not worked in the digital revolution era so it has been forgotten.
The Low Beta boring companies were disrupted by High Beta continual winners and started going out of business. This flipped the Anti-Beta from a winner to a loser.
Right now it could be a temporary winner as the absurdities of Growth Factor overvaluation get wrung out. After the Beta Crash, we will see Growth companies disrupting Value again.
I better understand Ken’s thesis and positioning juxtaposed to Cam’s outlook. Appreciate the clarity and rationale.
I am one of the three PMs managing and overseeing our family portfolio. I find it extremely useful to get a variety of inputs from various research firms. Cam stands tall amongst them. I formulate our approach both tactically and strategically.
One of the challenges is to stay focused during turbulent times such as we are facing now.
I sincerely wish each one a smooth ride towards their goal.