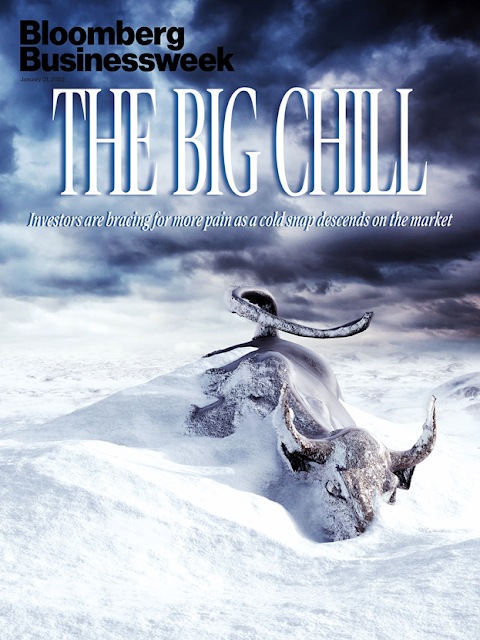
Mid-week market update: The stock market has been extremely oversold for the past few days, but one element had been missing for the short-term, namely a sentiment capitulation and wash-out, which may have finally appeared. The latest Business Week cover may be the classic contrarian magazine cover indicator of a developing bottom.
Oversold signals everywhere
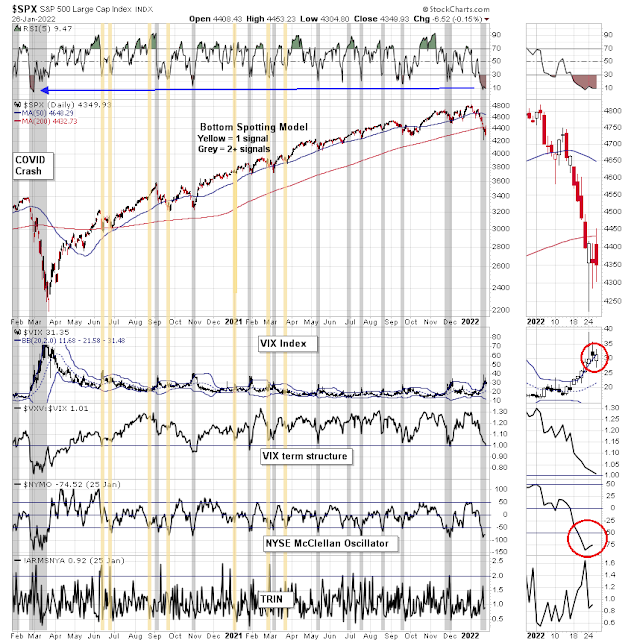
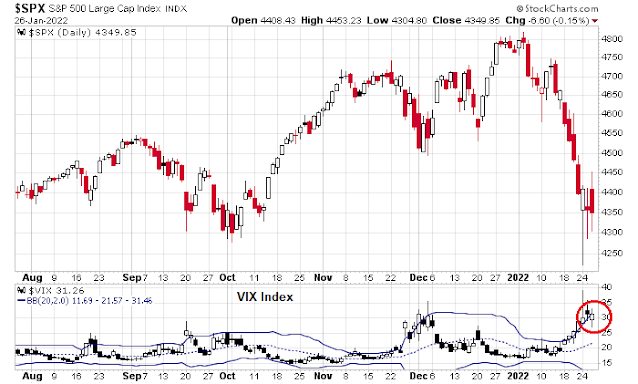
As well, I am seeing oversold signals everywhere. Two of my four bottom spotting models have flashed buy signals. The VIX Index has spiked above its upper Bollinger Band and the NYSE McClellan Oscillator (NYMO) reached an oversold extreme. While the term structure of the VIX did not invert on a closing basis, they did invert intra-day both on Monday and Tuesday. Moreover, the 5-day RSI of the S&P 500 reached oversold levels last seen during the COVID Crash of 2020.
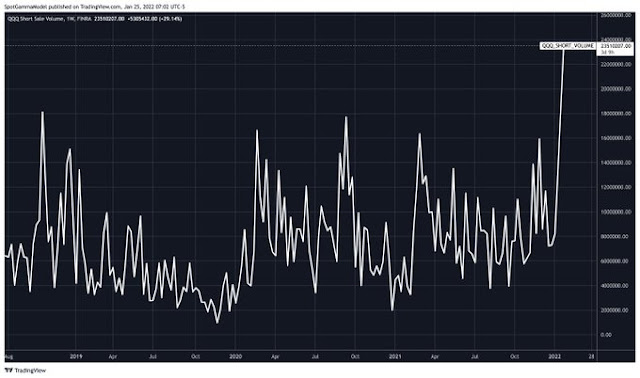
The NASDAQ 100 is especially washed out. QQQ short volume has spiked to unprecedented levels.
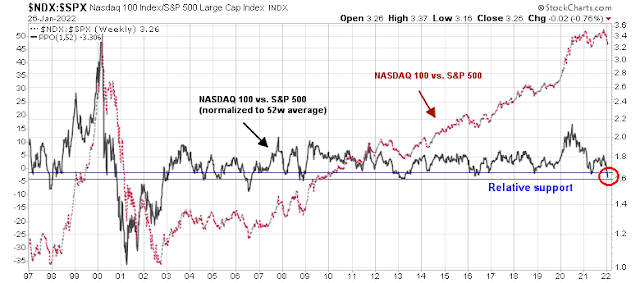
The normalized 52-week NDX/SPX ratio has fallen into a relative support zone that has historically defined buying opportunities for large-cap growth stocks with the exception of the 2000 dot-com crash.
Risk appetite is poised for a comeback, though the longevity of any relief rally remains an open question.
Main Street, or Wall Street?
Coming into the FOMC meeting, the Fed was caught between the desires of Main Street, which has been increasingly concerned with inflation, and Wall Street, which was hoping for a more dovish message. The Fed threw its lot with Main Street as Jerome Powell stated that “inflation risks are to the upside in my view” and the Fed’s balance sheet is “substantially larger than it needs to be”.
Inflation concerns were so widespread on Main Street that it became a major issue on Glassdoor, a website built mainly for employees and potential employees to rate employers. Most of the concerns amount to “my pay raise isn’t keeping up with inflation”.
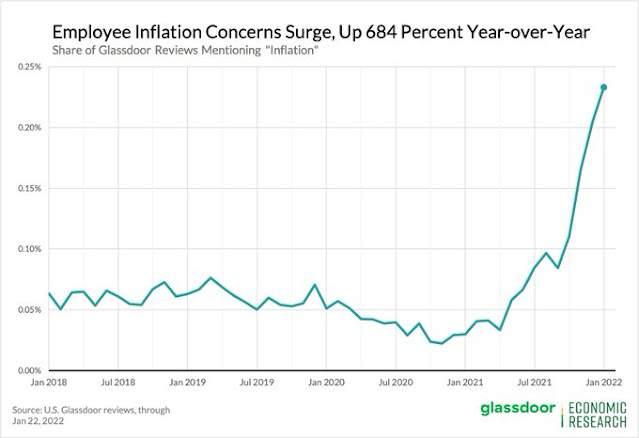
The cacophony of inflation complaints prompted President Biden to pressure the Federal Reserve to “do something” in order to bolster the Democrats’ faltering position in the mid-term elections. While the Fed has its own reasons to tighten monetary policy, the combination of broadening inflation pressures and emerging signs of full employment prompted its hawkish pivot.
Despite Powell’s equity unfriendly message, the stock market reacted in a constructive fashion by holding above Monday’s panic lows and the VIX recycled below its upper BB.
In conclusion, stock prices are overly stretched on the downside and a relief rally is more or less inevitable, though its longevity is questionable. While my inner trader remains tactically bullish, he is monitoring the evolution of internals should the bounce materialize. My inner investor has de-risked from an aggressive position to an asset allocation that is consistent with his long-term policy mix.
Disclosure: Long SPXL
Cam- Are you able to add more color to your closing statement ‘My inner investor has de-risked from an aggressive position to an asset allocation that is consistent with his long-term policy mix.’
My investment oriented account went from overweight equities to neutral.
Well we are not at euphoria. Was that when the Reddit crowd was pushing things around, or is it still to come?
We haven’t had the Covid is over news yet.
Cam, do you think that technology is similarly poised for a relief rally?
High quality technology with strong competitive positions and positive cash flows, yes. Speculative tech losing money, yes, but don’t expect their strength to last.
Thanks, Cam.
I keep reading headlines about recession or stagflation.
Maybe times have changed, but to my mind there is plenty of negative out there and yet the market is hanging in there. My scenario for a top is Covid clears out, market goes higher on anticipation of things returning to normal and then we get the euphoria of the unstoppable bull, or did I miss that part? Maybe me gawking at the GME, AMC insanity was the euphoria phase. Margin debt goes up until the top, it recently dipped but was higher than last year when we had the reddit crowd, so this would argue that the top is not in yet
We are at a resist line from the last 2 weeks prices, if we break that, then there is a good chance to move to around 4600…after that I have no idea…5400 is possible if we make a new high, but we could still be having a sharp rally on the way south. 5400 sounds insane doesn’t it?
We have a potential triangle on the 1 minute chart lol…anyone want a cup of noise with their coffee? but so far beauty of a contracting triangle with vols dropping …only they usually do at this time of day….so do we get a breakout with a thrust upward which the Elliott guys would say “see”, or something else? nice thing about 1 minute charts is you don’t wait forever
aaaaaand…nope…just noise
Buying back into the markets here.
The last 2 times we had this kind of mess, in oct and late nov/early dec, when the market finally broke through the resist line , it did well. With this kind of prices, when it eventually resolves, we should see a strong move…up or down, that’s the ?
You can cut the negativity with a knife right now. So it may not end up being the best possible buy point – but it’s a decent buy point. JMO.
The market’s aim is to cause the maximum pain to buy the dippers.
And… Today, I would figure what was good news, GDP print, still caused market to go down. At this point we are in the market where Good news is being discounted.
So, two other big hangups left, Russia or Omicron.
$AAPL crushes it
It seems to me that the most significant factor in the stock market increase the last 20 months has been stimulus by the Fed. Record amount of stimulus over the last 20 months at roughly $5.5 T vs during the GFC of roughly $1.5 T (https://www.reuters.com/markets/us/fed-signals-readiness-shrink-balance-sheet-why-thats-big-deal-2022-01-06/) the best I can tell. I am just trying to figure this all out honestly. And we have had a stock market boom since March 2020 that corresponds with the stimulus. And since Fed stimulus is a very significant factor in stock prices (don’t fight the Fed) it seems like we should see more than an 11% decline in S&P500 since there was more than a 100% gain in stocks since Mar 2020 low and based on the record stimulus being reduced by a reduction in QE, Fed assets expiring and increase in interest rates. This all sounds very equity negative. I am just thinking this through. But Cam’s Trend model is only at neutral with equities (as best I can tell 60/40 vs coming down from 80/20 which is bullish). So, Cam with all of these negative things happening in the market and trend model is neutral what is it that would cause the trend model to go bearish or 40/60? Thanks.
No two scenarios are identical, but the failure of every rally over the past 9-10 days reminds me of March 2009 – a condensed/compressed version if you will.
I went to bed on March 9 convinced we were headed even lower, ended the day in cash, and told myself it would probably be a while before I traded again. I slept well. When I awoke on March 10 – well before booting up the PC to check futures – I had the sense that the bear was over. I had completely thrown in the towel, and the right move the night before was to go all-in. I immediately got out bed and placed orders for QLD. The market didn’t look back for weeks.
Not saying at all that’s going to happen tomorrow – just that the negativity I sensed during today’s session was reminiscent of March 9.
I flattened my position this afternoon. Was long the last few days, but with the market being sold on every rally attempt, I can’t hold long until I see some sort sign of strength.
Good luck all.
I may end up regretting it, but I breached our 20% rule for bear markets this morning and added to long positions opened yesterday.
Personally, I find it helpful to experience the emotions of investors with skin in the game in real time.
Closing the add’l positions opened earlier this morning.
SPY is back at that resist line, does it break through or do we dip again?
I don’t think anyone trusts this rally. But that’s a plus!
Honestly, I have to think that anyone who had the slightest inclination to sell – did so this week. Hopefully that clears the way for some continued upside before we see a new set of sellers (those holding out for higher prices).
I wonder if this is putting to rest some concerns about the Fed raising the Fed Fund rates and potential QT. I know it’s early in the quarter but still. I think JPow may have to do another 180.
https://www.atlantafed.org/cqer/research/gdpnow
Latest estimate: 0.1 percent — January 28, 2022
The initial GDPNow model estimate for real GDP growth (seasonally adjusted annual rate) in the first quarter of 2022 is 0.1 percent on January 28.
Normally I would be looking for a retest.
However, it feels as if we’ve already had 4 or 5 of them this week! The worst shakedown probably occurred last night in the futures market. So I’m not looking for a retest next week.
The weekly action (extreme volatility) with bearish sentiment off the charts, along with the action in last few hours of trading Friday feels and looks like a short term bottom has been established. 4th Q Earnings are coming in strong and rising estimates could support a recovery rally that will test a number of resistance points in the major indices over this first half of February. Like Cam I feel this still deserves only a short term vote of confidence but looks like a tradable rally is setting up. Happy trading next week!