The Chinese authorities were stuck between a rock and a hard place. On one hand, COVID caseloads were skyrocketing; on the other hand, after two years of a series of on-again-off-again of lockdowns, it was unsurprising that Chinese citizens, many of them young, got a case of cabin fever and protested the government’s COVID policies in a series of nationwide demonstrations. A
podcast from the Economist argued that the combination of strict lockdowns and ubiquitous government monitoring led to widespread dissatisfaction.
Two incidents were believed to be the final straws that were the catalysts for the unrest. The first was an apartment fire in the city of Urumqi in western Xinjiang, where 10 people died, in which fire exits were locked because of COVID restrictions that trapped occupants inside, and COVID barriers prevented firefighters from reaching the building. In addition, broadcasts of the World Cup showed numerous unmasked spectators in the stands, which ran counter to the government’s narrative that China was controlling the pandemic much better than the West.
Protests are relatively common in China, but it’s rare to see them erupt spontaneously and in different cities. While the authorities appear to have the protests under control, it could be argued that broadcasts of the World Cup were a spark that almost unraveled China.
The evolution of China’s COVID policies
About a year ago, a patient in Wuhan was diagnosed with an affliction known as a novel coronavirus. The outbreak spread and medical staff and researchers didn’t really know how to react. There was no known cure. The only treatment at the time was isolation and, if necessary, intubation. The fatality rates were horrendous. As the pandemic spread out of China, the West was overwhelmed. Who could forget the devastation in northern Italy, which was the richest and most industrialized part of the country, and when it first cases landed in America in Washington State? China reacted by putting the entire country into quarantine and voluntarily shutting down its economy. The measures worked, and they allowed China to return to some semblance of normality.
Fast forward to 2022, vaccines are widely available and served to control the effects of the pandemic. However, Chinese vaccines are less effective than the mRNA vaccines in the West and vaccination rates are low among the vulnerable elderly. The authorities reacted with the same-old draconian tactic of lockdown and quarantine to control the pandemic. Despite these steps, caseloads are skyrocketing.
As a consequence of the lockdowns and restrictions, dissatisfaction bubbled up and protests appeared. While protests are not unusual in China, the grievances were usually localized, such as peasants objecting to having their land taken away by corrupt officials or protests over environmental issues. These protests are unusual inasmuch as they are nationwide and in objection to a specific Xi Jinping policy initiative. At the extreme, the dissent became overtly political and some even called for Xi Jinping to step down or for the CCP to cede power.
The economic fallout
Moreover, the economic effects are worsening. China’s PMI came in below expectations and in contraction territory.
Lockdowns are intensifying and they cover nearly 60% of GDP.
Bloomberg reported that the virus is rapidly spreading and affecting production, with over half of firms reporting a case among their employees this month.
About 53% of companies surveyed by China Beige Book said they’d had a case in their workforce this month. That was more than double the 24% who reported a case in October and the highest level in data back through January last year, according to the report.
It is no surprise that household confidence skidded badly.
The low level of household confidence has exposed the fault lines in the all-important real estate market and cratered the finances of the over-leveraged property development companies.
The policy response
In response to the protests, which are reportedly ongoing, the authorities have opted for a three-pronged approach.
- Adopt a more conciliatory tone;
- Reinforced the police presence on the streets; and
- Use the State’s ubiquitous monitoring apparatus to discourage individual dissidents.
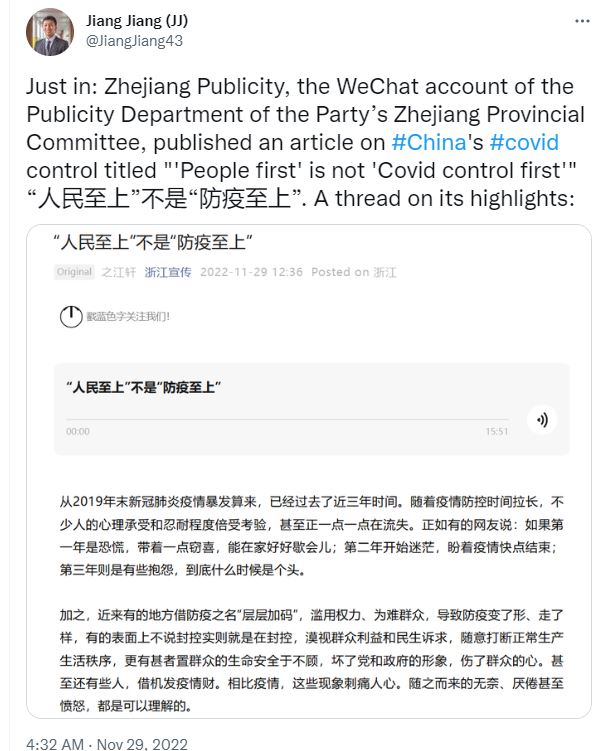
Jiang Jiang, a reporter at China’s official media Xinhua, recently recounted an official article, “‘People first’ is not ‘Covid control first'”. While the title sounds conciliatory, it explains the dilemmas that the authorities face in addressing the protesters’ grievances.
Here are some key excerpts. The initial tone is conciliatory.
Epidemic prevention and control is to prevent the virus, not to prevent people; there is no such thing as “epidemic prevention first” but “people first”. No matter what kind of prevention and control measures are taken, they should be aimed at returning society to normal ASAP and getting life back on track as soon as possible. All options are “bridges” and “boats” to this goal, not simply to restrict people, regardless of the cost of blind brute force.
But later the account addressed the issue of the unmasked spectators at the World Cup and outlined the tradeoffs.
During this period, the World Cup in Qatar is in full swing. The crowd in audience didn’t wear masks, look at the scene of the revelry, everything seems to be no different from before the epidemic. Some people ask: “Many countries in the world now have everything as usual.
Up to now, there are 636 million new confirmed cases and over 6.6 million cumulative deaths worldwide, with 230,000 new confirmed cases and 428 deaths in a recent day. Among them, Japan, which has 126 million people, sees 98,000 new confirmed cases per day; South Korea has a population of more than 50 million people. It sees 47,000 new confirmed cases per day.
Simply put, China doesn’t have the medical capacity to open up
Regarding medical resources, this year China has 6.7 medical beds per 1,000 population, compared with 12.65 in South Korea, 12.63 in Japan and 7.82 in Germany in 2020. In 2020, China has 4.5 ICU beds per 100,000 people, Germany 28.2, the U.S. 21.6, France 16.4 and Japan 13.8, a global average of 10. Earlier this year, covid critically ill patients occupied 32.7% of the total ICU capacity in the U.S., and about 7 ICU beds per 100,000 people were crowded by covid critically ill patients, the number of which has exceeded the total number of ICU beds per 100,000 people in China. As of the end of 2021, China’s population aged 60 & above reached 267 million, & the population of children exceeded 250 million, so the size of “the elderly and the children” group is huge.
Opening up would be a medical disaster for China.
According to the latest data from Singapore, the mortality rate of infection among the elderly aged 60-69, 70-79 and 80 years old and above with vaccine protection is 0.014%, 0.064% and 0.54% respectively; the mortality rate of infection among the elderly in the three age groups without vaccine protection is 0.19%, 0.29% and 2.5% respectively. And the three age groups of elderly people who have not completed vaccination in China are about 22.64 million, 16.16 million and 14 million respectively.If we completely lift all the restrictions now, according to the estimated mortality rate of infection in Singapore, the number of deaths in our country will reach about 600,000 for the elderly over 60 years old only.
In support of the 600,000 fatality projection, a separate analysis from
The Economist concluded that a disorderly reopening could lead to 680,000 deaths.
The Economist has modelled the likely progress of China’s current outbreak. If it is allowed to proceed unchecked, even assuming all patients who need intensive care receive it (which they would not), some 680,000 people are likely to die.
Jiang Jiang concluded with some comments of his own [emphasis added]:
The piece focused on the expression of empathy with the public under epidemic prevention & control (which might explain why it enjoys some popularity now), explained the logic behind the current “Dynamic Zero-Covid” policy and listed many wrong actions of the local governments in implementing the policy. No signal can be seen from the article that China will change the overall policy soon, though the article mentioned the “iteration” and “optimization” of the policies. To me, it is a message to the public that the central government is aware of the various problems including “some interest groups 利益群体” behind the epidemic (though it was published by a local account), but it is not realistic to change the policy entirely now due to the reasons I highlighted in the last thread/
Despite the conciliatory tone from the authorities, no full de facto opening up is in the cards in China this winter. However, there may be some localized semi-loosening. Local authorities are allowing positive cases and close contacts to quarantine at home under certain conditions. As well, China is expected to reduce the frequency of mass testing and regular PCR tests, But any full exit from China’s zero-COVID policies will be a long process and dependent on how it manages increases in case counts, which are skyrocketing right now.
Investment implications
How should investors think about the current protests in China? How risk appetite reacts to events such as the unrest in China depends on how they are perceived. Will it be viewed as political instability, financial or economic instability, or will be shrugged off as business as usual? While history doesn’t repeat itself but rhymes, here are some historical templates to consider.
The widespread nature of the unrest is reminiscent of the Tiananmen Crisis of 1989, though the level of dissent does not appear to be as deep as it was then. Chinese markets were highly immature at that time, and even Deng Xiaopeng’s Southern Tour, in which he pivoted to a more capitalistic friendly policy, would not occur until three years later in 1992. One of Xi Jinping’s first policy speeches as a new leader 10 years ago was about how the Soviet Union betrayed a fatal weakness in dealing with perestroika in the 1985-91 era. The current protests are a direct challenge to Xi and cannot be allowed to succeed. If other methods fail, watch for harsh means of repression. However, I believe a Tiananmen-style crackdown is unlikely. The more recent Hong Kong protests, which were far more serious and conducted without much censorship, were slowly smoldered by the authorities. Today, China’s surveillance state and its use of technology have become far more developed.
In 1989, Hong Kong’s Hang Seng Index, which was the best proxy for China, skidded -27.0% in the two months ending in June and recovered strongly for the rest of the year. By contrast, other major market indices hardly reacted at all to the political turmoil in China. In the spirit of the adage “buy to the sound of cannons, sell to the sound of trumpets”, 1989 was an illustration that political instability fears are generally good buying opportunities.
By contrast, an example of the financial and political instability scenario can be seen during the COVID Crash of 2020. The COVID-19 pandemic spread unchecked around the world. Had it not for the quick response of global fiscal and monetary authorities, the global economy could have collapsed into another Great Depression. Global equities were far more correlated than they were in 1989.
The combination of the Chinese authorities’ more conciliatory tone and harsh police measures may have served to keep a lid on the dissent. The markets took a risk-on tone in the hopes of the relaxation of zero-COVID measures, which may be fleeting. MSCI China has staged an upside relative breakout from a falling trend line, and so have a number of stock markets of China’s key Asian trading partners. From a technical perspective, China and China-sensitive markets may need some time to trade sideways and consolidate their relative gains.
Investors are faced with the dilemma of missing out on the end of the zero-COVID bandwagon FOMO rally, while managing the reality that zero-COVID will not end immediately, nor are there any signs of a recovery in the Chinese economy. As well, they should be prepared for more near-term volatility, but keep in mind the outcomes from the 1989 and 2020 tail-risk scenarios.