Preface: Explaining our market timing models
We maintain several market timing models, each with differing time horizons. The “
Ultimate Market Timing Model” is a long-term market timing model based on the research outlined in our post,
Building the ultimate market timing model. This model tends to generate only a handful of signals each decade.
The
Trend Asset Allocation Model is an asset allocation model that applies trend following principles based on the inputs of global stock and commodity prices. This model has a shorter time horizon and tends to turn over about 4-6 times a year. The performance and full details of a model portfolio based on the out-of-sample signals of the Trend Model can be found
here.
My inner trader uses a
trading model, which is a blend of price momentum (is the Trend Model becoming more bullish, or bearish?) and overbought/oversold extremes (don’t buy if the trend is overbought, and vice versa). Subscribers receive real-time alerts of model changes, and a hypothetical trading record of the email alerts is updated weekly
here. The hypothetical trading record of the trading model of the real-time alerts that began in March 2016 is shown below.
The latest signals of each model are as follows:
- Ultimate market timing model: Sell equities
- Trend Model signal: Bearish
- Trading model: Bullish
Update schedule: I generally update model readings on my site on weekends and tweet mid-week observations at @humblestudent. Subscribers receive real-time alerts of trading model changes, and a hypothetical trading record of those email alerts is shown here.
Subscribers can access the latest signal in real-time here.
A bullish turnaround
The S&P 500 turned up last week after a test of the May lows while exhibiting a 5-day RSI divergence. The rally was convincing as the index rallied through a falling trend line and the daily MACD indicator turned positive.
One of the most anticipated relief rallies is here. How far can the stock market run?
Buy signals everywhere
Last week’s market action sparked buy signals everywhere. NYSE breadth on Wednesday was an 83% volume upside day, Thursday was an 87% upside day, and Friday was another 87% upside day. Two consecutive 80% upside days are unusual. Three consecutive ones are extremely rare. A study by
Paul Desmond of Lowry’s Reports found that back-to-back 80% upside days were breadth thrust signals indicating “the completion of the major reversal pattern[s]”.
On occasion, back-to-back 80% Upside Days (such as August 1 and August 2, 1996) have occurred instead of a single 90% Upside Day to signal the completion of the major reversal pattern. Back-to-back 80% Upside Days are relatively rare except for these reversals from a major market low.
The historical record shows that while three consecutive 80% upside days tended to be bullish, there were exceptions. Stock prices topped out after such a signal in 1981 and fell to a lower low in 2008. In other case, the market consolidated sideways.
Nevertheless, price momentum has become very strong. The NYSE McClellan Oscillator has reached levels consistent with a “good overbought” advance, indicating further upside potential.
Credit market risk appetite is also starting to show some life. The relative performances of high yield and leveraged loans relative to their duration-equivalent Treasury prices are exhibiting some minor positive divergences from the S&P 500.
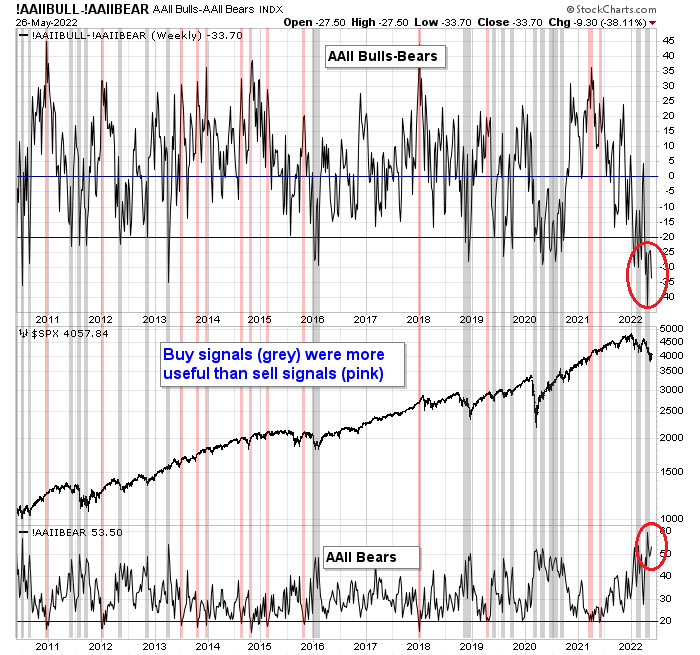
AAII weekly sentiment is still excessively bearish, which is contrarian bullish.
Sentiment models are supportive of further gains. Last week, we saw bear claws on the cover of Barron’s. This week, Bloomberg BusinessWeek’s cover is another contrarian magazine cover indicator that’s supportive of the bull case.
From a global perspective, the percentage of countries above their 50 dma rose from zero the previous week to 10% last week, indicating a recycle off an oversold extreme.
The performance of MSCI Poland is turning up, which is a sign that geopolitical risk is fading.
When should traders sell?
What’s the upside potential of this rally? The most straightforward way of estimating upside potential is to find potential areas of resistance. Arguably, the S&P 500 is already testing a resistance zone. Further resistance can be found at the first Fibonacci retracement level of about 4185, with secondary resistance at the 50 dma at about 4280, which also roughly corresponds to the area at the falling trend line..
Another way of estimating upside potential is to monitor the evolution of trading signals. The NAAIM Exposure Index, which measures the sentiment of RIAs, flashed two consecutive buy signals by falling below its 26-week Bollinger Band. This indicator has been excellent at calling short-term bottoms. Upside momentum often fades when NAAIM rises to its 26-week moving average.
Also, keep an eye on the VIX. Trading tops often form when the VIX Index falls below its Bollinger Band.
Intermediate-term bearish
Despite last week’s show of strength by the bulls, my base case scenario calls for a bear market rally within a bear trend. The relative performances of defensive sectors are still in uptrends, indicating that the bears still have control of the tape.
Enjoy the rally, but don’t overstay the party.
Disclosure: Long SPXL


A Zweig breadth thrust appears to be baked in.
Secondly, and cautiously, my private research suggests that recent market weakness will need to be cancelled by strength, with the implication that a sharp reversal may not be a risk.
The ZBT buy signal just missed. The market had 10 trading days to rebound from an oversold to overbought condition. It achieved that in 11 days.
It would be interesting to know if any studies have been done on ‘near misses’ in the ZBT. It’s similar to an index selling off by -19.9% and avoiding a ‘bear market.’ In terms of being an accurate reflection of human behavior, being off by one day doesn’t seem to be a black-or-white type of thing – heck, it may even turn out to be a more bullish indicator.
Cam,
Do you have more data on three consecutive 80% upside days? You stated that they are bullish but there are exceptions. You didn’t specify how often those exceptions played out. Overall, it sounds a very bullish statement to me.
Walter Deemer and Norseman posit a lot of analysis on Lowry’s Reports.
https://twitter.com/WalterDeemer/status/1530947345562714114
See the above chart for a graphical understanding of the exceptions.
I’d also say that it is not just EPOL, most European markets (VGK, EWP, EWG, etc.) have turned up over the last 2-3 weeks. So, either they may all be anticipating some relief on the war front, or it could be another EU-wide event/policy that’s affecting them all.
EPOL is the one probably most sensitive to Russia-Ukraine geopolitical risk.
30-year bond futures selling off hard.
SPX futures ~+0.4%,
The up volume thrust is not just a single event and even Walter Deemer will tell you this, the 2 or 3 day 80% upside just tells a good story and offer some assurance. If you could study the microstructure of up volume days and weeks in the SPX for example, you will see something like this, example showing the complicated 2008-2009 bottom, where the initial support gave way in February 2008 and each level of support and resistance was tested multiple times where the larger arrows signified thrust like events, up or down.
https://ibi.sandisk.com/public/092d86e5-077f-4966-979a-df075546a1f8/file
Well, the market really doesn’t like to trade $SPX in the range of 4100 to 4150 and there is the VWAP from 05/26/22 that could be back filled at 4045. Both the up volume study and the CBOE Equity Put/Call Ratio ($CPCE) are showing a short term sell on the daily with the $CPCE showing sell only in the last few hours. The weekly chart is still intact though and this weakness could recover in a few days, but in the recent past the $CPCE sell signal on the daily lasted more than a week on average.
The Spearman’s rank correlation of $SPX as well as $CPCE remained a good way to spot the turning points at least in some time frames such as this 30 minute chart:
https://ibi.sandisk.com/action/share/9aa66dce-a7a0-44c0-b182-615ada3ac532
This rapid loss in up volume thrust has proved to be good short signals for 2 weeks or more, ever since 11/10/2021. We saw these signals at the end of day on 5/31/22 and today June 1, 2022.
https://ibi.sandisk.com/action/share/e02998b8-8b48-415a-9a2e-216c4dc56f4f
I can understand why the average investor is concerned about their 401(k).
The Nasdaq is back to August 2020 levels. The SPX is doing better, but based on a traditional 60/40 asset allocation they would likely be underwater compared to August 2020 due to the massive crash in bonds.
TLT indicated -1.9% lower.
Finally hit one out of the park. By simply cashing out last Friday.
Wading back into a couple of positions here-> SPY/ VT.
Taking profits here.
Scaling back into SPY here – I plan to hold the position overnight.
Adding to SPY here.
And one last allocation here.