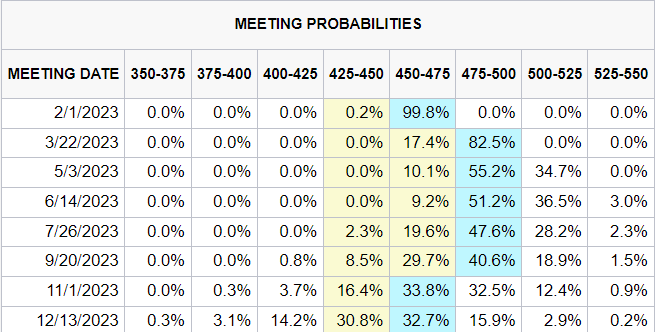
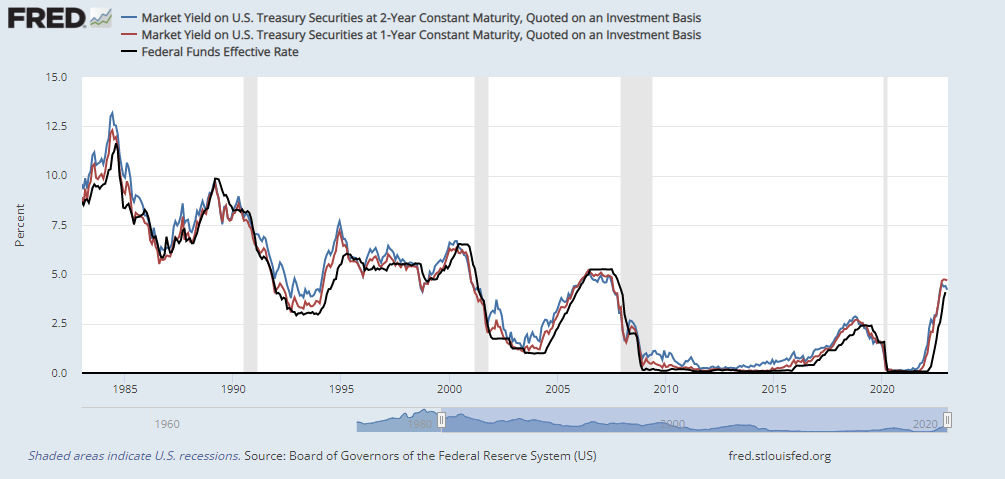
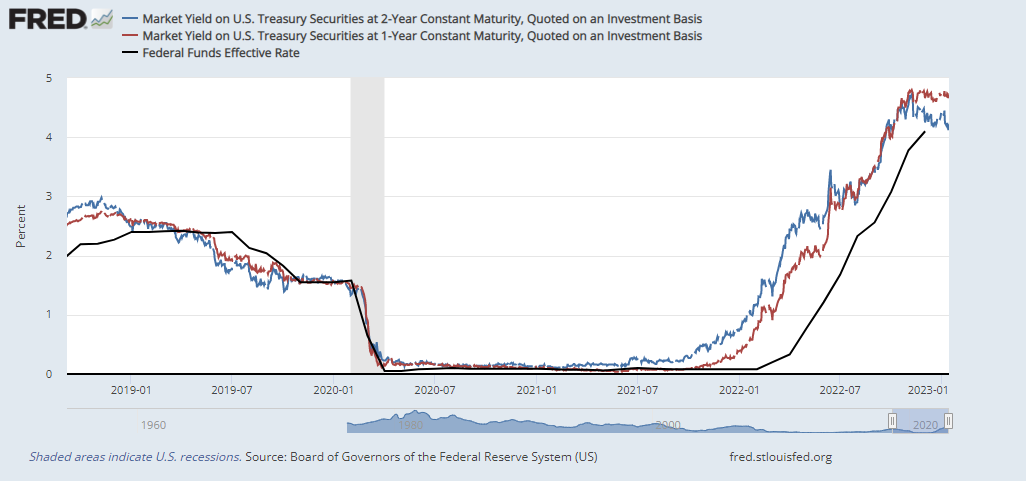
As investors look ahead to the FOMC decision on February 1, the market is expecting two consecutive quarter-point rate hikes, followed by a plateau, and a rate cut in late 2023.
The rate hike path and subsequent pause are consistent with the Fed’s communication policy. Already, the Bank of Canada raised rates by a quarter-point last week and signaled a conditional pause in order to assess the lagged effects of past rate hikes. Expectations of falling rates later this year are contrary to the Fed’s forward guidance. I am struck by a key sentence from the
December FOMC minutes: “No participants anticipated that it would be appropriate to begin reducing the federal funds rate target in 2023,”
While there will be no dot plot published at the conclusion of the February FOMC meeting, the Fed’s intentions can’t be any clearer. There will be no cuts this year. In that case, what are the circumstances that could alter the Fed Funds trajectory?
The case for an extended pause
There are good reasons for an extended pause. Former Fed economist Claudia Sahm (of Sahm Rule fame), a dove who has advocated that the Fed shouldn’t deliberately tank employment to fight inflation, confirmed the no-cut view of monetary policy with her
publication, “A boring Fed is the new Fed”.
After two years of an exciting Fed—in 2021, holding rates at zero even as inflation shot up and then in 2022 rapidly raising interest rates to catch up—we are back to boring. For this year, the Fed has charted a more standard course: 1/4-point fed funds rate increases for a while and then holds steady the rest of the year. The Fed’s done a lot. It will be patient, watch the data, and be reluctant to declare victory on inflation.
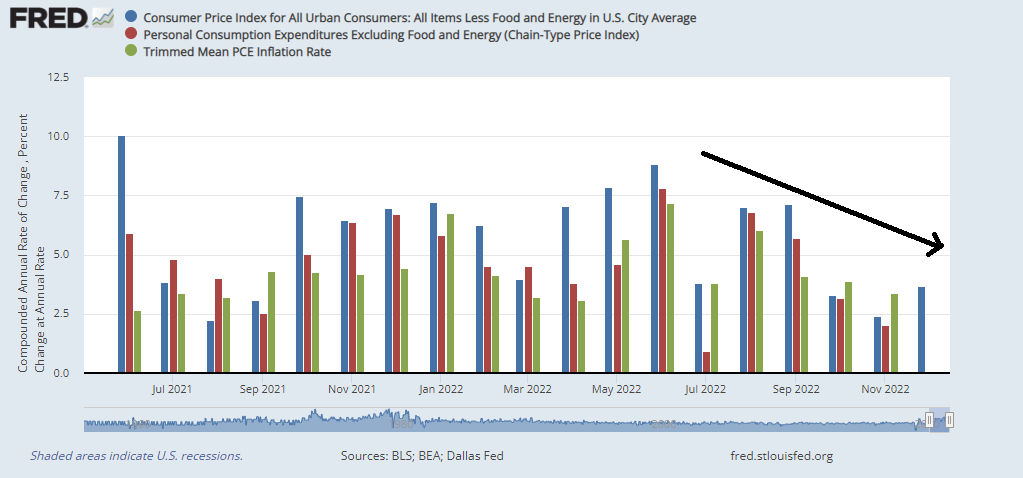
The recent string of tame inflation readings is good news, but Sahm believes the Fed shouldn’t pivot too quickly to cuts just in case inflation ticks up again.
The Fed is determined not to be head-faked again. It won’t cut until it’s confident about the lower inflation. That level of confidence is unlikely this year. If a recession comes or the market slides further, don’t expect the Fed to come to the rescue.
If even a dove like Claudia Sahm is calling for an extended rate pause, who am I to argue?
While conditions are slightly different in neighboring Canada,
BNN Bloomberg reported a reaction to the news of a conditional pause from a strategist that outlines the risks embedded in rate cut expectations.
The central bank reiterated that it will continue its fight against inflation, until it hits the two per cent target rate.
“To get that confidence that we’ll hit two to three per cent (inflation target rate), you can’t be discounting lower rates at the end of this year, because that just stimulates demand and it’s demand that gets you inflation,” Earl Davis, head of fixed income and money markets at BMO Global Asset Management, said in an interview on Wednesday.
“Best case scenario is we’re on hold for the balance of the year.”
That said, here are some events that could alter the trajectory of the Fed’s monetary policy.
Recession ahead?
The most obvious reason why the Fed may reconsider its rate pause is a recession. While the soft landing narrative is gaining in popularity among investors,
New Deal democrat, who monitors the economy using a discipline of coincident, short-leading, and long-leading indicators, pointed out that the index of leading indicators makes a recession a virtual certainty, though he is unsure of the timing because coincident indicators are still slightly positive.
The index has never declined this much without a recession having occurred. In fact, its current decline is almost as much as, or even more than, 3 recessions in the past 60+ years (1960, 1970, 1982) and nearly 50% as deep as the maximum declines in 3 others (1980, 1990, 2001).
In a similar vein, he commented in a
separate post about the GDP report that Q4 GDP, which is already ancient history, is positive, and the long leading components are negative. The leading components are “proprietors’ income, a proxy for corporate profits, and private residential fixed investment (housing) as a share of GDP”.
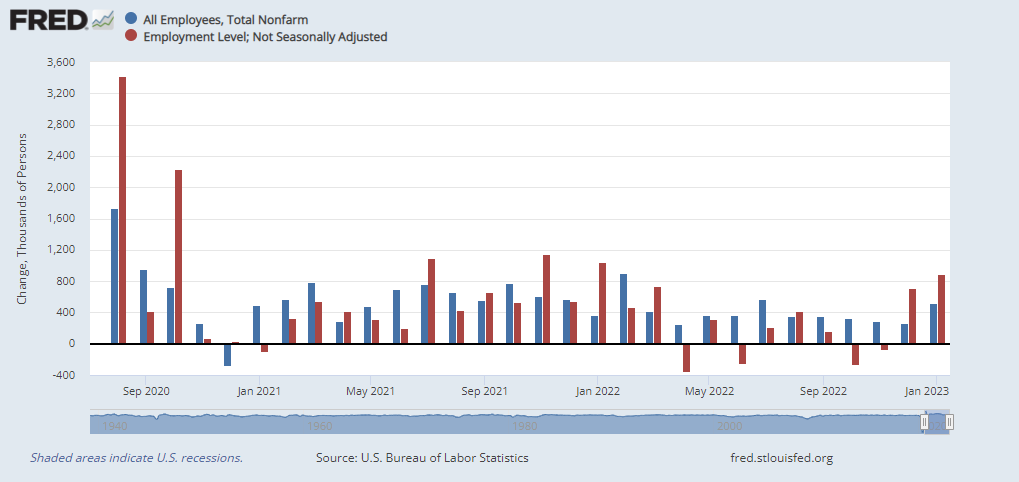
Now that goods inflation is receding as supply chain bottlenecks are mostly gone, the Fed has made it clear that it is focusing on wages and the jobs market. If a recession were to occur, the US has never experienced a recession without the unemployment rate rising at least 2%. Would the Fed react by cutting rates then? You bet.
The debt ceiling drama
Another possible scenario for changes to monetary policy is a debt ceiling fight that raises the risk of a financial crisis. Here is the backdrop that faces Fed officials. The economy is already shaky, the yield curve is horribly inverted, and Treasury announced the government has reached its debt ceiling and it is taking extraordinary measures to keep the government running and avoid a debt default. In the meantime, the Freedom Caucus wing of the Republican Party is dominant in the House of Representatives and they’re itching to flex their newfound muscles.
A debt ceiling fight is looming and neither side has much incentive to back down. We can all remember the last time this kind of brinksmanship occurred. In July and August 2011, stocks plunged -18% in less than three weeks. It could easily take a similar crisis this time to “get lawmakers’ attention before an agreement is made.
We’ve seen this movie before. The most likely scenario of a debt ceiling fight will occur in the following phases:
- Treasury announces that it is reaching a debt ceiling and it will undertake extraordinary measures, such as delaying pension fund payments, to avoid a default (check).
- Both sides make demands and the rhetoric rises.
- Just before X-date, the last day before a likely default, an agreement is made.
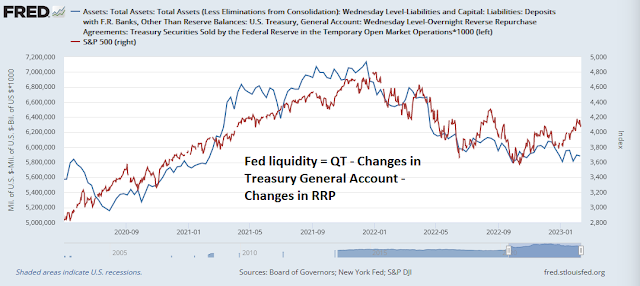
While a risk premium will undoubtedly creep into asset prices, the short-term effect of the Treasury’s extraordinary measures is risk appetite positive. That’s because Treasury will be running the balance of the Treasury General Account (TGA) at the Fed. A falling TGA balance adds liquidity to the banking system and counteracts the effects of the Fed’s quantitative tightening program. Historically, Fed liquidity (blue line), which comprises the effects of QT – TGA changes and Reverse Repo changes, has been correlated to the S&P 500 (red line).

Bloomberg columnist John Authers further highlighted the comments of Canadian Imperial Bank of Commerce currency strategist Bipan Rai about the effects of TGA injections on USD levels.
The shift in liabilities on the Fed’s balance sheet is crucial. With banks holding bigger reserve balances at the Fed, dollar scarcity in the system becomes less of a concern. That means there’s less need to look for dollar funding from elsewhere. Which means that fewer dollars will be bought. As such, Rai says, “even a modest increase in the need or desire for foreign currency in this environment should lead to drop in USD valuation.” He adds that the level of reserves at the Fed tends to be inversely correlated with the dollar over the long term.
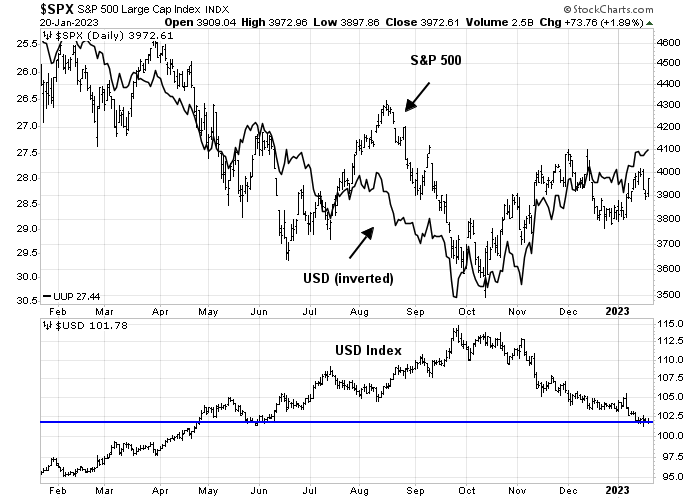
As a reminder, the USD has acted well as a risk appetite indicator as the S&P 500 has been inversely correlated to the USD for all of 2022.
Whether the members of the Freedom Caucus realize it or not, the debt ceiling fight has the short-term effect of easing monetary policy. However, as the brinksmanship continues and culminates in a last-minute deal, the most likely effect will see a tighter fiscal policy and a reversal of the de facto easing of monetary policy. Keep these effects in mind. Treasury Secretary Janet Yellen has said that X-date will be in early June.
Impossible to call Fed policy without China
Another consideration to keep in mind is the effect of China’s reversal of its zero COVID policy to reopen its economy. While I have voiced some skepticism about the staying power of any China reopening (see
Time to revisit the question: How investable is China?), the Chinese economy will see some sort of cyclical rebound starting in late Q1 or early Q2.
As Chinese workers return home for Lunar New Year celebrations, the risk is that such levels of travel have the potential to be a super-spreader event that brings the Chinese economy back to another screeching halt. Rural China simply doesn’t have the same level of medical facilities as cities like Shanghai and Beijing. However, anecdotal evidence from an article in
The Economist indicates that “Covid-19 has already torn through large swathes of China” and any superspreader effects are likely to be fairly minimal. Consequently, the odds of a reopening-related cyclical rebound are rising.
That said, reopening has its own risks to growth and the path of global monetary policy. Norges Bank Investment Management CEO Nicolai Tangen voiced his concerns in a
Bloomberg article:
“The big concern this year is what will happen with global inflation when China kicks in.” The problem with inflation potentially re-accelerating “is you’re not going to be making money anywhere:”
Indeed,
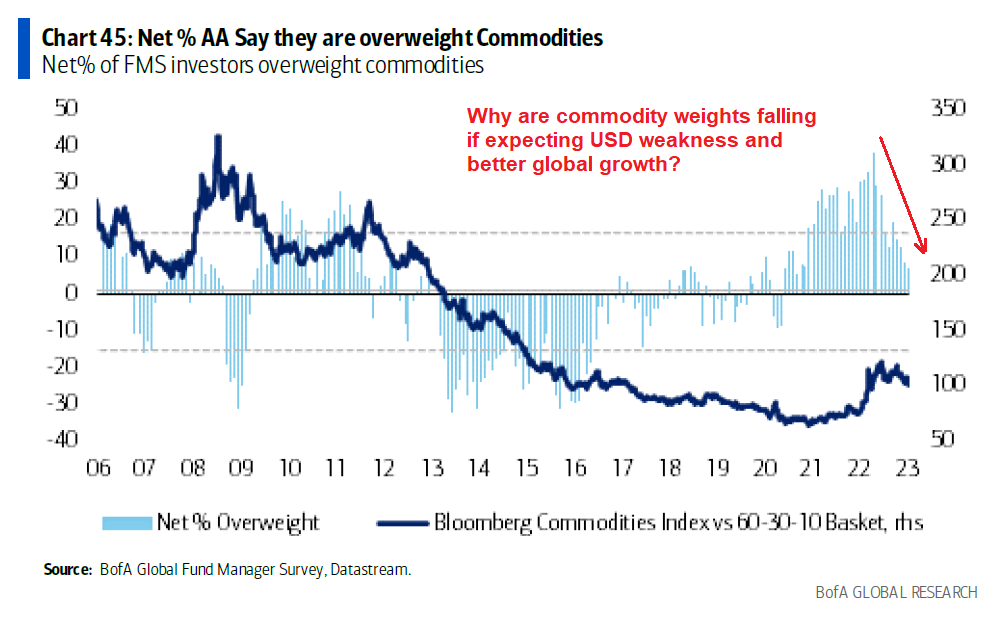
Variant Perceptions pointed out that China’s credit impulse has led the Chinese PPI by 12 months and the combination of Chinese stimulus and reopening has the potential to spark a commodity price boom.
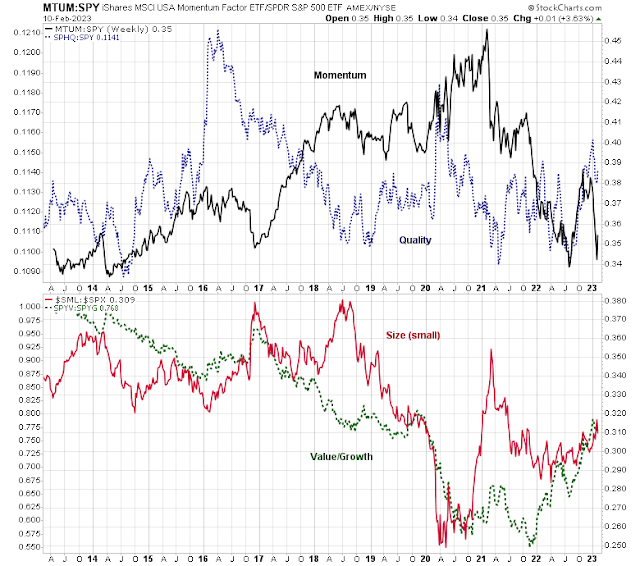
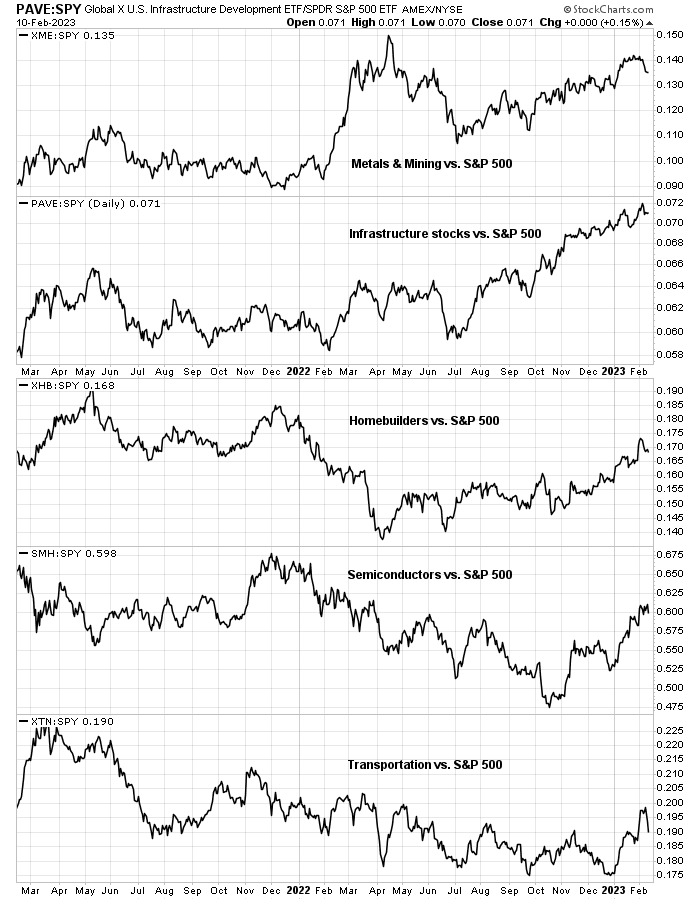
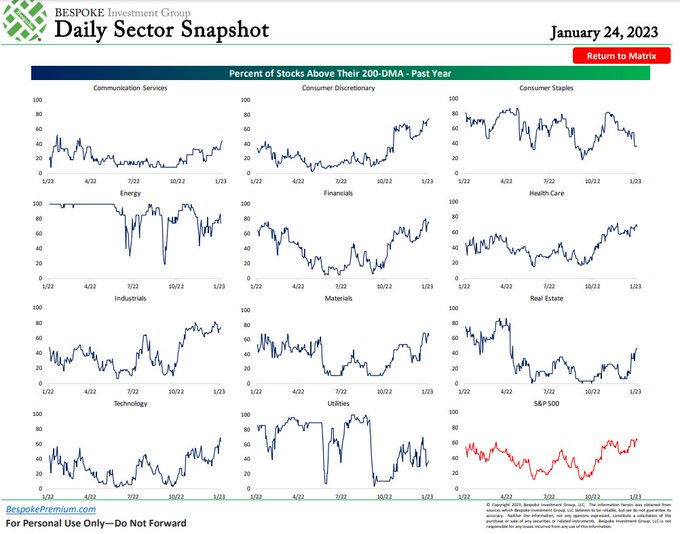
Already, many US cyclical industries are showing signs of outperformance and leadership.
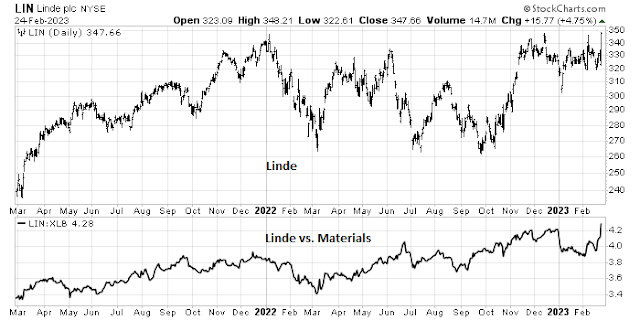
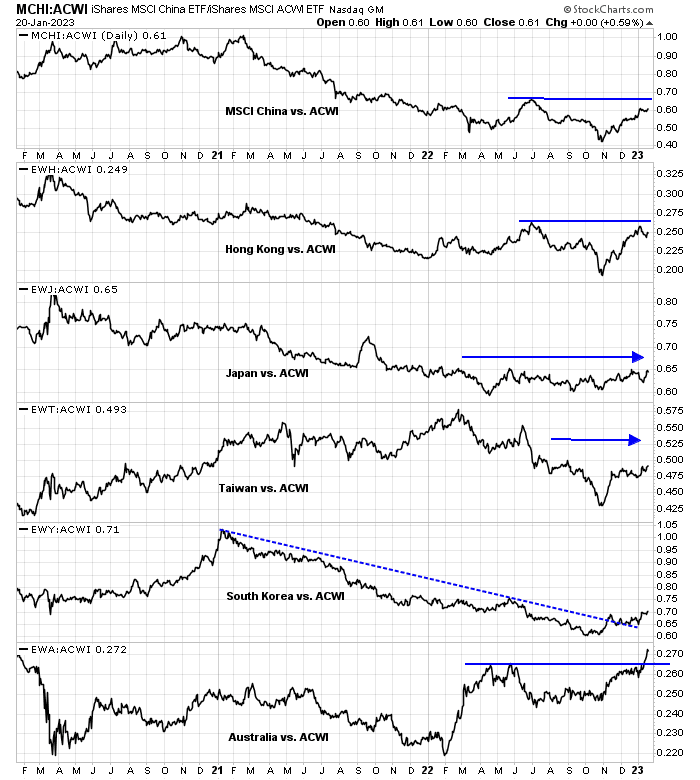
While the equity markets of China and her major Asian trading partners are still trading sideways relative to global stocks, the commodity-sensitive Australian market has staged an impressive relative breakout.
The relative performance of Chinese materials relative to global materials is also trying to bottom. Should Chinese materials begin to significantly outperform, it would be a definitive sign of momentum in the reopening trade.
A possible scenario would see Chinese demand from a cyclical rebound pushing up commodity prices. While the first-order effects of rising commodities only affect headline inflation and has minimal effect on core inflation, the perception of a successful China reopening, which would be evident during Q2, would make the Fed and other central bankers re-evaluate their rate pause. The narrative could turn to rate hikes instead of rate cuts.
Party now, pay later
Putting it all together, my base case scenario calls for a cyclical and reflationary rebound in Q1 and Q2, led by the prospect of China reopening its economy and the monetary easing effects of the US Treasury’s extraordinary measures which have the side effect of injecting liquidity into the banking system and weakening the USD. These are all developments that are positive for risk appetite.
As the inflationary effects of the China reopening become clear, the Fed will have to reconsider its rate pause and possibly raise rates by late Q2 or early Q3. This will also coincide with a probable debt ceiling deal that reverses the de facto effects of a reversal of QT and impose a dose of austerity to fiscal policy. Moreover, the negative effects of leading indicators will become felt and the economy will fall into recession. These are all developments that are negative for risk appetite.
In other words, party now, pay later.
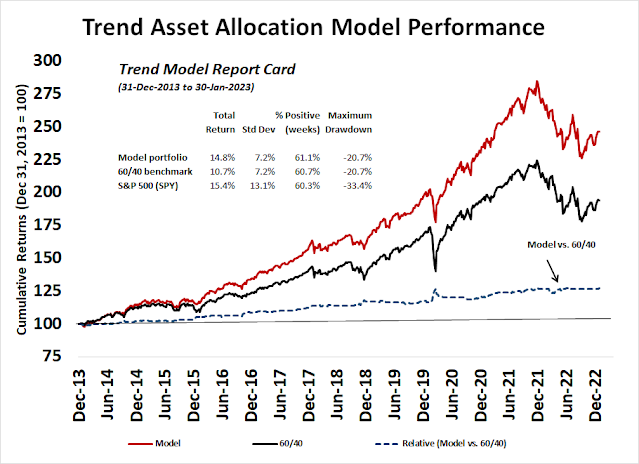
As a consequence, the Trend Asset Allocation Model is being upgraded from neutral to bullish. I will have more details in my publication tomorrow.