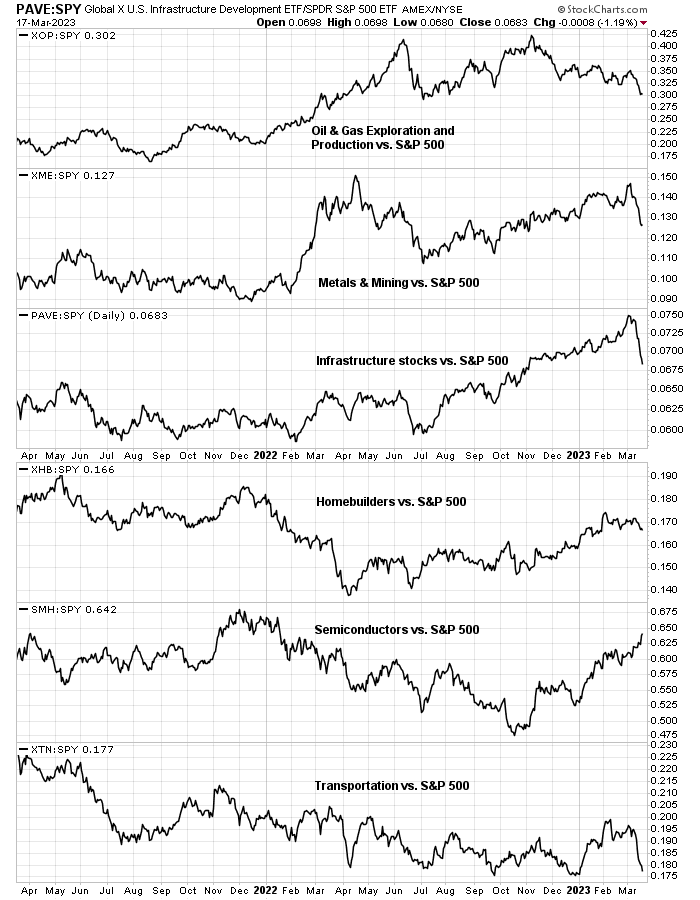
One of these cyclical indicators is not like the others. While many cyclical industries are in relative uptrends, which is a technical signal of economic expansion, the 2s10s yield curve is deeply inverted and shows few signs of steepening. This is one of those occasions when the stock market and bond markets disagree.
Which market is right? Maybe they both are.
What’s Fed thinking?
Let’s start with the economy and the Fed’s reaction function. Fed Chair Jerome Powell and other Fed officials have been repeating the mantra that the Fed will continue its inflation fight until the job is done and inflation is at 2%.
Here’s a quick snapshot of the economy. The Atlanta Fed’s
GDPNow estimate of 2.6% is signaling a strong expansion.
In addition, the US Economic Surprise Index has been rising, indicating economic data is surprising to the upside.
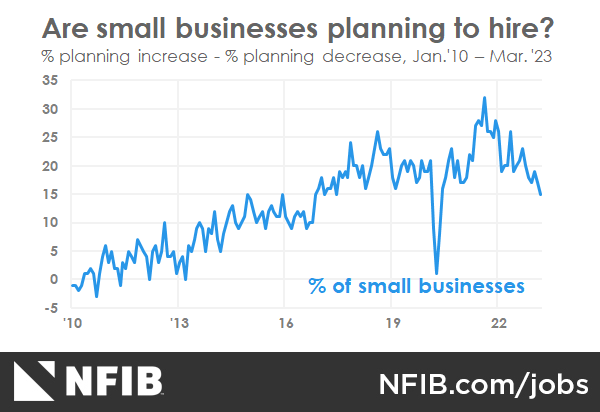
As the Fed has indicated it’s focused on the jobs market and wage growth in its inflation fight, here are some metrics to consider. Initial jobless claims have been flattening out and show uneven signs of rising even after all the monetary tightening.
Average hourly earnings, unit labor costs, and the employment cost index are all decelerating, but readings remain elevated. While recent signs of disinflation are welcome, services inflation has been sticky on the way down and the journey from 4-5% to 2% inflation could be much harder than anyone thinks.
That’s because, in light of the Fed’s hyper focus on wage and services inflation,
Steno Research argues that China’s credit impulse leads ISM services price. That makes China’s recent stimulative policies bad news for inflation in H2 2023.
As well, San Francisco Fed President Mary Daly warned that reshoring could raise the demand for labor and push up inflationary pressures:
If firms decide to reshore some or all of their foreign production facilities, costs and prices are likely to continue to rise. My conversations with business leaders suggest that some of this is already happening…a trend toward less global competition could mean more inflation in the goods sector and more pressure on overall inflation going forward.
Moreover, the combination of a decline in the labor force participation rate and low immigration is restricting labor supply and putting upward pressure on wages.
Another potential factor affecting future inflation is the ongoing domestic labor shortage. Labor force participation fell precipitously during the pandemic and has been slow to recover, especially among workers aged 55 years and older. These developments exacerbate the already significant downward drag on participation related to population aging. Absent a substantial pickup in the share of working-age adults looking to be employed or a large change in immigration flows, labor force participation will continue to decline and worker shortages will persist, pushing up wages and ultimately prices, at least in the near and medium term.
She concluded that “further policy tightening, maintained for a longer time, will likely be necessary”.
Even more worrisome is a
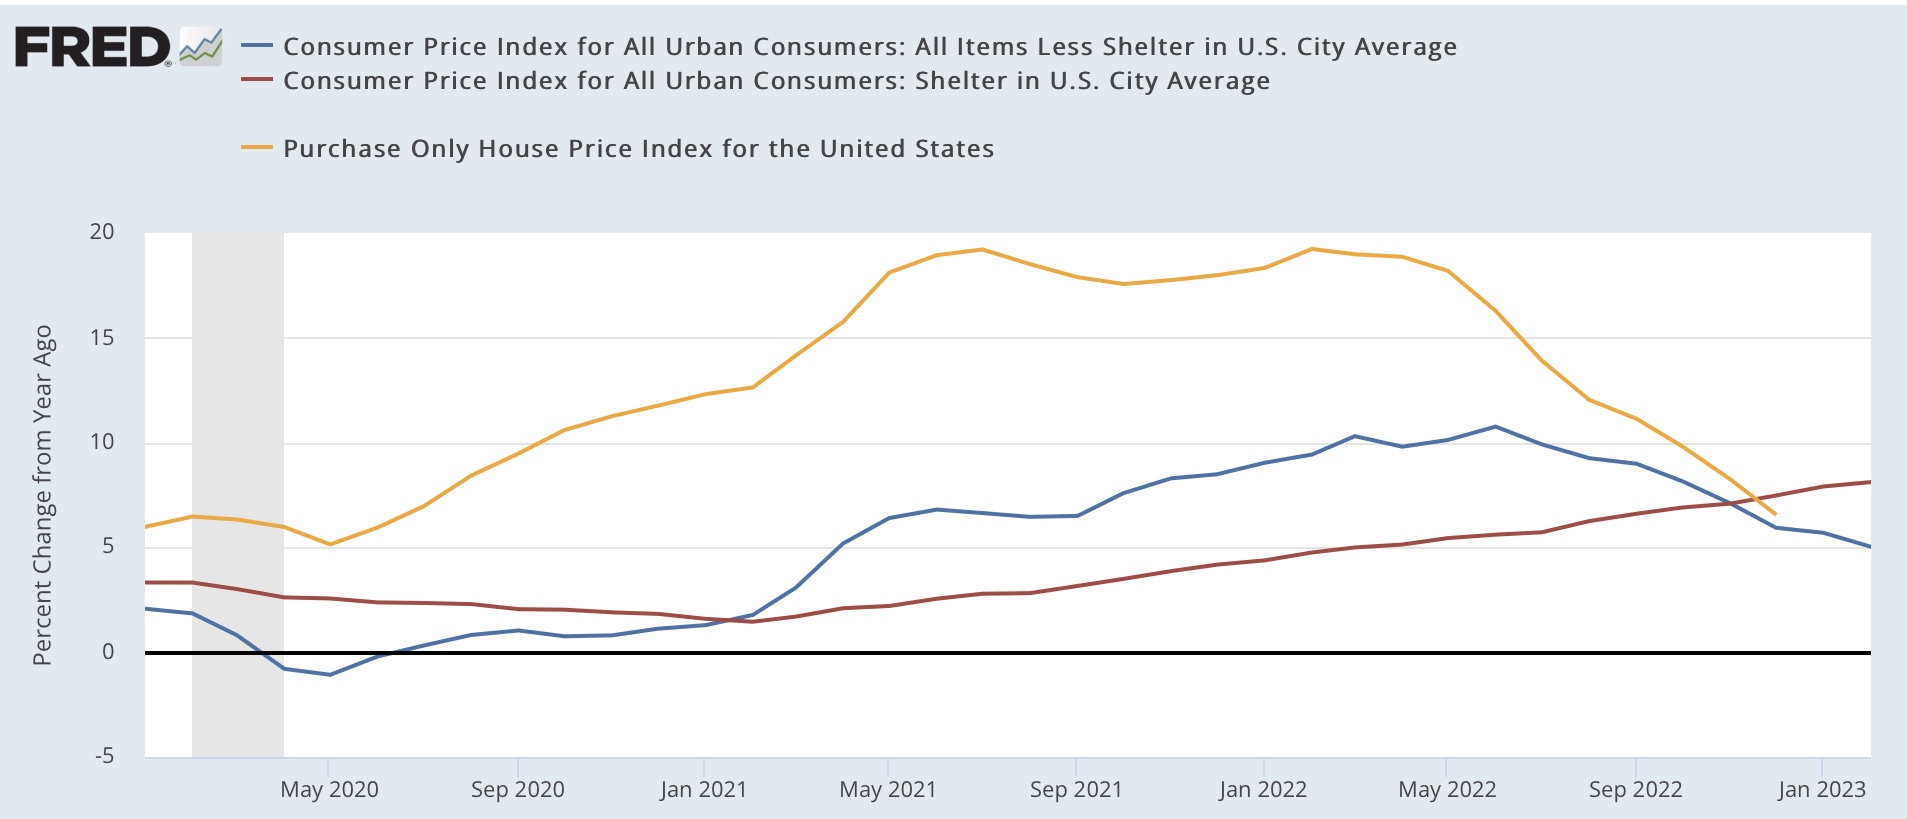
Kansas City Fed study that linked tight labor markets to rent inflation. With the Fed focused on services inflation, rents have been a major component of CPI and especially services inflation.
The study found that tight labor markets affect rent inflation because of “greater demand for rental units afforded by job gains and wage growth”.
Rent inflation responds more to labor market conditions compared with other components of inflation. We attribute this link between labor market tightness and rent inflation to greater demand for rental units afforded by job gains and wage growth. Although online measures of asking rents currently suggest official measures of rent inflation will decline, we caution that rent inflation is likely to remain above pre-pandemic levels so long as the labor market remains tight.
As a consequence, Fed Chair Jerome Powell sounded a hawkish tone during his Congressional testimony and put a 50 bps rate hike on the table for the next FOMC meeting.
What’s bond market thinking?
Here’s one way of squaring the circle of disagreement between the stock and bond markets. The accompanying chart shows two cyclical indicators, the 2s10s yield curve and the copper/gold ratio. The historical evidence shows that the 2s10s yield curve normalizes about 1-3 before a recovery in the copper/gold ratio.
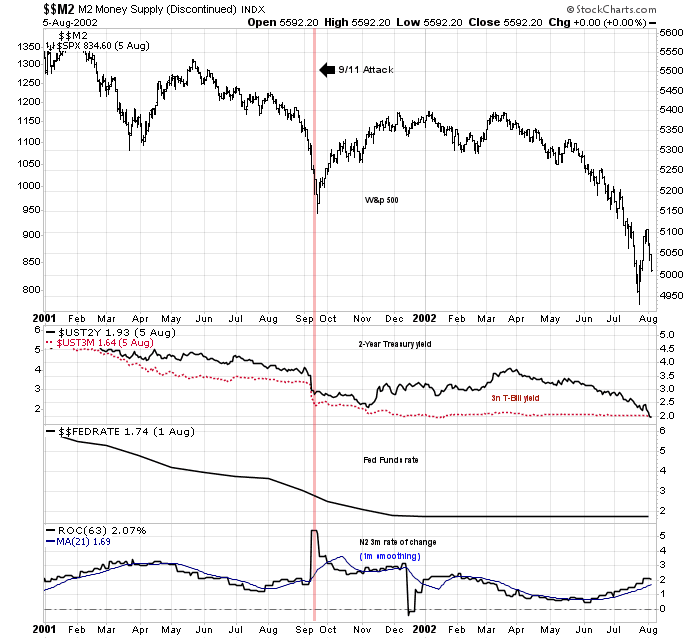
Fast forward to 2023. As investors have already observed from stock market internals, cyclical industries are roaring ahead, just like the copper/gold ratio. This presents a problem for the Fed. How can it control inflation when readings at still elevated and, if current signs of an expansion are correct, it would lead to further inflationary pressures? The answer is more monetary tightening that’s beyond market expectations. Current conditions are reminiscent of the double-dip recession of 1980-1982, when the Fed reversed its accommodative policy and tightened to extremely painful levels. Instead of a double-dip, current recovery expectations are likely to be a false dawn.
Bond market expectations are already reflecting the false dawn scenario. The 2-year Treasury yield, which can be thought of as a proxy for market expectations of the terminal Fed Funds rate, is making a new high for the cycle. Historically, peaks in the 2-year rate have been either coincident or led peaks in the Fed Funds rate, though the signal has shown a hit-and-miss record on stock market timing. Bottom line, the peak in the 2-year rate is ahead of us, which raises the uncertainty of any Fed Funds forecast.
Will the Fed break something?
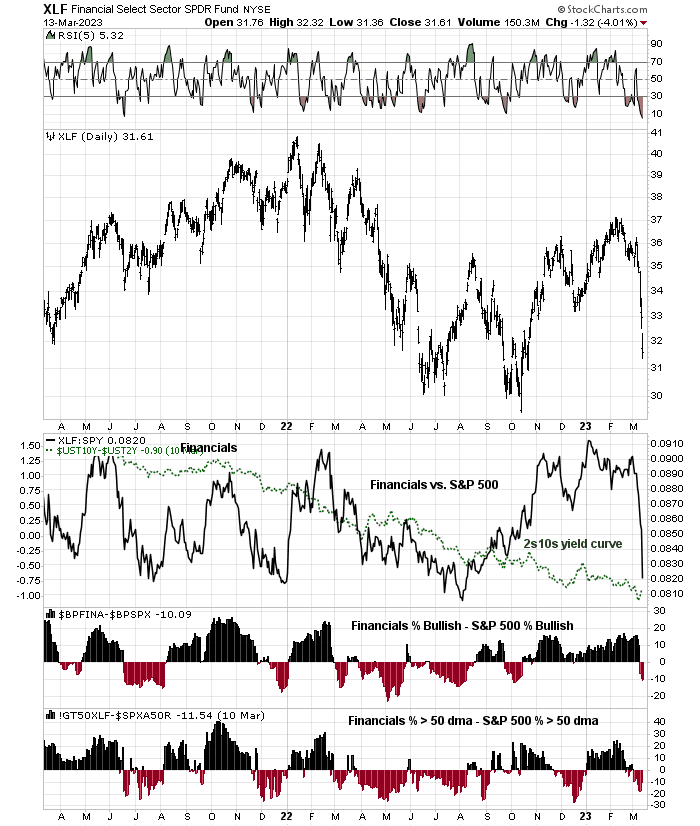
In the past, Fed tightening cycles always breaks something. Nothing has broken yet in the current cycle, but the behavior of bank stocks is concerning. Banks tend to borrow short and lend long, and therefore the shape of the yield curve affects profitability. It’s no surprise that the relative performance of banks is correlated to the yield curve, but the recent violation of relative support by bank stocks and the SVB Financial Group and Silvergate Capital debacles could be the signal of rising stress in the banking system.
These circumstances lead me to believe that the combination of a cyclical rebound and elevated inflation rates raises the odds of a double-dip recession. While history doesn’t repeat itself but rhymes, the 1980-1982 experience may be a useful template to think about the stock market. In that case, current market conditions puts is at about Q2 or Q3 1980. Brace for volatility.
In addition, the 2s10s yield curve is also pointing toward a false dawn recovery. In the past, yield curve normalization leads the copper/gold ratio, which is a key cyclical indicator, by 1-3 years. The 2s10s yield curve hasn’t even begun to normalize in any signification fashion yet but the copper/gold ratio has turned up. This “false dawn” pattern is highly reminiscent of the 1980-1982 experience.
In conclusion, current equity market expectations of a cyclical recovery is simply unrealistic in light of the Fed’s focus on 2% inflation. Any signs of growth will be met with tighter monetary policy that will have the effect of pushing the economy into recession. While history doesn’t repeat itself but rhymes, the current situation is highly reminiscent of double-dip recession of 1980-1982. While the technical conditions are still constructive for stock prices, investors are advised to be prepared to revise their risk profile as conditions may change later this year.