Preface: Explaining our market timing models
We maintain several market timing models, each with differing time horizons. The “
Ultimate Market Timing Model” is a long-term market timing model based on the research outlined in our post,
Building the ultimate market timing model. This model tends to generate only a handful of signals each decade.
The
Trend Asset Allocation Model is an asset allocation model that applies trend-following principles based on the inputs of global stock and commodity prices. This model has a shorter time horizon and tends to turn over about 4-6 times a year. The performance and full details of a model portfolio based on the out-of-sample signals of the Trend Model can be found
here.
My inner trader uses a
trading model, which is a blend of price momentum (is the Trend Model becoming more bullish, or bearish?) and overbought/oversold extremes (don’t buy if the trend is overbought, and vice versa). Subscribers receive real-time alerts of model changes, and a hypothetical trading record of the email alerts is updated weekly
here. The hypothetical trading record of the trading model of the real-time alerts that began in March 2016 is shown below.
The latest signals of each model are as follows:
- Ultimate market timing model: Sell equities
- Trend Model signal: Neutral
- Trading model: Neutral
Update schedule: I generally update model readings on my site on weekends and tweet mid-week observations at @humblestudent. Subscribers receive real-time alerts of trading model changes, and a hypothetical trading record of those email alerts is shown here.
Subscribers can access the latest signal in real time here.
An inverted yield curve
James Carville, who was Bill Clinton’s political strategist, famously said, “I used to think if there was reincarnation, I wanted to come back as the president or the pope or a .400 baseball hitter. But now I want to come back as the bond market. You can intimidate everybody.”
If the bond market were to intimidate everybody, what’s it saying? The accompanying chart shows the spread between the 2-year and 10-year Treasury yield, which is currently inverted. If history is any guide, inverted yield curves are bad news for stock prices.
Some analysts have quibbled with the use of the 2s10s yield curve as a recession forecaster. The spread between the 10-year and 3-month T-Bill has been a more accurate gauge. Market expectations call for a 75 bps rate hike at the September FOMC meeting, which will either invert the 3m10y curve or close to it.
I conducted a study of sensitivity analysis of asset class returns. I first compiled monthly asset prices in USD and calculated the returns based on whether the yield curve was steepening, flattening or inverting, or neutral. The steepening or inverting categorizations were based on whether movements in the yield curve were one standard deviation above or below the monthly average for the period. Asset returns were then placed into three buckets, steepening, neutral, or inverting. The results shown in the table are the annualized median returns of the asset classes, which are in USD with the exception of fixed income assets, which are expressed in changes in yields and in local currency.
The results of the study are clear. Inverting yield curves, which is the current regime, is challenging for equities across all geographies and for commodities. Equities and commodities perform best when the yield curve is steepening. By contrast, bond yields tend to fall (and prices rise) when the yield curve is inverting but face headwinds when the yield curve steepens.
A fear of higher rates
The current environment argues for an overweight position in bonds, but the market isn’t behaving as expected. Yields are rising because the market is afraid of the Fed’s hawkishness.
Signs are emerging of a global slowdown. The cyclically sensitive copper/gold ratio is pointing to a weakening economy. Historically, the copper/gold ratio has been highly correlated to the 10-year Treasury yield, but a divergence is appearing between the two.
Similarly, a gap is appearing between the 10-year Treasury yield and oil prices. I interpret these conditions as the market being more afraid of what the Fed might do to interest rates than being afraid of recession, which normally depresses bond yields.
Indeed, commodity prices are under pressure, which is a sign of global economic weakness. Energy prices have held up better because of supply shortages caused by the Russo-Ukraine war.
Bond bullish
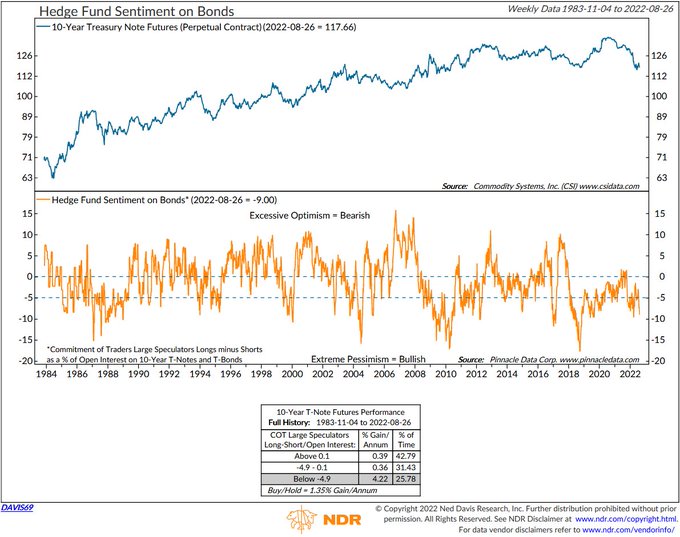
All of these factors argue for a bullish outlook for bond prices, especially when hedge fund sentiment on bonds is extremely bearish.
Historically, a falling copper/gold and the more broadly diversified base metals/gold ratios has historically been bearish for equity risk appetite.
However, equity investors can find some outperformance in high-quality long-duration stocks such as NASDAQ 100 large-cap growth names.
Key risks
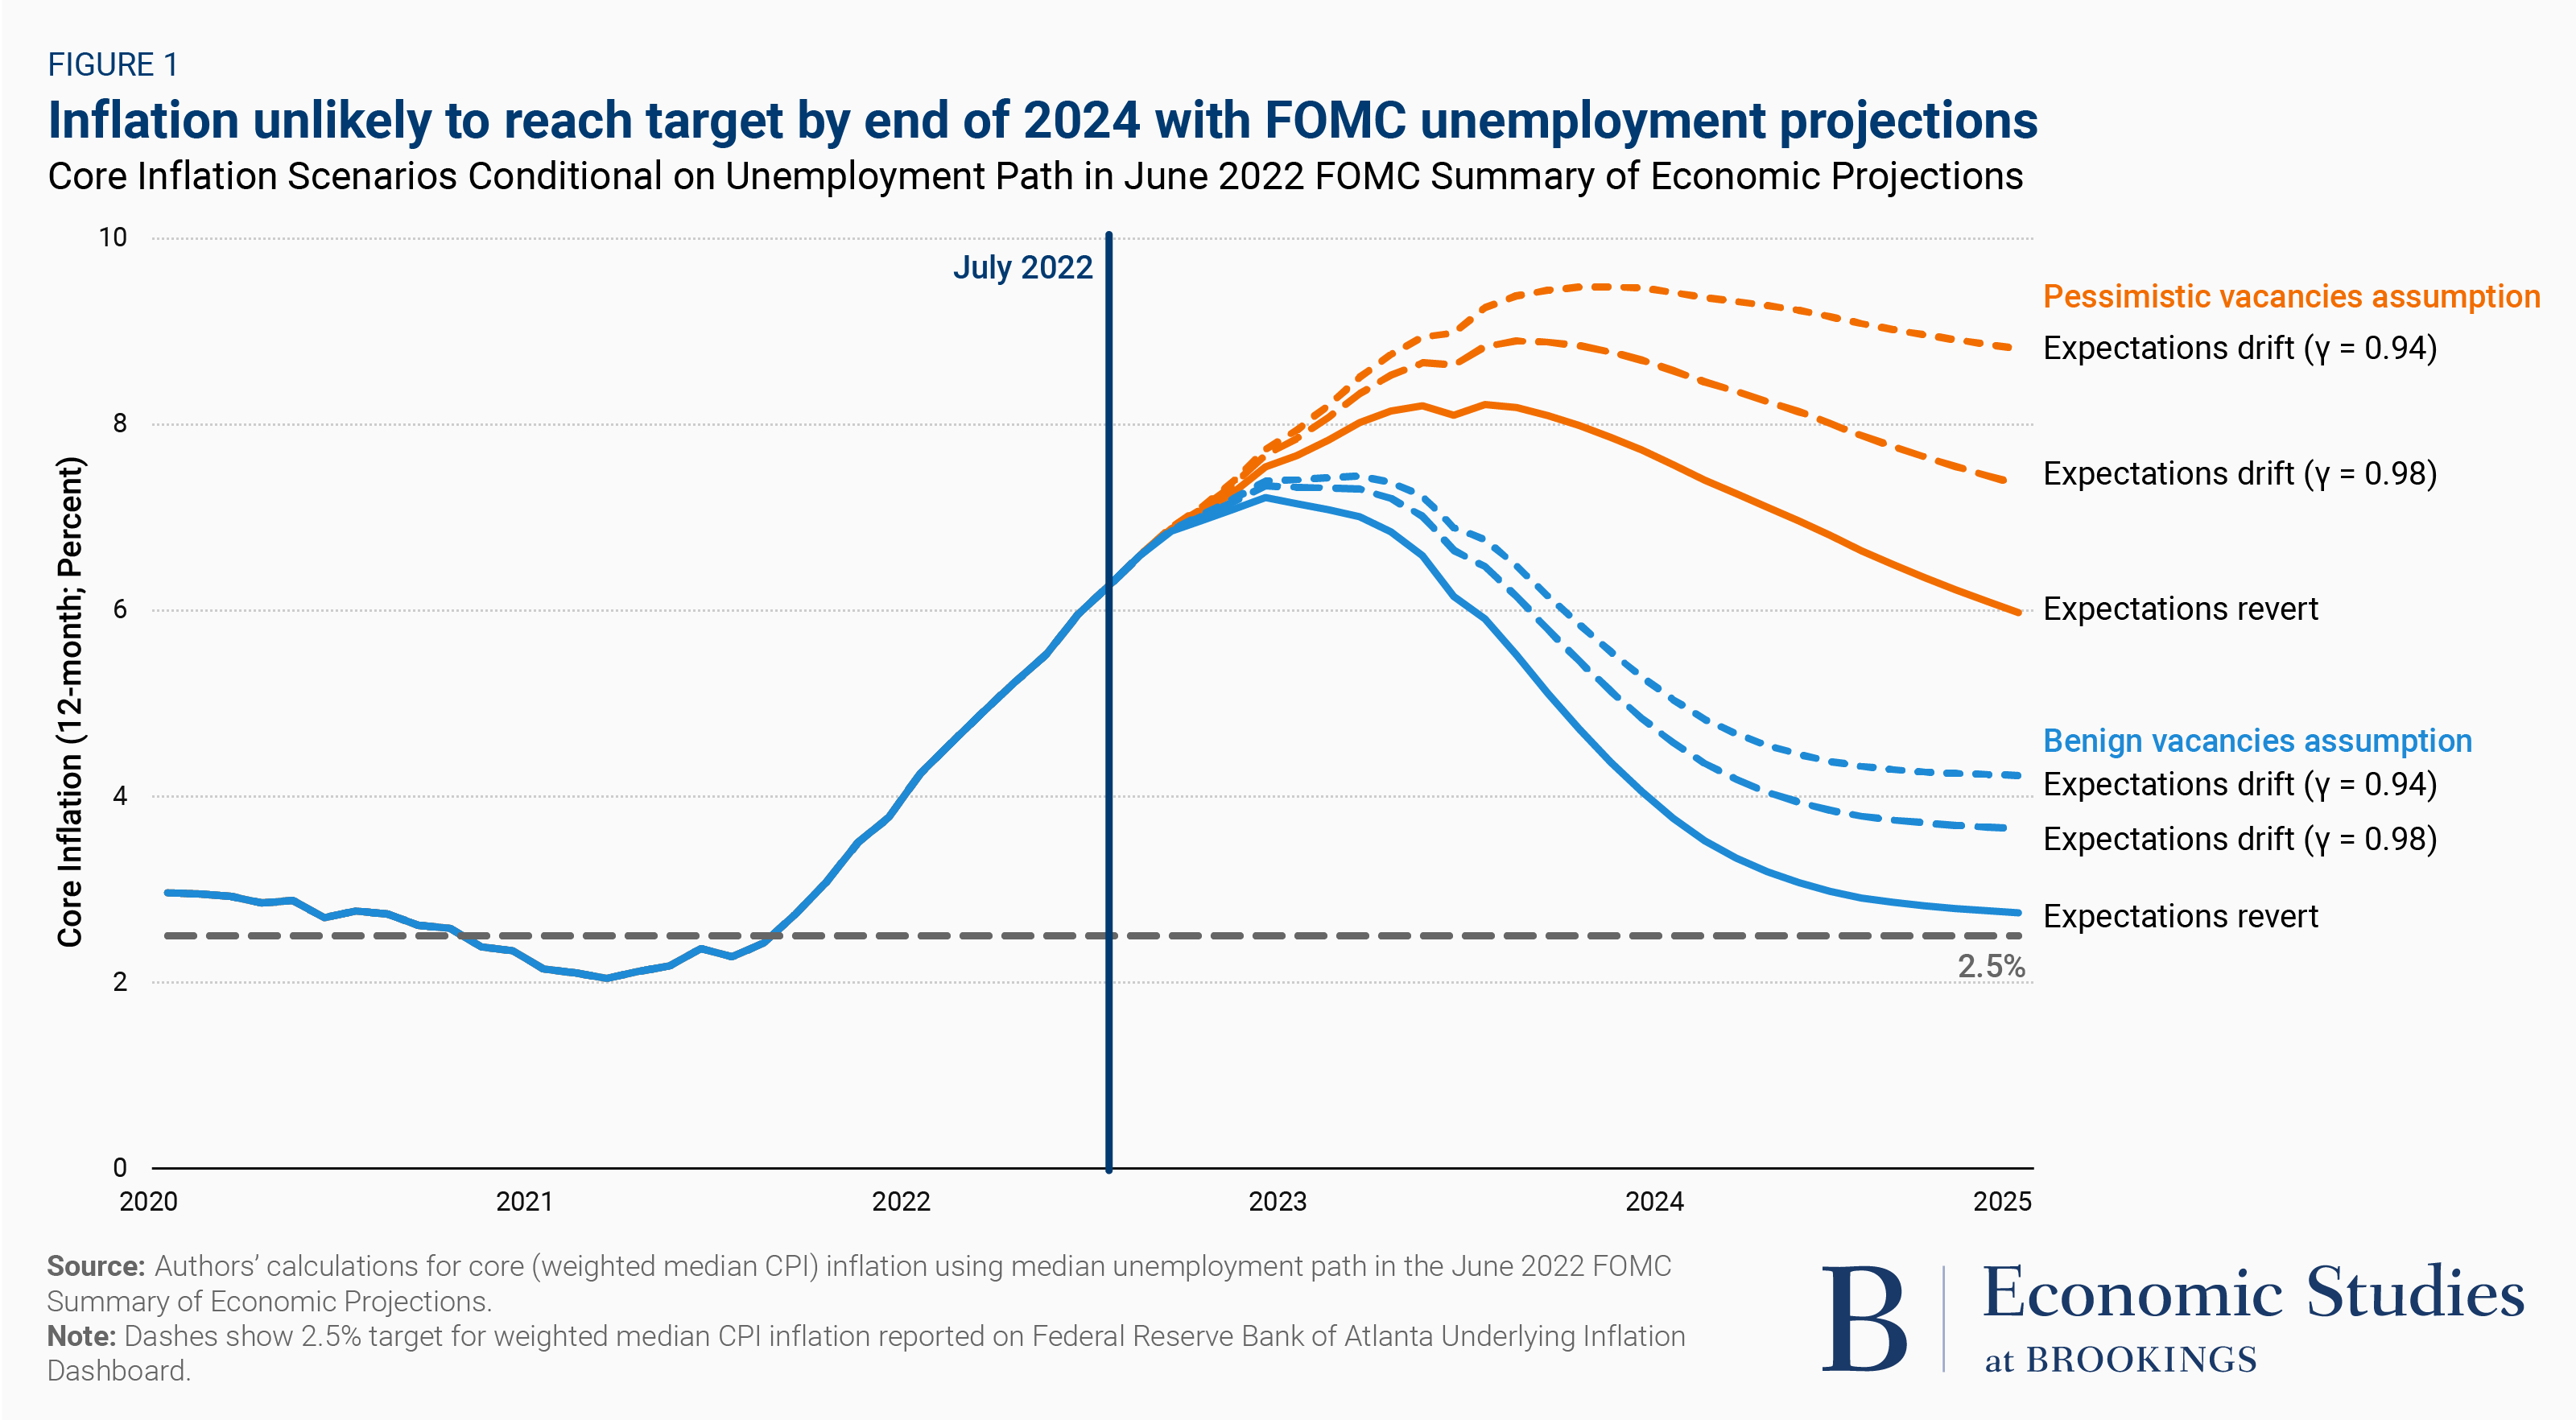
There are two key risks to the bond bull scenario. The first is a more hawkish than expected Fed. A
paper presented at the Brookings Papers on Economic Activity argues that the Fed will push unemployment significantly higher in order to hit its 2% inflation target.
According to the paper, whether the Fed can achieve its objectives depends on whether it is possible to slow demand in such a way that vacancies decrease but unemployment doesn’t rise (returning the V/U ratio to its pre-pandemic norm) and on whether consumers and businesses start to expect that high inflation will continue for the longer term, and thus plan for it. Under optimistic assumptions for both the V/U ratio and long-term inflation expectations (and assuming the Fed’s 4.1 percent unemployment projection proves correct), the paper projects the Fed will bring core inflation down close to its target by the end of 2024. However, under the most pessimistic assumptions for both the V/U ratio and inflation expectations, core inflation rises to about 8.8 percent if unemployment moves up only to 4.1 percent.

A soft landing is possible but highly unlikely. The Fed will have to be more aggressive and tighten policy. While this will eventually be bond price bullish, in the short run it will raise interest rate expectations, which is bond market bearish.
Keep an eye on the August CPI report, which is due Tuesday. Consensus expectations call for a monthly increase of -0.1% in headline CPI and a 0.4% increase in core CPI, which are tamer than the
Cleveland Fed’s inflation nowcast.
Fed Governor Christopher Waller gave a
speech Friday just before the FOMC blackout window affirming the Fed’s commitment to stay the course in its inflation fight because the “consequences of being fooled by a temporary softening in inflation could be even greater now”. Translation: Expect high rates for longer.
To sum up, while I welcome promising news about inflation, I don’t yet see convincing evidence that it is moving meaningfully and persistently down along a trajectory to reach our 2 percent target. I keep in mind that a year ago we saw similarly promising evidence of inflation moderating for several months before it jumped up to a high and then very high level. Those earlier inflation readings probably delayed our pivot to tightening monetary policy by a few months. The consequences of being fooled by a temporary softening in inflation could be even greater now if another misjudgment damages the Fed’s credibility. So, until I see a meaningful and persistent moderation of the rise in core prices, I will support taking significant further steps to tighten monetary policy.
The other risk is a sudden policy pivot in response to crisis conditions, which changes the narrative from recessionary conditions to renewed growth, and would see the yield curve steepen, bond yields rise, and cyclical stocks outperform. The risk of such a scenario may already be underway in Europe (see
Assessing “Big Short” Michael Burry’s crash warning).
S&P 500 stall ahead?
As for the stock market, I have suggested in the past week that equities were due for a relief rally and it appeared more or less on schedule (see
Saved by Fibonacci). However, the rally may be about to stall after the S&P 500 regained its 50 dma on Friday. The VIX Index has recycled from above its upper Bollinger Band to its 20 dma. The market advance has stalled in 8 out of 9 cases in the past year when this happened (pink=stall, grey=rally). If the bulls were to decisively take control of the tape, the index needs to breach the next major resistance level at the falling trend line, which also happens to coincide with the 200 dma at about 4275.

The NYSE McClellan Oscillator (NYMO) has recovered from below -1000 to almost the neutral level. While the market can rise further, any bullish trading edge from the oversold signal is past. I pointed out last week that there were 9 instances in the past 10 years when NYMO has recovered from a -1000 reading. The market went on to weaken in 8 out of the 9 cases (see
How to trade the failed breadth thrust).
The relative performance of defensive sectors appear constructive. If the bottom four charts were stocks, a case could be made for buying their dips.
In the short run, breadth indicators are at an overbought extreme, which indicates the market is due for a pause and pullback.
Even though the market is tactically poised for some weakness, I am reluctant to short into strength as the 14-day RSI of the S&P 500 Intermediate-Term Breadth Momentum Oscillator (ITBM) is turning up and it wouldn’t take too much further strength for this model to flash a buy signal. As the ITBM has been an extremely reliable trading model, shorting just ahead of a possible buy signal is probably not a good idea. My inner trader is staying on the sidelines for now.
As well,
SentimenTrader shared his surprise at the capitalization weighted outsized institutional put/call ratio, indicating excessive institutional bearishness. At a minimum, such bearishness would put a floor on stock prices should they weaken.
In conclusion, cross-asset signals from the commodity market indicate that bond prices are poised to rise, which should provide a tailwind for large-cap NASDAQ stocks. The key risks are continued market fears of rising rates from hawkish Fed rhetoric, and a possible sudden policy reversal in response to crisis conditions, which changes the narrative from recessionary conditions to renewed growth.
Disclosure: Long ZROZ


“that bond prices are poised to rise, which should provide a headwind for large-cap NASDAQ stocks”
Should this read “tailwind” ?
Yes. Now corrected.
Experts on this group, do you think a Roth conversion is a good idea? Thanks.
Consider your age, tax bracket, plans to spend the Roth money vs. leave it as legacy. I have always been a proponent of doing them regularly (barring for those in the highest bracket) for the peace of mind it provides that you’ve taken your medicine and will not pay taxes on those dollars again. Less important, but still a consideration – how is your pre-tax money invested? How much is it down from previous highs? Is this an opportunity to do it on the “dip”?
Thanks Mark. Makes sense.
It amazes me how much people still have faith in the clowns that run our federal reserve. Just over a year ago our astute fed chairman was pounding the table for months on “transitory” inflation. One year later, people think there is a chance at a soft landing? After the fed was completely wrong, and had to tighten and crack the markets? IMHO, we are now being taken by the fed into recession that won’t be over until the market sees a rate of change in the right direction for overall corporate earnings. I have been long bonds and I have been wrong so far, but I am pretty sure the fed will bail me out. !0 year yields still making lower highs here. What I won’t do when bonds start to rally is buy growth factors. As Ken puts it, this market is different, and when rates drop this time, in my opinion, the reccesion will be deep, and growth will not outperform, other than maybe a very short term reactionary trade.
Except for IPOs and stock compensation the equities do little for the economy. Even the compensation aspect affects only those with the vested options, so really it’s only IPOs and whatever what is it “shelf offerings” that raise capital, what we buy is secondary market which does nothing to the companies.
Bonds on the other hand have a large impact for raising capital and rolling debt over. Similar to mortgage rates to home buying. So what will happen to all these less than pristine companies when it is time to roll over their debts? Something like 20% are zombies, how many almost zombies will there be at higher rates and lower earnings in a recession?
Both ZROZ and TLT have broken a rising trend line dating back to 2010 or earlier for TLT, what does that mean? There is a horizontal line of support dating back 5 years, what if it breaks? But when the pivot comes, they should rocket higher because the debt burdens cannot be managed with high rates. So for the pivot it is not an “if” question but a “when”.
Hold only good quality stocks that will be able to handle their debts because the zombies are getting to the end of the movie and we know how those end.
I saw Q ratio today, 1.51
Looking back to 1900 it has hit .3 at the lows, with the average being around .75 which was touched in 2009.
A drop to .75 would mean a 50% drop in market cap if replacement costs did not change which would put the S&P at around 2100, so is Burry crazy? A drop to .3 would meanS&P at 800. Of course it takes years to happen and inflation raises replacement costs, but even 1929 the Q only hit 1.06 and in 2000 it was 1.67. So guys like Hussman who talk about negative 12 year returns could very well be right.
Restarting a few positions for a trade.
SPY/ TLT/ TIP.
And out immediately.
1. I tend to be early, and this time I’m less interested in scaling into (ie, averaging into) a position.
2. My buys were almost immediately met with regret.
There’s no need for risk exposure right now.
Walter Deemer spots a reversal island on SPY.
This is a case of them shaking the tree…I am short the euro, last week when the ECB bumped rates up the euro went against me, but it has been in a downtrend for months, so today we get the cpi print, which honestly we don’t notice anything on a day to day basis, and we know that a single number means little, but the market tanked and the euro dropped a lot….so they have excuses for shaking things and separating us from our money.
CCJ was up for a while, it has held up well compared to the S&P and also other uranium miners like UEC and NXE….makes me wonder what’s going on, if anything.
Today (09/13/22, Tuesday, CPI release) was one of those days traders asked how come there was no signal to short from yesterday? Well, there was actually an intraday breadth signal that got triggered and went short yesterday afternoon 13:05 at ES 4120.50 (which unfortunately was ignored completely because the intraday return had been lagging). The short at 4120 would had required quite a large stop because ES hit a high of 4175 so this short was not an optimal trade going into a news release):
84 Sho 09/12/2022 1305 4120.50
Of course if one is trading the daily signal using the same set up, one would see a short by the end of today, but not yesterday. These are the types of days that does havoc and large drawdowns to daily strategies but intraday signals hopefully could had given a warning.
https://i.imgur.com/znqsFBH.png
For what it is worth, the very short term breadth model issued a flip to buy at ES 3966 (SPX ~3949) at 10:45 am Sep 14, 2022. This signal is very much susceptible to reversal but sometimes signals a longer trend. Perhaps the indices will recover higher into Friday options expiration since all sides a well hedged and reversion to the mean is more likely.
https://i.imgur.com/P9xc4TH.png