A number of readers asked me to comment on Michael Burry’s forecast of a crash, according to a report from Business Insider.
Doomsday is finally here, he hinted in a since-deleted tweet this week.
The fund manager of “The Big Short” fame shared a screenshot of a S&P 500 chart, showing the benchmark stock-market index has tumbled 18% from its December peak, despite several blistering rallies this year.
“And yet I keep getting asked ‘wen crash?'” he tweeted, poking fun at some of his followers’ poor spelling, and underlining his view that the market collapse is underway.
Burry suggested in May that the S&P 500 could drop as low as 1,900 points, or another 53%, over the next few years, based on how past crashes have played out. Moreover, he has dismissed the rebounds in stocks this year as bear-market rallies or “dead cat bounces” — temporary reprieves along the road to inevitable disaster.
The S&P 500 has a downside potential of 1900? How plausible is that scenario?
Conventional technical analysis
While technical analysts style themselves as contrarians, the analysis of Ari Wald more or less represents the mainstream view among chartists (as reported by
J.C. Parets), In short, the stock market is undergoing a bottom process that should see higher prices by next year.
Looking at the last 21 bear cycles, 12 of them bottomed in a mid-term year, and six of those bottoms occurred between June and October: 1962, 1966, 1974, 1982, 1990, and 2002. We expect 2022 to be added to this list,
For a more nuanced perspective,
Marketwatch reported that the equity outlook depends on whether the economy sinks into recession.
“Recession fears are the most likely trigger of a retest of the June lows,” said Ed Clissold, chief U.S. strategist at Ned Davis Research, in an Aug. 31 note. “From a seasonality perspective, a retest could come in the next several weeks.”
Whether any “retest” of the stock market’s lows is brief may depend on the ability of the U.S. to avoid a recession, according to Ned Davis.
“The average non-recession bear lasts about seven months and has declined 25% (-18% over the past half century), putting the January – June drop in line with the typical case,” Clissold wrote in the Ned Davis note. “Conversely, the average recession bear has lasted about a year (17 months over the past 50 years) and declined a mean of 35%.”
The S&P 500 fell -23.5% peak-to-trough in 2022, which is consistent with a non-recessionary bear market. However, if the US economy were to see a recession in 2023, which is likely, downside risk could be higher.
Valuation risk
From a fundamental perspective, the S&P 500 suffers from a lack of valuation support. The index is trading at a forward P/E ratio of 16.8, which is below its 5 and 10-year historical averages. However, the last time the 10-year Treasury yield was anywhere near current levels, the forward P/E fell below 14.
All else being equal, a forward P/E of 14 would translate into a downside S&P 500 target of 3320. The Transcript, which monitors earnings calls, recently highlighted a trend among bottom-up repors of weakness that points to earnings deterioration and EPS downgrades from Wall Street analysts.
Still, we’ve recently been noticing that there is a negative divergence between macroeconomic and microeconomic commentary. Many companies are seeing signs that could indicate that we are in the early stages of deceleration. These signs include bloated retail inventories, lower-income consumers trading down, falling used car prices, the pace of hiring slowing down, and weak consumer electronics sales, to name but a few.
Assuming that earnings estimates fall by -25% in a bad recession and applying a forward P/E of 14, the S&P 500 could fall to 2490. A level of 1900 on the S&P 500, based on Burry’s maximum downside risk, would mean a forward P/E of 8.0 to 10.7, which would be highly unlikely gifts from the market gods.
While the fundamental forecasts of downside risk could see considerable downside risk to the S&P 500, I concluded from this analysis that Burry’s fo€1recast of doom is overblown.
So bad it’s good
There is a third way of threading the needle between the relatively sanguine outlook of technical analysts and the more bearish outlook of fundamental analysis.
Last week I suggested that a
financial crisis could be the bulls’ best hope, it appears that we are on the verge of another Lehman moment, but in Europe. Eurozone banks are the counterparties to $1.5 trillion in margin calls and the
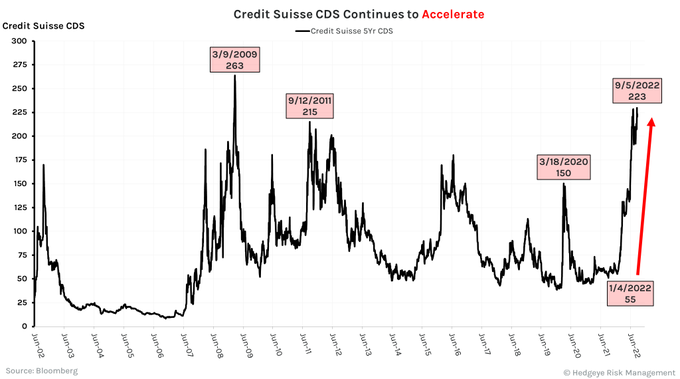
Financial Times reported that European power producers face €1 trillion in margin calls. As an example, Credit Suisse credit default swaps are approaching levels last seen at the last Lehman Crisis. This could be nothing, but it’s difficult to tell what other banks are vulnerable to in their derivative exposure.
The energy shock is shutting down most of Europe’s businesses. In a
joint letter, over 40 CEOs of European metal groups warn of an “existential threat” to the industry due to sky-high gas and electricity prices. The group warned that “50% of the EU’s aluminium and zinc capacity has already been forced offline due to the power crisis”.
As expected, the ECB raised rates by 0.75% last week and it’s tightening into a recession. Moreover, it has to manage the widening yield spread between German and Italian paper.
The IMF published a
paper calling for deficit rules that force high-debt countries to balance their budgets within 3-5 years, along with a more integrated fiscal policy to guard against sudden economic shocks.
Here is the good news. The Russo-Ukraine war is turning against the Russians. According to the
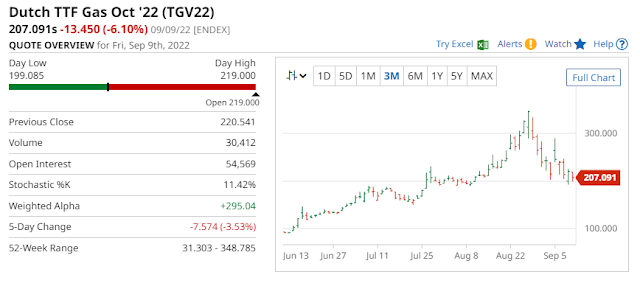
NY Times, the Russians are buying artillery shells and rockets from North Korea, which is a sign that Russian industrial production is breaking down because of sanctions. Moscow announced that it was fully cutting off Nord Stream 1 gas flow to the EU. The market responded with a brief price spike, followed by renewed losses after a peak in late August.
If you had asked a European economist six months ago about their worst-case scenario, it would have a Russian gas embargo and recession. We are there. The Kiel Institute is forecasting German GDP growth at 1.4% for 2022, -0.7% for 2023, and 1.7% for 2024. Is this as bad as it gets? The best part is that the market has stopped responding to bad news.
The Nord Stream 1 cut-off now looks more like an act of desperation. It’s a sign that Putin is losing leverage over the EU.
Andreas Steno Larsen pointed out that Russia will find it very difficult to pivot its gas sales to Asia because of a lack of pipeline capacity.
To be sure, European industrial production has cratered, but the USD price performance of commodity chemical giants BASF and Dow Chemical is revealing. The two stocks had tracked each other closely until the Russian invasion in February when BASF skidded against DOW. Even with all the bad news, BASF may be bottoming on a relative basis and it is starting to turn up (bottom panel).
In short, the market is becoming immune to bad news. If and when the war is over, energy prices will fall and risk assets will rip. I suggested in the past that investors should monitor the performance of European equities on a FIFO basis (see
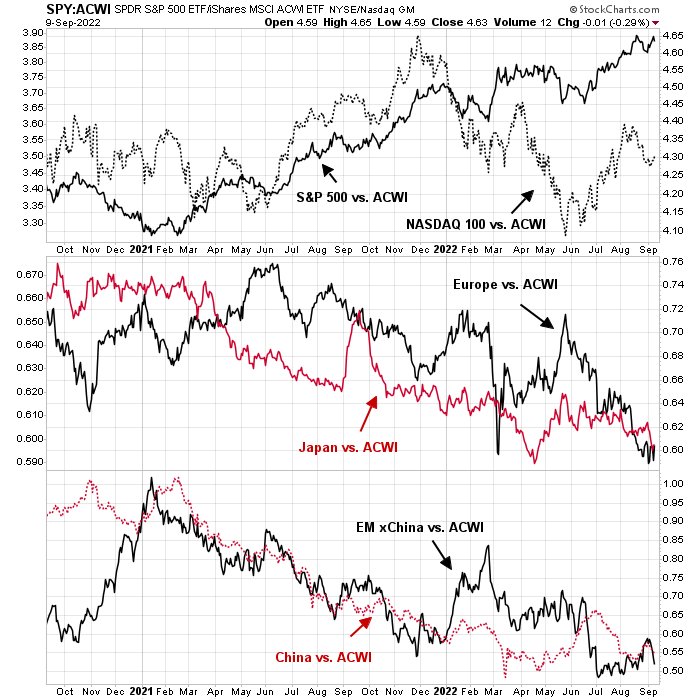
Will Europe drag us into a global recession?). A review of global regional relative performance shows that US equity markets remain the leaders, Europe continues to lag, and other markets are flat against global equity markets.
If and when European stocks begins to bottom on a relative basis, that could be the risk-on signal for global equities. Also, keep an eye on the role of Turkey in the war. Erdogan is facing an election on April and 80% inflation, he has strong incentives to try and negotiate peace.
Squaring the circle
In conclusion, Michael Burry’s wildly bearish projection of S&P 1900 seems implausible. However, the S&P 500 faces strong valuation and macro headwinds in the near future. On the other hand, conventional technical analysis view calls for market weakness and a bottom during the September-October time frame.
While S&P 500 valuations are still slightly challenging, they can be described as being at fair value or slightly overvalued. Stock prices could still rise based on positive macro developments. The bullish catalyst could emanate from Europe, as the authorities unleash a fiscal impulse to counteract its recession and possible financial crisis. The new UK Prime Minister Liz Truss announced a price cap on household energy bills, though protection for businesses will be more limited. Other European capitals will undoubtedly follow suit with similar protection schemes in the near future.
An “energy price guarantee” will limit average annual household bills to £2,500 over the next two years. The price guarantee will apply to the unit cost of energy so the amount any household pays will vary depending on how much gas and electricity they use.
The UK fuel subsidy of is estimated to be in the order of £170 billion, which roughly equals the annual NHS budget and over 5% of GDP. The scale of the fiscal intervention is reminiscent of the shock-and-awe response to the COVID Crash. In addition, the stabilization and recovery of BASF against Dow Chemical is a sign that European markets may be bottoming.
Here is how I square the circle between the fundamental and macro challenge to US equity prices and the more sanguine outlook by technical analysts. The market will undergo the ultimate litmus test in the coming days.
Take the 1962 experience as an example. The stock market topped out in early 1962 and crashed in the so-called Kennedy Slide. The Cuban Missile Crisis followed after a brief market recovery, but the market never undercut its lows despite the fears of total nuclear annihilation. While I am in no way suggesting that the world is headed towards a nuclear war, this 1962 experience is an example of how the markets bottomed (such as it did in June of this year), staged a relief rally, and, according to many chartists, weaken to possibly re-test its lows. If the lows hold, it could be the sign that a new bull has begun, with the probable catalyst of a resolution of Europe’s recession.


Even if the economy doesn’t fall into recession we are still in a quantitative tightening monetary cicle, so I expect new lows to come. If Michael Burry is shorting the market, his comments should be disregarded. I suspect many high profile “analysts” publish on their own interest, not ours
The Jackson Hole paper on QT concluded that QT isn’t the symmetric opposite of QE. Here is a better explanation of that paper from Marketwatch
https://www.marketwatch.com/story/shrinking-the-feds-balance-sheet-sheet-is-not-likely-to-be-a-benign-process-new-jackson-hole-study-warns-11661624887
I suppose we get another look at inflation (CPI) on 13th September. This may be another much needed data point.
Cam
Your second to last graph (top part) is very interesting. Despite NQ underperformance, S&P 500 did not pull back proportionately. This indicates, other sectors of the S&P 500 taking the lead. One could posit the other sectors to be value sectors. Avoiding tech was what saved my personal portfolio from big losses. Some of this was based on Ken’s missives.
Ken, would you like to share your insights on EWC? One would have thought it would have done very well in the past year or so, but has done nothing. Thanks.
Value sectors here. An uneven recovery
https://stockcharts.com/h-sc/ui?s=XLF:SPY&p=D&yr=2&mn=0&dy=0&id=p88047846945&a=948824749&listNum=1
Canada led the developed world markets until May and then has fallen badly with commodity prices and high interest rates hurting housing. I am not a bull on Canada.
Canada has also been over-reliant on RE as a source of growth.
https://www.statista.com/statistics/594293/gross-domestic-product-of-canada-by-industry-monthly/
For over a decade Toronto and Vancouver real estate have become financialized where locals can’t afford to buy. Once rates started to rise, it’s no surprise that the Canadian economic outlook soured.
Given Canada’s reliance on RE it is puzzling to me that goeasy (GSY), an alternative financial services company targeting non-prime borrowers, might have bottomed….. despite the home values have dropped a lot in the months of July and August.
Cam’s assumption or for that matter Mike Wilson’s (Morgan Stanley) valuation on what should or not happen as far as the downside risk is concerned is based on historical precedents. I think it is important to consider that markets happen to over shoot dramatically or for that matter behave irrationally. If that did not happen we would not have seen the extreme over valuation in the tech stocks in 2000 and oil going down to zero. Therefore, the best way is to keep an open mind and not be surprised when something like the unexpected happens. It is quite possible Mike Burry can be right.
What we now know is that market is in a down trend. Trend persists. Oi is up, dollar is up and Bonds are in a downtrend. To guess when the trend will change is just a conjecture.
I think Burry “could” be right.
First of all, one of the things that bugs me is when data which is not long term enough is used. For example the average forward PE based on the last 10 years is from one of the greatest bull markets in history. Now maybe these times are different, but I was always told that’s a bad phrase…I admit we are in a different phase of an economic superpower that seems to be in decline, so maybe times are different. Maybe debasement of fiat will be the secular tune until things really break, in which case the market goes up like it did in Weimar Germany because cash loses it’s meaning, but I don’t expect that to happen.
If you look at the SPY from the bottom in 09 to the top in 21, the 61.8 retracement is 222, so S&P at around 2220..wasn’t that near the bottom of the 2020 covid crash? The 78.6 retracement is at 153.4 which is close to the tops of 2000 and 2007, both of which are support lines on a large scale chart, so from a technical looking at a large bear market, 1900 is not crazy.
Bob Veres, isn’t he a big proponent of “mean reversion”? If true, earnings can compress big time, which means the PE while static at say 14 , if E drops 50% then P drops 50%.
We believe what we want to believe, even psychotics because their hallucinations are perceived as real. So if someone says the Fed caused all these bubbles with super cheap money, we believe it, but is it true? If you believe cheap money, or cheaper money causes a bubble, then what does more expensive money cause?
Are homebuilders happy these days? Higher rates I expect to cut back on sales, and refis for all those using home equity as a piggy bank. Did stimi-checks cause a forward consumption which will be followed by decreased because who needs 2 toaster ovens?
The data is lagged, so I expect the Fed to keep raising rates until the recession is evident for all to see, we may even have deflation then and the Fed will be wanting inflation back which would honestly be a Lehman moment for the Fed.
But it all depends on where the money goes, maybe it will rush back in and the S&P goes to new highs if it seems a Fed pivot is imminent and there is a large short interest.
Keep an eye on homebuilder ETFs and stocks…LEN for example was down prior to the Dotcom bust and the GFC, if they stay weak then be cautious.
Just my opinion, and the part about only a 10 year PE was not directed at you Cam, we see this stuff all the time. If we accept that the Fed has been accommodating ever since Greenspan, then unless the Fed continues to do this, data from this time frame is suspect. Of course if it does, then data from earlier periods is suspect and Hussman will be wrong because older metrics are no good.
I don’t trust investment product sellers like banks and others during bear markets. I prefer independent thought leaders like Burry, El-Erien or Summers. They speak their truth.
and Cam…it’s why I subscribe
The first 6 months of 2022 was an extraordinary 6 months for short selling, but as in any bear market, there is the right time and there is the wrong time and it doesn’t have to be seasonality. Speaking of short sellers and not Burry in particular, this pair of investors put it best:
Mr. Munger: We don’t like trading agony for money
Mr. Buffett: But we wish you well!
Speaking of success of another short seller, Mr. Munger responded, “He had so much success that he stopped doing it,” getting big laughs from the audience.
Thank you all! Excellent analysis
For now I continue to believe that last week may have been an important one for Europe at least, as the market did not break down in response to the pipeline cutoff. Nothing suggests that Europe could outperform here on a relative basis, but a tailwind for US stocks may be the Dollar weakness that suddenly emerged after the ECB meeting and remarks by the BoJ signaling possible intervention in the currency market. The Nasdaq had an outside week and last time we saw this it lead to further gains, at least for 2-3 weeks. Seeing ~132000 as a possible target zone for the NDX, but who knows.
If the dollar weakness continues gold, gold shares and Brazil would be attractive opportunities to trade from the long side. All these have an inverse relation to the dollar.
To your point Dax did not break when it could have easily by making a lower low.
Is it possible for the market to bottom before we see a prospective end to the rate tightening cycle which probably won’t be until early next year ?
A large component of inflation appears to be the structural imbalance between supply and demand resulting in wages currently increasing by about 5-6% p.a. according to the “Wage Growth Tracker Plot” given by Cam in an earlier post. It is hard to see inflation being “under control” until wages are under control which presumably will take some time.
If Powell says “there will be pain” how can we not expect them to raise interest rates to the point where the economy goes into recession?
Here is the message from the Fed: “We will raise rates to around 4% (not sure whether it’s just above 4% to just below 4%) and keep it there while we evaluate the effects. Expect rates to stay there for most, if not all, of 2023”.
Is that pain?
I don’t have the data but if the rates remain elevated for the entire 2023, there could be a significant number of companies that won’t be able to refinance their debt at palatable rates and still survive over the coming years.
I have no clue whether that would make a notable impact on the entire economy.
Good question Cam. Leverage isn’t at 2008 levels. Can debt be rolled over successfully? I guess I’d have to say it’s not full “walking dead” out there but we may find there are some unexpected zombies lurking.
US corporate and household balance sheets are ok. The leverage can be seen outside the US.
See the latest financial strains in Europe and China.