Mid-week market update: I suggested on the weekend that the stock market was oversold and poised for a short-term rally (see How to trade the failed breadth thrust). The rally seems to have arrived.
The weakness in the S&P 500 has been stunning as it sliced through multiple levels of support like a hot knife through butter. The decline was halted at the last remaining support was the 61.8% Fibonacci retracement level, which also coincided with a volume support zone.

Saved by Fibonacci! The logical initial upside resistance is the 50 dma at 4020 on the S&P 500, or 401.25 on SPY.
Positive divergences
The relief rally was bound to happen. The market was extremely oversold and a number of positive divergences had begun to appear. None of the divergences, by themselves, were strong reasons for the market to rally. Taken together, it was enough for stock prices to bounce.
Consider, as an example, that stocks had been inversely correlated with oil price for most of this year. Oil prices have fallen and a yawning gap is appearing between WTI oil and the S&P 500.

Credit market risk appetite is also perking up. The price of junk bonds against duration-adjusted Treasuries (green line) and leveraged loans (dotted red line) are exhibiting positive divergences (with the caveat that the Fed won’t be overly pleased if credit conditions continue to ease).

Equity risk appetite factors are also starting to look constructive. While the high beta to low volatility ratio has followed the S&P 500 (dotted red line), the equal-weighted consumer discretionary to staples ratio (black line) bottomed during the latest stock market downdraft.

Lastly, the usually reliable S&P 500 Intermediate-Term Breadth Momentum Oscillator (ITBM) flashed a sell signal when its 14-day RSI recycled from overbought to neutral. The RSI signal has now reached 20, which is also a fairly reliable “take profits” signal (top panel). In addition, the NYSE McClellan Oscillator (NYMO) reached -100, which is an oversold extreme (bottom panel).

Intermediate term bearish
Make no mistake, any relief rally should be sold. As I pointed out on the weekend (see How to trade the failed breadth thrust), “there were nine NYMO extreme oversold episodes in the last 10 years. Eight of the nine resolved in further declines after bounces.”
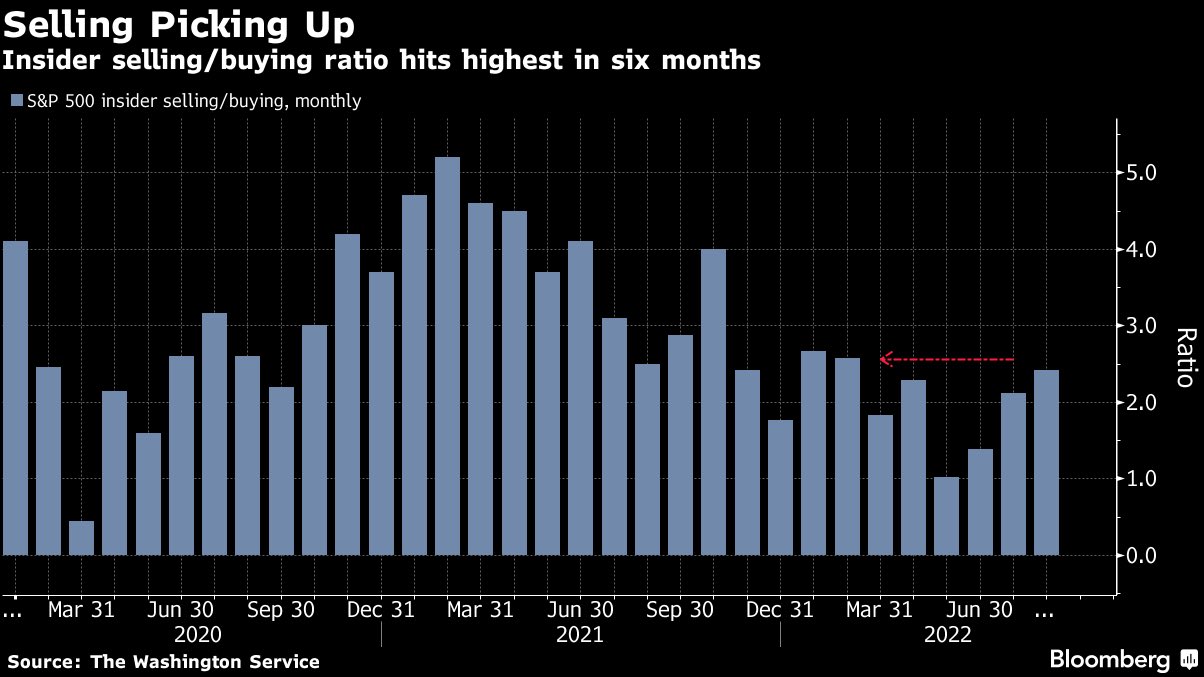
Here are some reasons for concern. I had been watching for insiders to start buying as the market weakened. Instead, they were selling the latest rally.
Sentiment isn’t panicked enough to signal a bottom yet. The 10 dma of the CBOE put/call ratio has been rising, but levels are not elevated enough to signal a capitulation bottom.

Finally, Helene Meisler published a column yesterday which concluded, “Expect an oversold rally to develop this coming week, but the intermediate-term indicators say after that we should come down again”. I agree 100%.
In the near term, the calendar has been filled with investor conferences after the Labor Day weekend. In particular, keep an eye on any guidance from large-cap tech companies that may move the market, in addition to the Apple iPhone event. The market may either rally or tank, depending on the tone from management in the coming days.

Update: A relative upbeat tone from TSMC
https://twitter.com/dnystedt/status/1567699554660937729
If you are a student of the markets, and you should be if you are on this site, you should go back and look at the pandemic inflation trades of the last century, from 1915 to 1920 and compare them to that currently. Those data are free and although not up to the standards of today, they offer a glimpse into what can happen to the stock markets when inflation ran rampant and then reversed – the result is +95% return in 8 trades in those 5 years for those who observed the markets. The same principle applied throughout the last 100 years and it worked like clockwork in the recent trades of the pandemic of 2020.
67 Sell Short 2/1/2020
Buy to Cover 4/1/2020 +25.04%
68 Buy 4/1/2020
Sell 1/30/2021 +41.58%
The Fed and the markets are bound by the rules of the pandemic and inflation and not the other way around. If everyone tells you they are bearish, be aware of the rules that have worked for more than a century and perhaps for as long as markets have existed.
BLS.gov CPI release for August 2022 Sep. 13, 2022 08:30 AM.
Inflation trade for 1915 to 1920
https://i.imgur.com/2c5exIR.png
Be aware as SPX run up to resistance at 4063 (prior week high), up about 160 points in a little over 2 sessions, that this is partly due to traders front running the expectation of lower CPI and CPI coming in below its 6 month MA for the first time since April – May of 2020 which is a significant event in the rule of inflation. Go back and study the price action when the CPI April 2020 numbers were released in May 12, 2020 and one will see the likely price movement. Traders buy the rumor or expectation and sell the news – SPX could see a pull back next week to the 4000 to 3985 level by options expiration Friday 09/16/22 before rallying for 15 to 20 trading days; in May 15, 2020 to June 9, 2020 the rally brought +16% return before any pull back. There is however, no certainty of a pull back to 4000 but given the size of the options hedging against SPX, a return to 4000 is more likely before any monthly options reset.
Headline CPI is expected to come in at 8.2% according to BoA global research.
https://twitter.com/SethCL/status/1568195909032239105/photo/1
This free live chart from tradingview is still up showing SPX and headline CPI from BLS which should update next Tuesday 8:30 AM. The expected August CPI is 8.2%, -0.3% from July, making CPI crossing under its 6 month moving average for the first time since April of 2020.
https://www.tradingview.com/chart/iBqgb4AS/
Perhaps no one else is seeing this, but some market breadth models on the ES futures daily chart has flipped to the long side (this breadth index is the NYSE issues above 50 Day MA), buying SPX ES futures at 4026.25 at close. Today is futures contract roll over so that futures is higher over cash SPX which closed at 4006.18. 4026.25 seems like a high price to pay but the market keeps going up. Cash price will usually follow with this breadth thrust with more resistance at 4068.63. It is likely we will see more resistance level fall and SPX rise over the next week. Options expiration is on Friday the 16th.
https://i.imgur.com/1Aah50o.png
‘Perhaps no one else is seeing this’… Of course that is a silly statement to make. Obviously there are many models that is seeing this just like there were many traders who saw the Fibo 61.8%. If no one trades Fibo then price will not follow those retracement levels. This is one reason technical analysis work since traders learn from price history and those who came before them.
Hello Alex, thanks for posting those comments, I may not be able to provide much feedback, but I am always an interested reader.
Sure thing. I am trying to reason out the markets as much as the next person. There is usually a reason for a developing trend and it better to understand why than just blindly punch a key to trade.