Preface: Explaining our market timing models
We maintain several market timing models, each with differing time horizons. The “
Ultimate Market Timing Model” is a long-term market timing model based on the research outlined in our post,
Building the ultimate market timing model. This model tends to generate only a handful of signals each decade.
The
Trend Asset Allocation Model is an asset allocation model that applies trend-following principles based on the inputs of global stock and commodity prices. This model has a shorter time horizon and tends to turn over about 4-6 times a year. The performance and full details of a model portfolio based on the out-of-sample signals of the Trend Model can be found
here.
My inner trader uses a
trading model, which is a blend of price momentum (is the Trend Model becoming more bullish, or bearish?) and overbought/oversold extremes (don’t buy if the trend is overbought, and vice versa). Subscribers receive real-time alerts of model changes, and a hypothetical trading record of the email alerts is updated weekly
here. The hypothetical trading record of the trading model of the real-time alerts that began in March 2016 is shown below.
The latest signals of each model are as follows:
- Ultimate market timing model: Sell equities
- Trend Model signal: Neutral
- Trading model: Neutral
Update schedule: I generally update model readings on my site on weekends and tweet mid-week observations at @humblestudent. Subscribers receive real-time alerts of trading model changes, and a hypothetical trading record of those email alerts is shown here.
Subscribers can access the latest signal in real time here.
Faltering momentum
Technical analysts recently became excited when the percentage of S&P 500 stocks above their 50 dma surged from below 5% at the June low to over 90% in mid-August. In the past, such strong price momentum has always signaled the start of a new equity bull.

Since then, the S&P 500 fizzled at its 200 dma. Markets further took a risk-off tone when the Fed and other central bankers signaled their determination to raise interest rates and warned about pain ahead. The reversal has been so dramatic that the percentage of S&P 500 stocks above their 20 dma has retreated to under 10%.
If it’s any consolation, the intermediate technical outlook is still bullish for equities.
Buy signal still intact
Rob Hanna at
Quantifiable Edges studied the history of failed breadth thrusts. He found that historical returns are strong even in cases when the market suffered an initial drop.
Jason Goepfert at
SentimenTrader studied historical analogs to the recent breadth thrust market action and concluded:
- The 50-day rally off the June low is comparable to other long-term bottoms.
- A price analog shows that the highest-correlated 50-day patterns all showed one-year gains.
- Shorter-term returns were inconsistent, with several giving back most or all of the initial rally.
- The highest-correlated rallies tended to peak where we did now but showed long-term gains.
Lessons from market history
Some lessons from market history are revealing. A study of past market bottoms since 2000 shows that recovery from a breadth wipeout (bottom panel), as measured by the percentage of S&P 500 stocks above their 50 dma rising from below 5% to over 90%, has always been bullish. Other market bottoms have been characterized by low-quality rallies, a rebound in the cyclically sensitive copper/gold ratio, and strength in the consumer discretionary to consumer staples ratio as an indicator of risk appetite. In addition to the recent breadth thrust, all three of those factors are confirming the latest bullish impulse.

What about the Fed? A key risk to the bull case is the Fed’s “whatever it takes” determination to bring inflation back to its 2% target. A study of the Zweig Breadth Thrust tells the story of the interaction of breadth thrusts and Fed policy. There have been only six ZBT buy signals since Marty Zweig wrote about his model in 1986. The market has been higher a year later in all instances. In two cases, the market chopped around and re-tested its lows during periods when the Fed was raising rates. While it’s difficult to make any definitive forecasts based a study where n=2, the re-tests occurred 2-4 months after the initial ZBT buy signal.
Fast forward to 2022, the 30-year long Treasury bond could be giving investors a message. In the past, the peak in the long 30-year Treasury yield has been either coincident or slightly led the peak in the Fed Funds rate. The long bond yield appears to be trying to top out. Past episodes have tended to be bullish for risk assets such as equities.
Former Fed economist
Claudia Sahm outlined how inflation could resolve itself in a relatively benign manner. Economic weakness in Europe and China helps the US to bring down inflation.
Who benefits from Europe going into recession? We do. The United States, as the largest economy in the world, the largest producer of oil and natural gas, and with one of the strongest recoveries, should be able to weather the storm in Europe. Their hardship will sharply lower their demand and help bring our inflation down.
She added:
Yes, the lockdowns and production stoppages in China will reduce the available goods for us to buy. But remember, inflation comes down with more supply and/or less demand. We are not the only ones who buy electronics and cars. If demand in the European Union, the second-largest economy, China, third-largest, and others, slows dramatically, that’s less competition for goods and less inflation for us.
USD strength is importing disinflation and exporting inflation to America’s trading partners.
The stronger dollar pushes down our inflation. Imports are cheaper now for us from basically everywhere. Usually, the “pass-through” of import prices to the overall CPI is considered small. But import prices are falling markedly—both with the stronger dollar and easing supply chain disruptions—and will show up to some degree. Moreover, new research from the New York Fed by Mary Amiti, Sebastian Heise, Fatih Karahan, and Ayşegül Şahin suggests that the import price “pass-through” in the United States has been larger since the pandemic began.
Short-term pain ahead
Tactically, equity bulls are likely to face further pain. The market is very oversold, but fear levels are inconsistent with major market bottoms.
The NYSE and NASDAQ McClellan Oscillators (NYMO and NAMO) are exhibiting deep oversold readings, which could see the market bounce, but any rally is unlikely to be unsustainable.
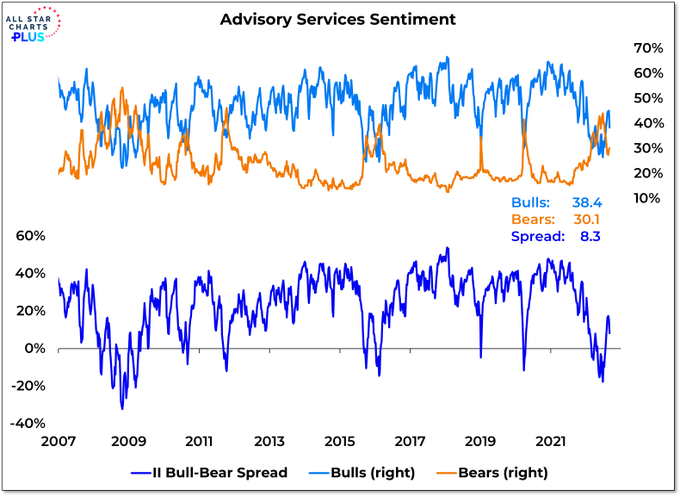
That’s because sentiment indicators did not reach washout and capitulation levels. Investors Intelligence sentiment has recovered from a crowded short condition and readings are only mildly bearish.
A 10-year history of the CBOE put/call ratio and equity put/call ratio shows a pattern of slowly rising put/call ratios until readings reach a crescendo. I conclude from this that the market needs to either re-test or stage a near re-test of the June lows.
The term structure of the VIX isn’t even inverted, which would be an indication of panic.
The VIX Index appears to be exhibiting a 50-day cycle, and the projected peak for the VIX is above 34 on September 20, 2022, which coincidentally is one day before the next FOMC meeting. Stay tuned.
To underscore my point about the unsustainability of a bounce, here are all the instances in the past 10 years when NYMO became as oversold as it did recently.
There were four cases during the 2012-2013 period. None of them exhibited extreme fear as measured by the inversion of the VIX curve. All relief rallies resolved with lower lows soon afterwards.
There was one instance of an oversold NYMO in 2015. The VIX curve inverted. The market staged a relief rally but came back to re-test the old low.
There were four episodes during the 2018-2020 period. The VIX curve inverted in all cases, indicating panic. Only the Christmas Eve Panic of 2018 resolved in a V-shape bottom. All others, including the COVID Crash, saw the market decline soon after a rally.
In summary, there were nine NYMO extreme oversold episodes in the last 10 years. Eight of the nine resolved in further declines after bounces.
In conclusion, the bullish implications of the breadth thrust are still alive. If history is any guide, stock prices should be higher by next summer after some short-term sloppiness. The key risk to this forecast is the Fed will continue to tighten into a recession and deliberately tank stock prices to fight inflation.


This week saw a rare occurrence, the CCC junk bond spread blew out 1.28% in a single day. Checking back, this has happened only six times this century and the forward drawdown was a minimum of 10% and most were in the 20% or greater negative range. Things are getting broken in the junk area. This is bear market behavior.
This week all my internal factor dynamics turned negative for all the industry GICS, S&P 900, S&P 600 small cap, the Toronto stock market, Europe and Japan. Some had clawed their way back to positive but now are solidly in Winter mode.
Of the four factors, Growth, Value, Low Volatilty the Small Cap index was not falling into line for a normal Factor Cycle rotation. The economically sensitive Value and Small Cap indexes always led us down to the eventual recessionary bear market low. The Small Cap was amazingly strong but this week it started falling badly and has joined Value as the worst two performers among the four factors. I expect an ugly race now to the bottom. Please don’t ask me if I own the Russell 2000 December puts. I can’t tell you.
In my Leading Edge Momentum, industrial commodity mining stocks fell off a cliff. They had been leaders along with energy. This could mean a sudden chill in the global economy due to Russia cutting off natural gas to Europe, the Covid shutdown in China of a giant new city and a global bust in home prices and their construction. The severe drop in the mines ETFs jives with the economic news.
Occasionally, we should remind ourselves that the current global situation is unprecedented and therefor we should not take direction from theories that rely on precedence, however uncomfortable that newness makes us feel. Central Banks aggressively tightening into a global recession and saying they will keep both feet on the brake pedal, is unique and very dangerous for stocks.
That is one thing I have wondered about, what happens to these zombie companies who will need to roll their debt if rates are still high?
$$HYIOAS is going back up, JNK going down…neither extremes for this year but getting there.
Perhaps inflation receding and something breaking will happen at the same time and then we get a pivot.
Different methods, different words but there is a lot in common with Jeremy Grantham in this outlook.
Mr. Grantham has been predicting a crash for at least a decade.
Mark Hulbert is drawing parallels to the depression post last pandemic in early 20th century.
Historical analogs only show the possibility of something happening because it happened before. What about the context of a different economic world order? Technological advances? Fed that can pivot and influence the course of world economy?
I believe that there is shorter term pain ahead but the idea of bursting of a ‘bubble’ (whatever that means) that destroys the world economy is far fetched.
You have 2 “uns” unlikely to be unsustainable, I’m assuming you only want one, when talking about a rally, or am I missing something?
Fundamentals are not nice, but maybe what lies under this is a money bubble which isn’t done yet and if inflation abates, they will get back into monetizing debt, which they will do until they can’t, but if all the major economies print and print, who will stop them?
Miners, eg copper with large reserves which should appreciate as debt gets monetized, but the money spent developing them is old money and the newer cost would be nominally much higher..only when?
One of Bill Cara’s favorite mining/resource companies in the years leading up to the GFC was TECK. There were die-hard Caraistas buying the stock as it went on sale in mid-2008 – unaware the stock price would ultimately plunge -95%. Two years later, of course, the stock price would subsequently parabolically rise 17-fold to new highs.
Those who get it right can mint fortunes.
Speaking of the GFC, will index multiples reach single digits again in my lifetime? No doubt. We just don’t know when it will occur or how it will happen ahead of time. But it’s prudent to always expect the unexpected. We don’t have to trade stocks like TECK to make fortunes. We can simply let index prices come to us. That takes a lot of patience, a lot more honestly than I have. The fact is that we don’t need to participate in the markets at times like this – a state of mind that I’m currently striving to maintain. It’s simpler and easier to wait and see what happens. Cash is a great position when there is no edge.
How much power do central bankers really have? They are no match for the human emotions that drive prices. I distinctly recall the day that C (Citigroup) traded at $1/share – a colleague and I discussed buying a thousand shares each over lunch. We didn’t do it. We had little confidence the company would survive – so many other financial institutions had already bit the dust. The Fed is able to influence demand only up to a certain point – short of a price guarantee, they have little power over asset prices when panicked investors want out at any cost.
Now we have the unprecedented (as far as I know) situation where the Fed has explicitly communicated a desire for lower stock prices. Apparently few traders believed it until they spelled it out.
What’s the right stance here? Cash may seem uninspired, but hey – it beats losing money. If you have to do something, buy a CD or maybe a few Euros to spend on your next trip overseas.
Gustavo Arnal. The first thought that came to mind was the Cliff Baxter (Enron) suicide in 2002.
How is bringing demand and supply into alignment, i.e. reducing demand, different from creating a recession?
I think that Ken’s statement that the “current global situation is unprecedented and therefore we should not take direction from theories that rely on precedence” is very important.
Also I think Cam’s statement where he says “If history is any guide” is very important. A lot of Cam’s technical analysis only derives from the last 20-30 years so it is probably a bit limited in it’s usefulness for this “unprecedented situation”.
Technical analysis is all about “pattern recognition” as a “short-cut” way of modelling a lot of underlying forces that are too difficult to model from first principles. Therefore if we are in a similar economic environment to the past then the pattern from the past should be informative. But this situation is fairly unprecedented so we should be careful using intermediate term technical analysis as a guide.
We need to go back to the 70’s or early 20’s to get something similar. In this respect I thought that the historical analogs from Nautilus Research in Cam’s “ Six Reasons why this was a bear market rally “ were interesting. By eye I thought that the Bear market ones fitted better, especially with the more recent data. It just so happens that one of these was from 1973 also.
So if Technical Analysis is a bit limited in it’s usefulness then maybe a bit of fundamental analysis is useful at least in a qualitative sense. I would summarize this as follows;
As we know this is a Fed induced Bear market caused by the need to fight inflation with high interest rates. Therefore we are probably waiting for a Powell doveish pivot to signal the “coast is clear”.
When will this be? As a minimum Powell tells us that “Restoring price stability will take some time “ , i.e. it will probably take longer than just a couple of months. Next he tells us “ higher interest rates, slower growth, and softer labor market conditions will bring down inflation”. Therefore we need to see “ slower growth, and softer labor market conditions” before he will be happy. Maybe growth is slowing a little but the labor market is still very tight so we have to wait for these conditions first.
What are the major cause of this inflation?
a) Higher Energy costs. This has slowed a bit but they are still high and maybe getting worse with the gas pipeline being shut-off by Putin. Also just because they aren’t increasing doesn’t mean that they aren’t still working their way through the economy.
b) Supply chain disruptions. Things have improved a bit but we are still are there yet. For example I believe that new car delivery times are still quite long.
c) Increased money supply (& demand). M2 money supply has increased a lot since the pandemic and I think there is still a lot of unspent savings out there.
d) Most importantly, low unemployment ( a tight labor market) is still with us. In simple terms this is the Phillips curve coming into play. The logic is simple, while there is a tight labor market this will drive wages and in turn prices up. Maybe the labor market will still get tighter in the coming months as (I think) participation rates are now approaching pre-pandemic levels so there are not so many excess workers out there anymore. Therefore we need to wait for wage increases to slow down which hasn’t happened yet.
Also what is different this time is that we seem to have lots of structural, pandemic related changes going on in the workforce that are causing a shortage of workers. E.g. early retirement of workers put off during the pandemic.
Now I assume that the Fed has detailed quantitative models for all this so this is presumably behind their hawkish warnings to us so we should take notice, (though I guess the assumptions used last year were a bit off).
Also I think a really important observation by Cam (in an earlier post, ” Six Reasons why this was a bear market rally”) here was “Even if we use the most optimistic assumptions by substituting core CPI for headline CPI and assume that the transitory nature of goods inflation subsides, core CPI is likely to decelerate to only about 4% by early 2023. But sticky price CPI is stubbornly high and accelerating. This indicates that the Fed Funds rate will continue to rise to 4% or more before the Fed is done, which is well above current market expectations.” This indicates that the “doveish pivot” won’t be at least till the end of the year (as Ken predicts)”
By the way as a final point I find the twisted logic of Former Fed economist Claudia Sahm saying that a world wide recession was good for the US as “interesting”. Surely a slowing world economy is not good for the US !
The whipsaw action we have seen the last few trading days (down 1%, up 1%, sometimes intraday reversals) is a specific price pattern that has marked bear market rallies, recurring at least 8 times this year, as shown with the yellow lower dots in this E-mini SPX chart. Such patterns usually lead to further gains in the next 5 trading days (7 of 8 trades) with a total return of 10.74% vs -13% buy and hold over the last 11 months.
Five trading days will take the markets to the BLS CPI release next Tuesday on Sep. 13, 2022 08:30 AM which could potentially see a further drop in CPI below its 6 month MA which has traditionally been a bullish signal going back even before the existence of the Federal Reserve. Ultimately it is the inflation rate that the effective Fed fund rate is dependent on and that is what is driving the markets.
https://i.imgur.com/70RFH8c.png
Potentially important message from yesterday is that the trendline connecting the lows from June and July on the daily chart held so far. Germany’s DAX saw a similar behaviour on Monday and started Tuesday with a 140 points rally within the first 30 minutes. Probably all depends on a stabilization in the bond market.
I am watching the dollar, the Bond Market, TSLA and APPL for a sharp counter trend rally.
Oil is down and that might be helping today, also the NY Fed says global supply chain pressures fell in August. I would still be inclined to take profit an any long positions in the ~3975 area because we may still get an ugly reversal after the ECB meeting tomorrow.
The 15 minute chart market breadth model has now flipped to the upside (buy ES at 3926 at 10:30 AM) , resistance at SPX ES 3954. The daily is still showing a short signal with resistance at 4065.
https://i.imgur.com/hh7Co5K.png
Exiting this price pattern trade. Price is coming up to resistance SPX 50 day MA and NDX is lagging. There may be another day to this rally, but as a mechanical traders, one has to backtest what works and 4 or 5 trading days hold from the original signal is suggested by this strategy. With small amount of pyramiding, this strategy shows a consistent gain in a bear market rally.
https://i.imgur.com/BmK3pkG.png
Long a mix of SPY/ VT/ XLF/ KRE/ BABA.
Adding second tranches here.
To be honest, the default expectation right now is that we’re headed lower.
Closing half of my positions here.
No patience here. Taking all remaining positions off here given my default expectation is for further downside.