Preface: Explaining our market timing models
We maintain several market timing models, each with differing time horizons. The “Ultimate Market Timing Model” is a long-term market timing model based on the research outlined in our post, Building the ultimate market timing model. This model tends to generate only a handful of signals each decade.
The Trend Asset Allocation Model is an asset allocation model that applies trend following principles based on the inputs of global stock and commodity prices. This model has a shorter time horizon and tends to turn over about 4-6 times a year. The performance and full details of a model portfolio based on the out-of-sample signals of the Trend Model can be found here.

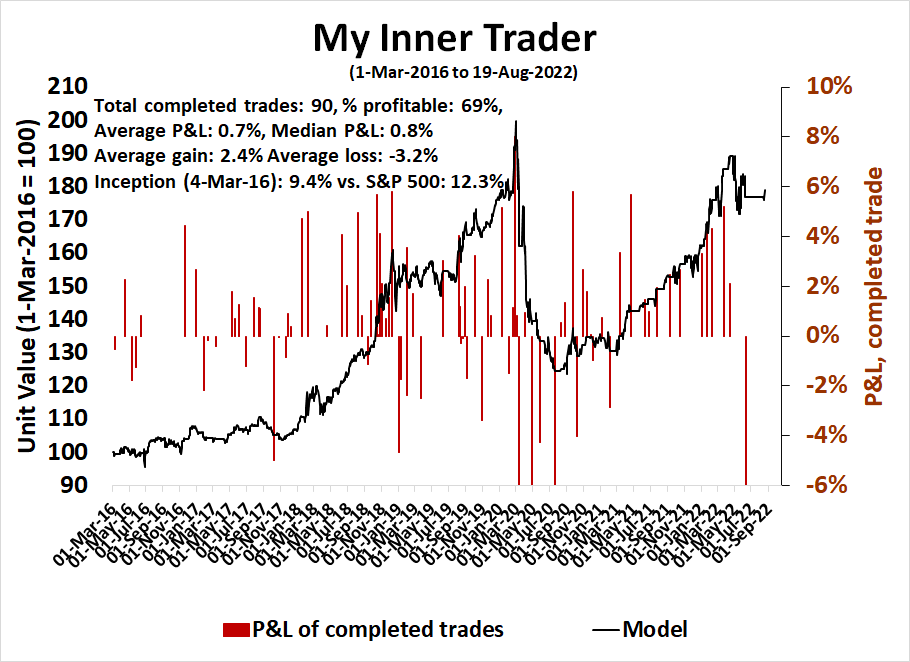
My inner trader uses a trading model, which is a blend of price momentum (is the Trend Model becoming more bullish, or bearish?) and overbought/oversold extremes (don’t buy if the trend is overbought, and vice versa). Subscribers receive real-time alerts of model changes, and a hypothetical trading record of the email alerts is updated weekly here. The hypothetical trading record of the trading model of the real-time alerts that began in March 2016 is shown below.
The latest signals of each model are as follows:
- Ultimate market timing model: Sell equities
- Trend Model signal: Neutral
- Trading model: Bearish
Update schedule: I generally update model readings on my site on weekends and tweet mid-week observations at @humblestudent. Subscribers receive real-time alerts of trading model changes, and a hypothetical trading record of those email alerts is shown here.
Subscribers can access the latest signal in real-time here.
A stall at resistance
The S&P 500 stalled as it approached overhead resistance after recycling from an overbought condition on the weekly chart.

The key question for investors, much like the famous scene of King Arthur’s encounter with the Black Knight in Monty Python’s Holy Grail, “Is this just a flesh wound, or a deeper cut?”

Just a flesh wound
Let’s begin with the bull case. Investors can be excited about the powerful momentum unleashed by the recent breadth thrust. The percentage of stocks above their 50 dma surged from below 5% to over 90%. If history is any guide, such an episode should resolve bullishly.

As a consequence, the S&P 500 Advance-Decline Line made a fresh all-time high. All other versions of A-D Lines are also showing signs of strength.

The bulls will argue that the market may be due for a breather, but any pause is likely to be in the form of sideways consolidation in light of the strong momentum underlying the market.
A deeper cut
However, I would argue that the more likely scenario is a deeper pullback for several reasons.
While I am respectful of the bullish implications of the breadth thrust, the underlying market internals are different compared to the last breadth thrust, which saw the market surge after the COVID Crash of 2020.
Consider the behavior of the relative performance of defensive sectors. Even as the market surged off the June bottom, all of the defensive sectors held relative support, indicating that the bears haven’t fully lost control of the tape. The NYSE McClellan Oscillator (NYMO, top panel) signaled that a period of weakness had begun by recycling off an overbought condition, much like it did in March and June. By contrast, the breadth thrusts in June 2020 saw defensive sectors violate relative support, and a similar violation of relative support occurred when NYMO recycled off an overbought condition in November 2020.
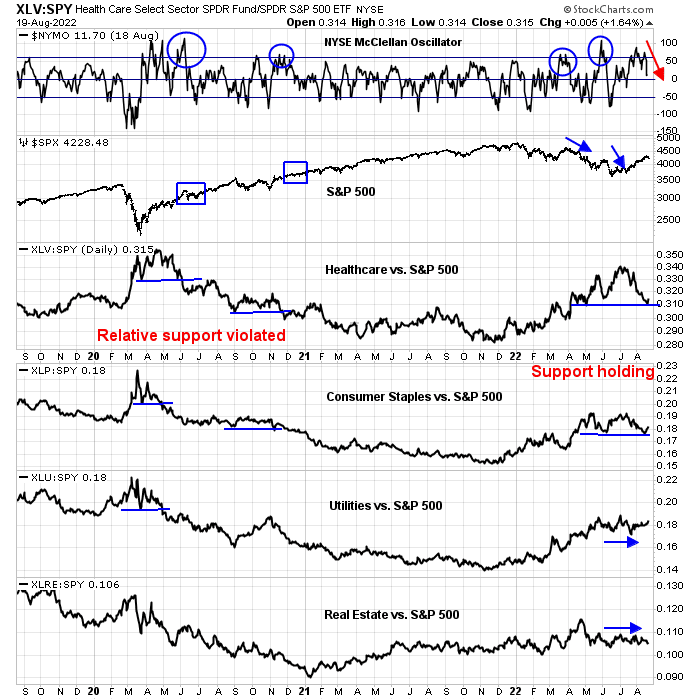
Other indicators are signaling warning signs. Equity risk appetite, as measured by the ratio of equal-weighted consumer discretionary to staples, and high beta to low volatility stocks, is exhibiting negative divergences to the S&P 500.

Semiconductor stocks were rejected at trend line resistance. Moreover, the bottom panel shows that the group weakened through a relative downtrend, which is a signal of cyclical weakness in an important technology industry.

The S&P 500 has been inversely correlated with oil prices this year. So far, the two have moved together.

Andrew Thrasher observed that oil prices also closely track the crack refining spread. As the crack spread widens, this has bullish implications for oil and bearish implications for equities.

One of the global canaries in the equity coal mine are UK stocks. The UK July CPI came in at 10.1%, which is a double-digit level that was last seen when Margaret Thatcher occupied 10 Downing Street. The BOE has vowed to pursue an aggressive hawkish policy and a recession is certain. UK stocks are therefore a useful barometer of global risk appetite. The FTSE 100 is composed of too many global companies and the index also has a strong energy tilt. The performance of the midcap FTSE 250 is more reflective of the British economy, and this index has failed to breach resistance. The bears are still in control of that tape.

A contrarian magazine cover buy signal?
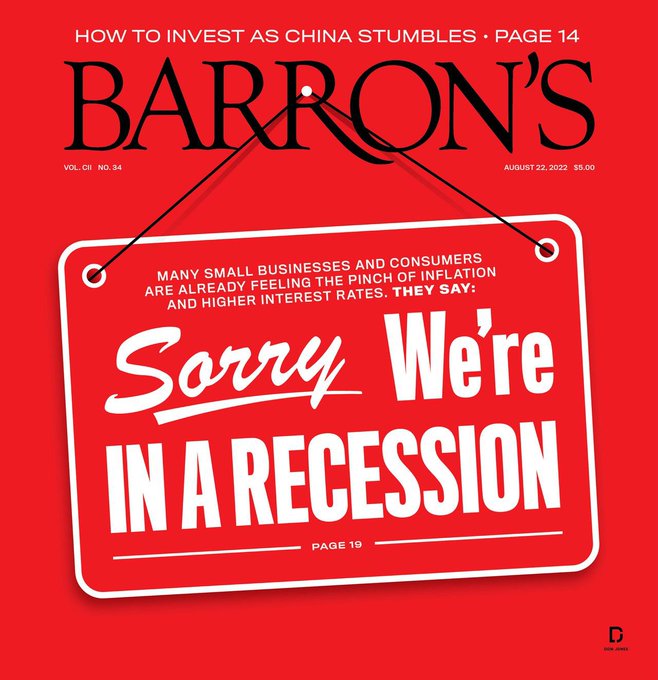
The latest cover of Barron’s could be seized by the bulls as a contrarian magazine cover indicator. The fear of recession has become sufficiently mainstream. It’s time to be buying stocks.
While this is only one data snapshot, a review of order flow from Fidelity customers dispels the notion that investors are fearful of a recession. In the wake of Friday’s -1.3% drop in the S&P 500, retail traders were heavily buying speculative and high-beta favorites, such as Tesla, AMC, Gamestop Amazon, AMD, Nvida, Shopify, and Meta. They were also buying the triple leveraged QQQ and selling the triple leveraged inverse QQQ ETF.

Downside risk
It’s difficult to know in advance the downside risk posed by a pullback, but we can make some educated guesses. Initial support for the S&P 500 can be found at 4160, with further support at the first Fibonacci retracement of 4060, and at the 50% retracement at 3980. Much depends on the newsflow, which is impossible to predict. The Fed’s Jackson Hole symposium, “Reassessing Constraints on the Economy and Policy”, is next week on August 25-27, and it could be a source of volatilty.

In conclusion, the S&P 500 has paused its advance after a breadth thrust, but not all breadth thrusts are the same. While most breadth thrusts have strong bullish implications, a variety of market internals indicates that the pause is likely to resolve in a deeper pullback rather than a more benign sideways consolidation.
Disclosure: Long SPXU
I have the sense that most traders ‘want’ the market to decline here – whether they’re short, underinvested, or simply view the recent rally as somehow asymmetrical (too far too fast) and feel that a pullback is necessary.
So max pain would seem to be a move higher.
In my YouTube surfing I came across Summers, then Powell two years ago, where it was apparent that these two leading lights had not absorbed the teachings of MMT beyond the level of memes. How professional is that?
‘Larry Summers: Modern Monetary Theory is a recipe for a disaster.’
‘Fed Chair Powell Says Concept of MMT Is ‘Just Wrong’.’
Then I came across Summers and Dalio a year ago, discussing the economic outlook and the possibility of inflation, given the levels of liquidity that existed. Well, here we are, and the impression is that an asset bubble has been deflating, and the market is now nearer to where it should be, rather than down, as we all feel.
‘Dalio, Summers on Inflation, Restructuring the Global Economy.’
Transitioning Friday’s trade into a first allocation that will target the SPY gap fill ~412 for a second allocation.
Opening half of the second allocation here. 413-and-change seems close enough.
I’m pretty comfortable being positioned long at SPY 412-413. I may opt to add a third allocation either on further weakness or on unexpected strength as traders digest the news out of Jackson Hole.