Mid-week market update; The S&P 500 has undergone a powerful rally off June’s bottom, but it’s now approaching technical resistance in the form of a 200 dma and a falling trend line. In addition, the market is overbought as measured by the 5 and 14-day RSIs, much in the manner of early November 2021.
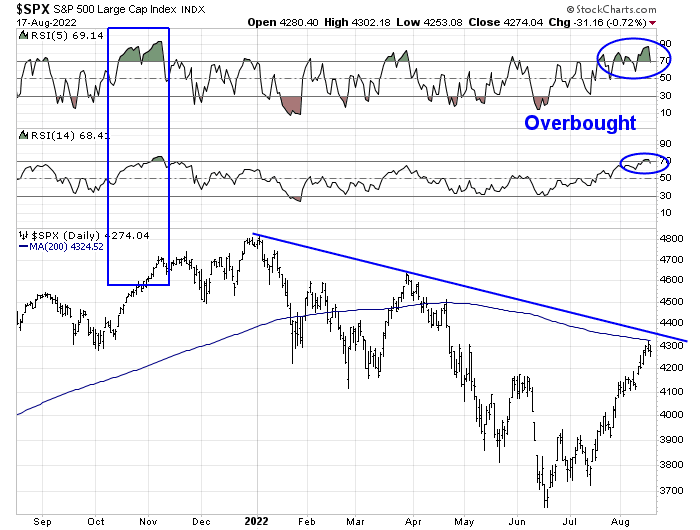
Even if you are intermediate-term bullish, the convergence of these factors argues that it’s time for a tactical pause and possible pullback.
Volatility warning
Last week, I highlighted a market warning and tactical sell signal when the 5-day correlation of the S&P 500 and VVIX, which is the volatility of the VIX, spiked. Historically, this model has shown a strong track record (pink=successful sell signals, grey=unsuccessful signals).

Andrew Thrasher observed a similar effect. When the 14-day correlation between VIX and VVIX fall below zero, which is an indication that the two indices are moving in different directions, the market has more often than not seen volatility spikes.

Further analysis reveals that the VIX Index appears to have a 50-day cycle and volatility may be at the bottom of an inflection point. While cycle analysis can be uncertain and unreliable, the negative correlation of VIX and VVIX further builds the case for a turn in volatility.

Negative seasonality
Speaking of cycles, Jeff Hirsch at Almanac Trader pointed out that seasonality is about to turn negative for the S&P 500.

A FOMO stampede
When the market turned risk-on after June’s bottom, the advance was supported by a sentiment wipeout. The latest BoA Global Fund Manager Survey shows that managers have begun to rebuild their equity positions, albeit from very low levels.

That should be bullish, right? The Fund Manager Survey is an inexact timing tool. The survey showed that managers turned bullish in October 2008, but history shows that the market didn’t bottom out until five months later.

Goldman Sachs Prime Brokerage reported that the current rally stands as the third largest short covering event in the last 10 years.

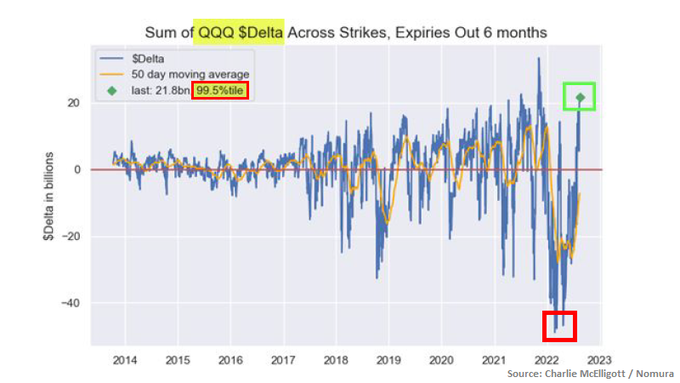
Macro Charts pointed out that the option deltas on QQQ have reversed from a crowded short position to a crowded long position. The fast-money crowd has already engaged in a FOMO buying stampede.
None of this means that the market can’t rise from here. In the short run, however, the market is overdue for a pause and pullback.
Disclosure: Long SPXU
That level is also where the 61.8 retracement is located, so if it turns there the fibbies will point it out.
The Fed is leaving way too much room for speculation – this in itself is a failure in communication. The reaction to the minutes was faded today, this is what usually happens as Fed minutes are usually more like a window into the past. Now we know that the communication error (yes, we can call it that) by the Fed has led to easing financial conditions and this is probably not what they wanted. The market needs to “price out” the idea of rate cuts in early 2023.
I have found in my numerous years of trading that certain obvious levels of price, averages and indicators attract a lot of unsophisticated technicians calling for tops and bottoms. What it does is create a magnet of shorts or longs that is then exploited for one final squeeze. In simple English I won’t be surprised to be see a head fake i.e. one more squeeze up before the fundamentals come into play and stocks roll over.
Everyone is looking for a pullback near 200dma and the trendline. The market will go to price that will fool most of the investors.
I tend to agree with your assessment here.
Agree with what both of you are saying, but the market would have also fooled everyone if it never reaches the trendline, or maybe not in August. I trade Europe as well and as of now we made a lower high today. No, I have no idea, but I believe many bears have also thrown in the towel already.
Hello Cam, I hope this message finds you well! A while back you suggested potentially going long Japan using the ETF JPW. I think this is unhedged?
Would it be more conservative to buy the hedged ETF, DXJ, since the dollar is still bullish against most major foreign currencies, including the yen, in my opinion.
Thanks for your input.
Mike
The media seems focused on lower-than-expected inflation readings, but what if it’s only a temporary reprieve before next month’s higher-than-expected numbers?
It’s pretty much locked in that we’ll have higher readings the next couple of months
https://www.researchaffiliates.com/publications/video/941-insights-into-the-inflation-print?
OK. I don’t think the pullback ends here. Obviously, I’m hoping the pullback doesn’t occur in a straight line, but ultimately we need a retest of the June lows.
Long SPY and TLT for day trades.
OK – maybe two-day trades. Slightly green as we head into the close and neither looking to trim nor add.