Mid-week market update: The markets took on a risk-on tone in the wake of the softer than expected CPI report. It was a useful first step and a possible sign that inflation is peaking, but I am still waiting for the “clear and convincing evidence” that inflation is under control before getting overly excited about the stock market. Managing monetary policy is like steering a supertanker. Changes happen very slowly and market sentiment may be getting ahead of itself.

A constructive CPI report
The good news is all CPI metrics came in below expectations. The bad news is both median CPI and sticky price CPI are above core CPI, indicating persistent inflationary pressures. Fed Chair Jerome Powell has stated that he is looking for “clear and convincing evidence” that inflation is moving towards the Fed’s 2% objective. This was a constructive first step, but hardly “clear and convincing evidence” of deceleration.

As a reminder, the Fed has already penciled in a deceleration in inflation pressures by year-end in its June Summary of Economic Projections (SEP). However, the SEP, which Powell said is still the valid forecast at the last FOMC press conference, has a 3.4% median Fed Funds rate at year-end.

Getting inflation down to the 4% level will be a useful first step, but can inflation fall to the Fed’s 2% target? According to the Atlanta Fed, wage growth is showing signs of acceleration.

Maybe it`s me, but isn`t weird that the markets are giddy over a 8.5% inflation print?
An ambitious market reaction
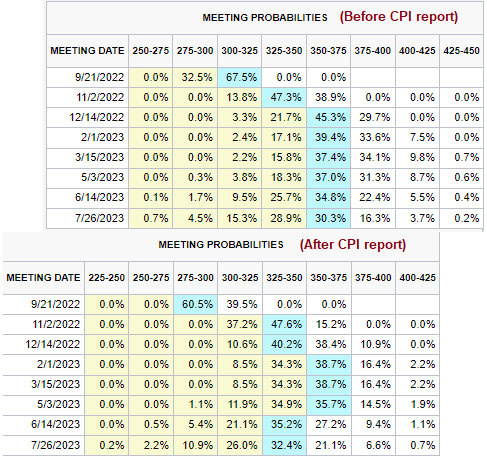
The bond market responded by steepening the Treasury yield curve as short rates fell dramatically, but the long-end response was muted and the 30-year rate marginally rose. Fed Funds futures are now discounting a 50 bps hike at the September meeting (from 75 bps) and rate cuts by next June. Those expectations may be overly ambitious in light of Powell’s “clear and convincing evidence” criteria.
The S&P 500 and Russell 2000 staged upside breakouts through resistance, though the midcap S&P 400 is still testing resistance. However, the VIX Index has fallen below its lower Bollinger Band, which would be a signal of an overbought condition.

Meanwhile, NDR’s Daily Trading Sentiment Composite has moved into a crowded long reading, which is contrarian bearish.

In short, the markets are front-running the Fed and playing with fire. Financial conditions are loosening and not tightening, which is contrary to the Fed’s current intentions. While the consensus may be shifting about the Fed’s actions next year, there is no disagreement that the Fed’s next step is to tighten monetary policy.
When the animal spirits run, it’s unclear how far the markets can advance. Enjoy the party, but this is a rally that should be sold into and not bought.
We will see the PPI report tomorrow. Expect a wild ride in the coming days.
Follow up on Gold Trade
Last Sunday I posted that I thought gold was a good buy. More so, the gold stocks. Following my advise I bought 25K shares of NUGT. I sold it them this morning in the pre – opening at a modest profit when gold did not rally after the CPI report came out. Frankly, I was disappointed with the dollar index down over 1% you would think it would get gold moving . I can post the trade if anybody is interested.
Roosevelt said “Walk softly and carry a big stick.” The Federal Reserve seems to be doing just the opposite. The Market is at the “Show me stage” where liquidity is greater than before. The credibility of the Bank is on line. If it can’t reign in the speculation in the meme stocks I don’t know where this market rally will end.
As a trader I trade with the primary trend and on occasion I have trade the short term rally(qqqs). We are now reaching a stage where the primary trend is coming into question with the strength and viciousness of the way stocks are rising.
Are they any tells? I think so. I am watching the Semi-Conductor index (SMH) and TSLA to see if they make recovery highs in this rally. If not, then I will trade them from the short side.
Sometimes patience is a virtue.
There is something self defeating in what the market is doing. So the CPI coming in lowish is the reason for the market shooting higher? Why? Because if inflation seems to be peaking the pivot is getting closer? I don’t think so because the market going up pushes the pivot further away. The pivot shouldn’t happen if the market is moving higher. Unless something breaks of course, in which case the market should drop hard, so either one does not have a happy outcome for the bulls, unless the market just keeps going up regardless of CPI numbers.
Last summer the CPI numbers were also lower than the rest of the year, so maybe the acid test is in the fall.
‘.. isn`t weird that the markets are giddy over a 8.5% inflation print?’
That’s the thing about the market. It’s irrational, aka weird. Traders who make bets based on maxims such as ‘maximum pain,’ ‘the pain trade,’ ‘who’s more scared – bears or bulls,’ or ‘climbing the wall of worry’ – they are more often than not making the right bet. But it takes guts to make those trades in size – and then easy to second-guess the trades. I have a theory as to why traders like Tudor Jones do so well making those types of bets – they’re usually playing with other people’s money, which gives them the guts to follow through. JMO.
Is it short-covering, or is it the beginning of a multi-day breadth thrust that confirms a new bull?
If it’s all good, why is TLT selling off so hard?
Given that CPI is still far above where it should be, the idea of a Fed pivot or rate cuts in early 2023 is very optimistic. A pause at a higher level should be the more likely outcome.
TLT currently changing hands at the lowest price since July 21.
And that includes the August dividend payment.
The ‘smart money’ index on SPY showing that smart money didn’t really buy into the CPI release rally as it sold off (green SMI) and not able to rise about the smoothing period (orange). May be they are smart money after all (it is just a dumb indicator of accumulation or distribution of first hour and last hour intraday action, usually on a daily chart). This link below is the 2 hour period live chart.
https://www.tradingview.com/chart/inBHJqBl/
Market still held up remarkably well, at least for today. Still holding above the early June highs. KOSPI still 10% below early June, DAX about 1000 points off, NIKKEI failed to get above early June highs, but holding better. This indicates to me that US markets may continue to outperform in the second half of 2022 and cyclicals may underperform vs quality. Some of the weakness in the global economy is just very obvious. I cannot get overly bullish on tech however – tech CEOs that I speak to are telling me that July was flat for them MoM, but YoY revenues are still negative. And as far as I can see here in Europe, nothing got better, Winter is still going to be difficult. Sure, many are enjoying the summer, but everyone knows what is coming.