The number of “new bull market” stories have skyrocketed in recent days. Suddenly, chartists on my social media feed are full of “if this index rises to X, or this indicator gets to Y, we have a new bull market”.
I am skeptical of single-variable models. Instead, I offer a study of past major bear market bottoms using factor and macro analysis to see how current circumstances fit with the fresh bull story.
A factor analytical framework
Strictly from a quantitative and technical analysis framework, here is where the market stands today using the following uncorrelated factors to spot a bottom:
- Quality Factor: Major market bottoms often see a low-quality rebound as the washed-out stocks and half-dead companies surge and act like out-of-the-money call options. The quality factor is measured using the Russell 1000 to S&P 500 ratio. Both indices are nearly the same as they are both cap weighted, but S&P has stricter profitability inclusion criteria for its indices compared to FTSE/Russell, therefore the performance of the ratio shows a large cap quality effect.
- Cyclical Factor: Major market bottoms usually experience a cyclical rebound, as measured by the copper/gold ratio.
- Risk Appetite Factor: One indicator of risk appetite and equity beta is the performance of consumer discretionary to consumer staple stocks.
- Price Momentum Factor: New bull markets sometimes exhibits strong price momentum after a major market bottom. I measure this factor using a variation of the “bear killer” model created by Dean Christians of SentimenTrader. The model flashes a buy signal on the first instance of the percentage of S&P 500 stocks above their 50 dma to spike above 90% after an initial decline of -20% in the S&P 500.
The status of the factors today presents a mixed picture. The S&P 500 has rebounded, but it has yet to challenge a major falling trend line.
The copper/gold ratio has been mostly flat, while low-quality has experienced a mild rebound. The cyclical factor, as measured by the consumer discretionary to staples ratio, has rebounded. The market saw a breadth wipeout in mid-June and the “bear killer” factor recovered strongly and it reached the critical 90% level to flash a buy signal.
A history of market bottoms
A study of past market history shows eight major market bottoms since the market top in 2000. There were three bear market bottoms caused by recessions and five that were not, which we will call cyclical bears.
Here are some commonalities of recession bear markets, which are marked in pink on the chart. Both the low-quality factor and bear killer models registered buy signals, though the elapsed time from the breadth wipeout to the buy signal was a bit prolonged in the 2003 case. The signals from the other two factors were more hit-and-miss. They flashed buy signals in some cases and not in others.
I don’t plan to analyze every bottom episode in detail, but the factor conditions today bear an uncanny resemblance to the bottom in 2001, though 2001 was an unexpected geopolitical shock from the 9/11 attack. The stock market had been in a bear phase in 2001 when 9/11 hit and the S&P 500 rebounded sharply to rally through a fall trend line. Much like today, neither low-quality nor the cyclical factor showed much of a bullish response, but the risk appetite factor was bullish. After rallying through the falling trend line, the market went on to trade sideways for eight months before weakening again to test the old lows. I am not fond of market analogs and this is not a forecast, but the 2001 experience opens the door to the market consolidating sideways for months after rallying through a falling trend line.

The jury is out on a V-shaped bottom. There were three V-shaped bottoms and five bottoms where the market chopped around after making an initial low. Of the three shaped bottoms, two were successful and the market never looked back (2016 and 2020) and one was unsuccessful (2001). The 2016 bottom was characterized by a “bear killer” price momentum buy signal and the 2020 bottom was boosted by an unprecedented level of fiscal of monetary support which also led to a “bear killer” buy signal.
The Fed’s reaction function
History doesn’t repeat itself but rhymes. Historical studies can only offer some guidelines to the market outlook. Notwithstanding the results of the historical factor studies, what really matters is the Fed’s response function. Does it react to the forward-looking indicators of inflation, which are trending down, or will the Fed err on the side of caution in its inflation fight and drive the economy into recession?
The bullish narrative is that inflation surprise has been trending down all over the world, indicating an easing of inflationary pressures.
On the other hand, the Fed has repeatedly said that it is concerned about inflationary expectations becoming unanchored. The conventional way of controlling inflationary expectations and preventing a wage-price spiral is by cooling the jobs market. The Atlanta Fed’s
Wage Growth Tracker shows that job switchers are enjoying much better wage growth than job stayers, indicating a tight labor market. The Fed’s job of tightening monetary policy is nowhere near done.
One key transmission mechanisms of tight monetary policy is through tightening financial conditions, as evidenced by yield spreads. Can anyone honestly say that the Fed’s job is done and it’s time to ease financial conditions, as yield spreads have done recently?
In the past, major stock market downdrafts have been accompanied by the St. Louis Fed Stress Index rising above zero. This will be the only exception if the market has indeed bottomed and it implies that the Fed is nearly done tightening.
In the wake of the tamer than expected CPI report, the Fed sent out two well-known doves to deliver hawkish messages.
Bloomberg reported that Minneapolis Fed President Neel Kashkari stated:
The idea that we’re going to start cutting rates early next year, when inflation is very likely to be well in excess of our target – I think it’s just unrealistic…I think a much more likely scenario is we will raise rates to some point and then we will sit there until we get convinced that inflation is well on its way back down to 2% before I would think about easing back on interest rates.
The
Financial Times reported that San Francisco Fed President Mary Daly that it’s too early to declare victory on inflation:
“There’s good news on the month-to-month data that consumers and business are getting some relief, but inflation remains far too high and not near our price stability goal,” Daly said on Wednesday, after the latest consumer price index report showed no increase between June and July and a slower annual inflation rate of 8.5 per cent.
Still, “core” prices — which strip out volatile items such as energy and food — climbed higher, led by an uptick in services inflation that Daly said showed little sign of moderating.
“This is why we don’t want to declare victory on inflation coming down,” she said. “We’re not near done yet.”
She continued:
“We have a lot of work to do. I just don’t want to do it so reactively that we find ourselves spoiling the labour market,” Daly said. She pushed back on rising investor expectations that the Fed will abruptly turn to cutting rates next year. “If we tip the economy over and [people] lose jobs, then we haven’t really made them better off.”
Market positioning
The Fed’s job of tightening monetary policy and financial conditions is complicated by the animal spirits of some market participants and capitulation by others. Numerous institutional surveys and data point to a high degree of risk aversion by institutional investors and hedge funds. The latest S&P Investment Manager Index shows that risk appetite is low and a bearish outlook on near-term US equities. Both Goldman Sachs and Morgan Stanley prime brokerage have also reported low levels and falling levels of risk exposure among hedge funds.
On the other hand, the retail Reddit YOLO stock traders are back and pumping up the shares of meme stocks.
As well, households have bought $5.9 trillion in equities over the past two years through Q1 2022. Historically, the past three major market bottoms have occurred after substantial household investor selling.
Marketwatch also reported that Citi’s global strategist Robert Buckland sounded a note of warning that sell-side analysts were becoming overly giddy, which is a worrisome sign in the face of a possible recession.
“Our index of global sell-side recommendations is back to peak bullishness levels reached in 2000 and 2007, after which global equities halved,” noted a team led by chief global equity strategist, Robert Buckland.
“Analysts are net buyers of every sector in every region, but then they usually are,” he said, noting specific concentration on U.S. and emerging markets. “They are still bullish on cyclical sectors suggesting few fears of oncoming global recession.”
In any case, that “analyst herding” has triggered a red flag in Citi’s bear market checklist, which has eased to 6 from a potential 18 flags. Note, this particular flag gave a false sell signal in 2012, when global stocks were flat for the following 12 months. But still, what happened in 2000 and 2007 makes it worth noting they say.
Institutions and hedge funds have thrown in the towel but retail investors and sell-side analysts are still partying. Sure, stock prices can squeeze higher from here, but do durable market bottoms look like this?
A narrow soft landing window
Much depends on whether the economy can avoid a recession. In a
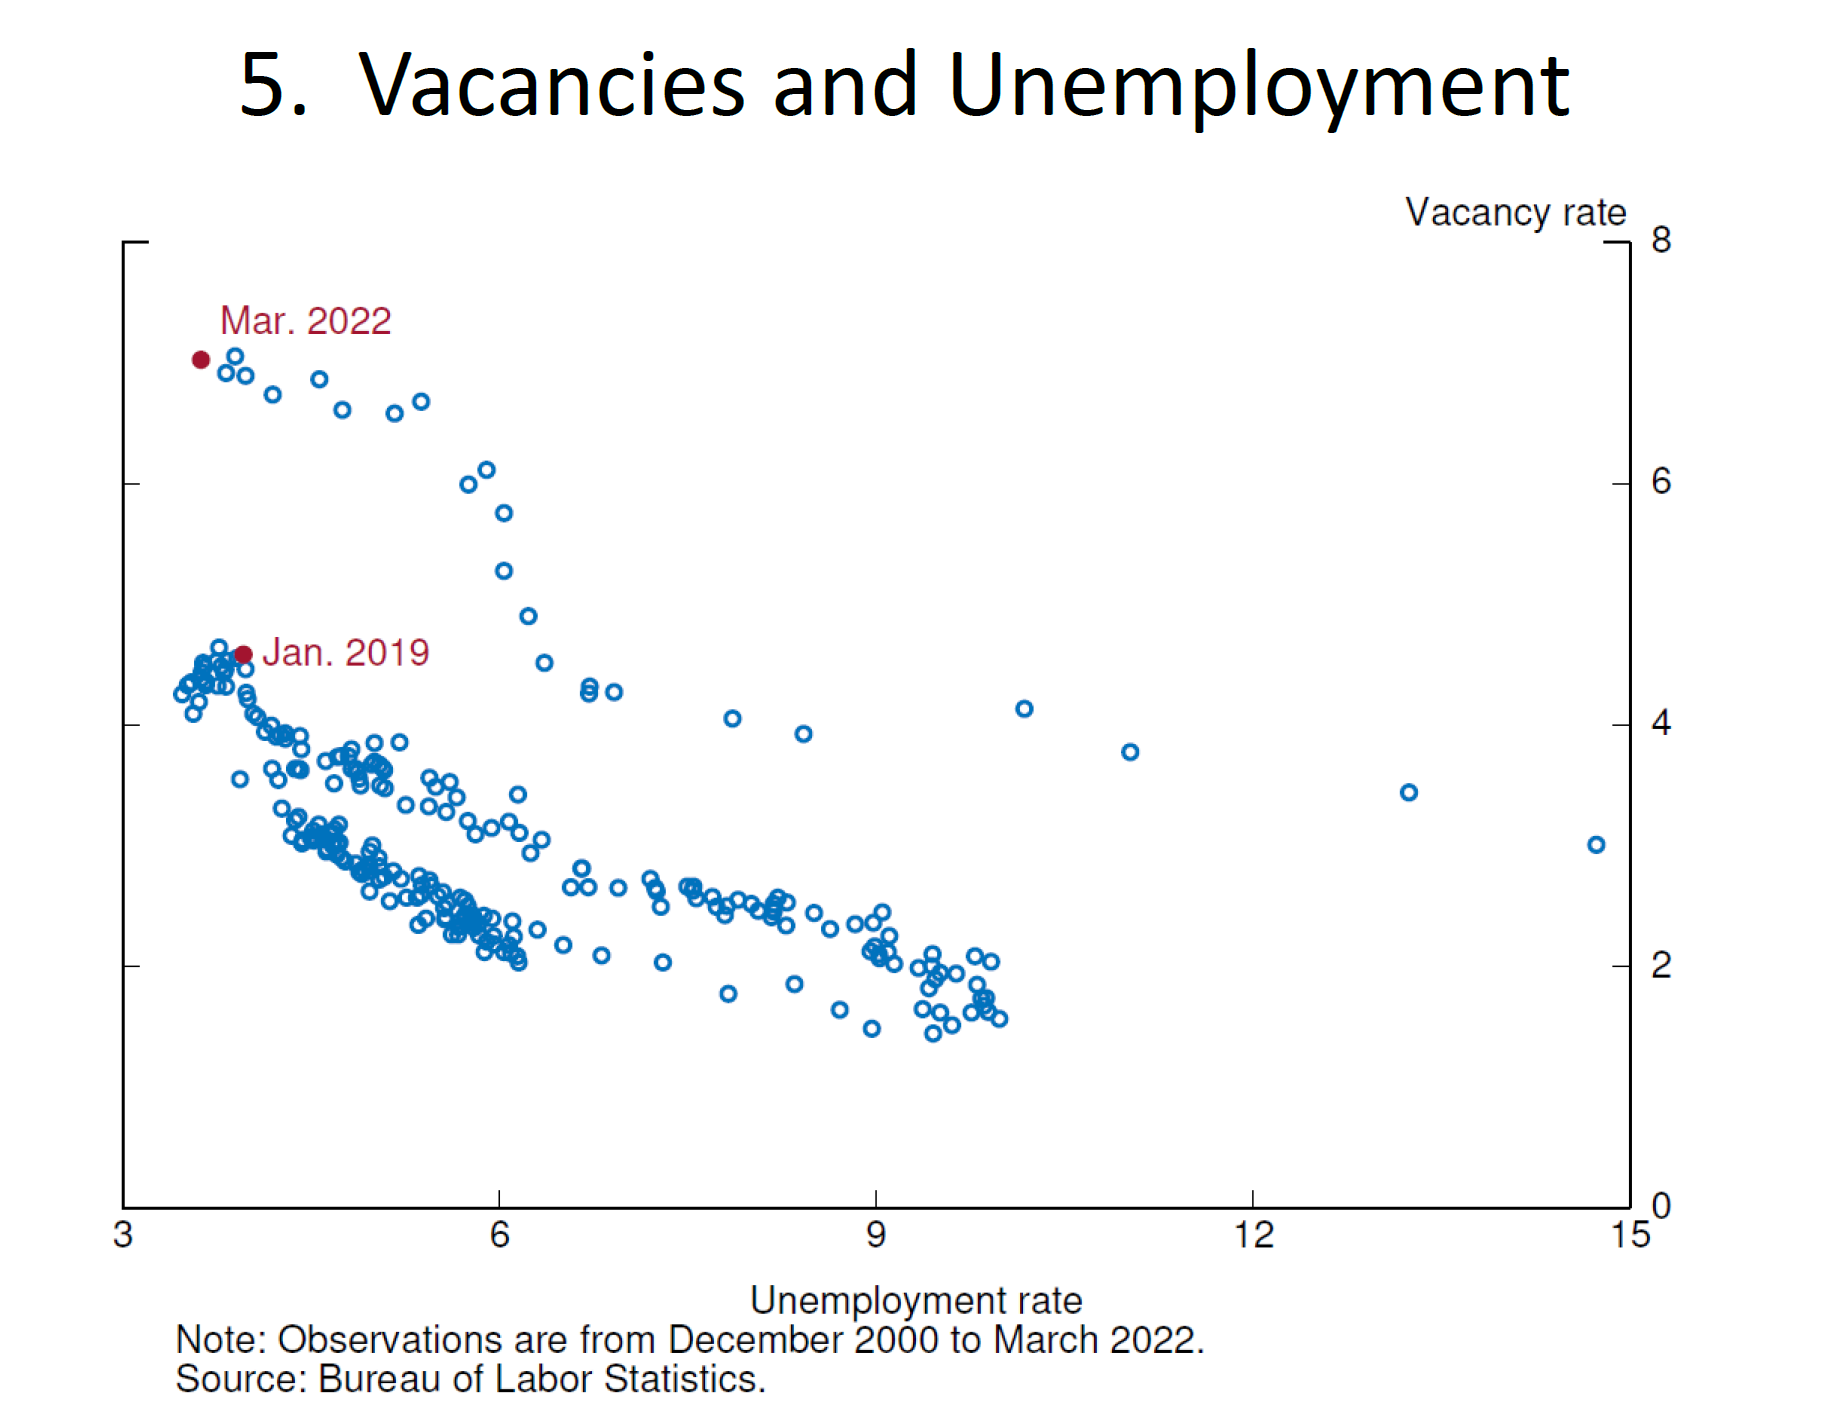
speech on May 30, 2022, Fed Governor Christopher Waller outlined a narrow window to achieve a soft landing without substantial damage to the jobs market. Waller highlighted the Beveridge Curve, which shows an inverse relationship between unemployment and the job vacancy rate. Waller noted a distinct anomaly between the Beveridge Curve data point in January 2019, which was before the onset of the pandemic, and the (then) latest data, March 2022.
These two dots suggest that the vacancy rate can be reduced substantially, from the current level to the January 2019 level, while still leaving the level of vacancies consistent with a strong labor market and with a low level of unemployment, such as we had in 2019.
What if the economy were to lower job vacancies by better matching jobs to job seekers? Waller asserted that “Matching efficiency represents factors that can increase (or decrease) job findings without changes in labor market tightness” and better matching as the pandemic era jobs rigidities fade can show the way.
The March 2022 observation lies at the top of the curve and is labeled point A. If there is cooling in aggregate demand spurred by monetary policy tightening that tempers labor demand, then vacancies should fall substantially. Suppose they decrease from the current level of 7 percent to 4.6 percent, the rate prevailing in January 2019, when the labor market was still quite strong. Then we should travel down the curve from point A to point B. The unemployment rate will increase, but only somewhat because labor demand is still strong—just not as strong—and because when the labor market is very tight, as it is now, vacancies generate relatively few hires. Indeed, hires per vacancy are currently at historically low levels. Thus, reducing vacancies from an extremely high level to a lower (but still strong) level has a relatively limited effect on hiring and on unemployment.

Former IMF Chief Economist Olivier Blanchard and former US Treasury Secretary Lawrence Summers pushed back against Waller’s narrative in a
paper. They concluded that after every previous peak in job vacancies, unemployment rose as the vacancy rates fell. In other words, higher levels of vacancies will lead to a rise in unemployment.
Waller and Fed economist Andrew Figura responded with another
paper and argued that the effects of the pandemic-related shutdown were so unprecedented that this time could indeed be different. In any case, the data should resolve the Beveridge Curve debate in the coming months. If Waller is right and the curve is steep, job vacancies should fall without substantial damage to the unemployment rate. On the other hand, if the historical evidence cited by Blanchard et al is right, tighter monetary policy will cause the unemployment rate to rise. An economic slowdown and probable recession will follow.
A likely re-test
Where does that leave us? I believe the most likely outcome will see the major market averages weaken and re-test of the June lows in the coming months. Much depends on the Fed’s reaction function. The market has already discounted a dovish pivot and any surprise is likely to be a hawkish one.
Despite the “bear killer” price momentum model flashing a buy signal, I still have my reservations. A study of the record of another price momentum model, the Zweig Breadth Thrust buy signal, is instructive. The model is a price momentum model that showed only six buy out-of-sample buy signals since Marty Zweig wrote about it in 1986. While the market was up a year later in all cases, the two “failures” in 2004 and 2015 occurred when the S&P 500 didn’t immediately rise further and traded sideways. The macro backdrop was an environment of the Fed tightening monetary policy, which corresponds to the conditions today. The monetary policy backdrop is especially important in light of the previous analysis showing that past periods of major market downdrafts has always seen the St. Louis Fed Financial Stress Index rise above zero, which it hasn’t done yet.

For the contrary view, I turn to
Walter Deemer‘s canary in the coal mine using the UK stock market as a risk appetite barometer: “The Bank of England hiked their inflation rate-peak forecast to 13%. It also now expects the economy to be in recession for more than four quarters starting this fall. These are far dire forecasts than three months ago.” If UK equities can shrug off the grim outlook, it would have bullish implications for global risk appetite.
I point out that the FTSE 100 consists of global companies, it is heavily weighted in resource and energy stocks and it’s not reflective of the UK economy. The midcap FTSE 250 is a better barometer of market expectations for the UK. So far, the FTSE 250 looks like it’s trying to form a bottom, but investors will have to wait for better price action before turning overly bullish as it’s failed to achieve the same kind of upside breakout seen in the S&P 500.


Nice work Cam, with many charts including that of the FTSE 250 to watch over the near term for signals.
Personally, I’m hoping to see a retrace to SPY 412 for a ST play to ~420 before waiting for a further decline below 400.
On a more fundamental basis, AAPL is a case of exuberant expectations in my view. It’s up 33% from its June low while SPY is up 18%. It’s single digit growth rate with a forward PE of roughly 25 seems excessive. It is roughly 14% of QQQ and 7% of SPY.
It’s all time high of 182 is nearby. Maybe it runs up to that point and drags the market to 200 ma.
I think a pullback is near.
Full disclosure: it’s my largest single stock position.
Excellent missive. Thanks.
Yes, nice job.
By 5.9 trillion, do you mean 5.9 trillion added to market caps? 5.9 trillion is a lot of cash to buy stocks, where did it come from? Even company buybacks don’t come close and I thought buybacks were among the biggest factors in supporting the market.
A big factor of low inflation was outsourcing, that is changing and that should be inflationary. Work from home is a sibling to outsourcing and could help moderate wages depending on how much more can be done.
How long will it take for relations with China and Russia to go back to pre covid levels? More than 1 year is my guess.
Resources will get scarcer and eventually prices go up.
So inflation won’t go down easily unless things get broken really badly.
The Fed wanted inflation at 2%, they got oops! Now they want to bring it down, maybe we get an ooops! of -5%.
Market is irrational, we are still above the pre covid ATH are things so much better than early 2020?
Stay humble.
I don’t know what will happen, a crash to 2200 or lower would not surprise me , but neither would a new ATH.
https://twitter.com/WalterDeemer/status/1558456248181428225/photo/1
Right. Never easy.
Bob Farrell is always worth reading, but there are systematic ways to trade the markets so we don’t have to rely on ‘wanna or gonna’. A good example here is the unfortunate bear that ran into the bullish $UPVOLSP (upvolume for SPX) day on Friday noon that may turn a short trade into a loss. Deemer often relies on Up volume and one of the student of upvolume is John Harrier who has done a sample of 90% upvolume days, 2 out of 3 days qualifies as a mini thrust and the buy signals are not frequent but about 80% of them profitable in 14 trading days with minimal losses, even during 2008, 2009. The study suggests bulls have an advantage at this point even as the market has seen 3 of these since May 2022 for this infrequent signal (11 since 09/2007). In September of 2010 this signal generated right below the 200 day MA and continued to rally for 46 trading days for a gain of 10.72%. There are several more examples of hitting resistance from the trade dates linked below.
https://i.imgur.com/jT5x3Zk.png