Preface: Explaining our market timing models
We maintain several market timing models, each with differing time horizons. The “
Ultimate Market Timing Model” is a long-term market timing model based on the research outlined in our post,
Building the ultimate market timing model. This model tends to generate only a handful of signals each decade.
The
Trend Asset Allocation Model is an asset allocation model that applies trend following principles based on the inputs of global stock and commodity prices. This model has a shorter time horizon and tends to turn over about 4-6 times a year. The performance and full details of a model portfolio based on the out-of-sample signals of the Trend Model can be found
here.
My inner trader uses a
trading model, which is a blend of price momentum (is the Trend Model becoming more bullish, or bearish?) and overbought/oversold extremes (don’t buy if the trend is overbought, and vice versa). Subscribers receive real-time alerts of model changes, and a hypothetical trading record of the email alerts is updated weekly
here. The hypothetical trading record of the trading model of the real-time alerts that began in March 2016 is shown below.
The latest signals of each model are as follows:
- Ultimate market timing model: Sell equities
- Trend Model signal: Neutral (upgrade)
- Trading model: Neutral
Update schedule: I generally update model readings on my site on weekends and tweet mid-week observations at @humblestudent. Subscribers receive real-time alerts of trading model changes, and a hypothetical trading record of those email alerts is shown here.
Subscribers can access the latest signal in real-time here.
A dovish tone?
There were few substantial surprises from last week’s FOMC decision. However, the market interpreted Powell’s statements as slightly dovish. As a consequence, Fed Funds futures began to discount a pause in late 2022 and easing by March 2023, which is a significant change from the expectations before the meeting announcement.

Fed Chair Jerome Powell referred to the June Summary of Economic Projections, or dot plot, in the post-FOMC press conference as “probably the best estimate of where the Committee’s thinking is still”. The Daily Shot pointed out that the market is massively fighting against the dot plot, which is “a trajectory that looks too dovish, given the broad and entrenched inflationary pressures”.
In case you missed it, Powell slammed the door on a dovish pivot during the press conference, even if the economy were to fall into recession.
STEVE LIESMAN. The question was whether you see a recession coming and how you might or might not change policy.
CHAIR POWELL. So, we’re going to be– again, we’re going to be focused on getting inflation back down. And we– as I’ve said on other occasions, price stability is really the bedrock of the economy. And nothing works in the economy without price stability.
The Fed appears to already be starting a campaign to correct market perceptions. The
NY Times reported that Minneapolis Fed President Neel Kashkari pushed back on market expectations of a dovish Fed pivot.
Neel Kashkari, the president of the Federal Reserve Bank of Minneapolis, suggested on Friday that markets had gotten ahead of themselves in anticipating that the central bank — which has been raising interest rates swiftly this year — would soon begin to back off.
“I’m surprised by markets’ interpretation,” Mr. Kashkari said in an interview. “The committee is united in our determination to get inflation back down to 2 percent, and I think we’re going to continue to do what we need to do until we are convinced that inflation is well on its way back down to 2 percent — and we are a long way away from that.”
“I don’t know what the bond market is looking at in reaching that conclusion,” Mr. Kashkari said, adding that the bar would be “very, very high” to lower rates.
In what world does anyone think that massively fighting the Fed is a good idea?
The bull case
To be sure, a bull case can be made. From a technical perspective, the bulls will argue that the S&P 500 is going on an upper Bollinger Band ride, with the 5-day RSI exhibiting a series of “good overbought” readings, with initial resistance at the 4150-4170 zone. However, the VIX Index closed Friday below its Bollinger Band, indicating an overbought market condition and flashed the warning the sign of a possible short-term top.
Price momentum is strong and it’s hard to argue with success.
Ed Clissold at Ned Davis Research pointed out that the market flashed two breadth thrust signal last week and such instances have tended to resolve in bullish manners. The first saw 10-day advances/10-day declines rose above 1.9.
The second saw the percentage of S&P 500 stocks at 20-day highs rise to 55%.
Sentiment readings are normalizing after a period of bearish excess. The Investors Intelligence bull-bear spread turned positive after several weeks in negative territory. Such conditions are typically signs that a sustained relief rally is underway.
The bear case
From an intermediate-term perspective, the most worrisome aspect of the current market advance is the lack of retail capitulation. While institutional and hedge fund sentiment is washed out, (see
Revealed, the secret lives of corporate insiders), retail investors are still moderately bullish on equities.
Mark Hulbert, who has been a long time tracker of newsletter sentiment, also believes that the market needs a final washout. He advised in a recent
Marketwatch column, “Be on the lookout for the final two stages of bear market grief — depression and acceptance — before a major new bull market can begin.”
A recent BoA survey of private clients reveals that while equity allocations have retreated from all-time highs, readings are nowhere near panic levels.
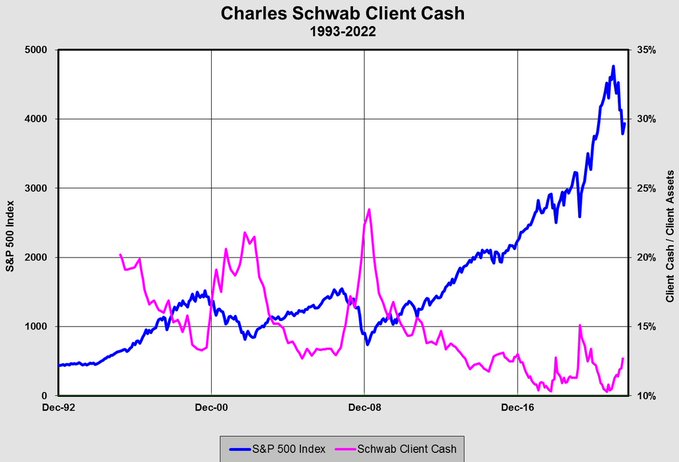
A survey of Schwab client cash shows that while cash levels have risen, readings are also far from levels seen at past major market lows.
The breadth thrusts recorded last week were accomplished with less than impressive up volume, which barely exceeded 80% on one of the days. Shouldn’t breadth thrusts, which are buying panics, be occurring on better enthusiasm? On Balance Volume, which measures accumulation and distribution, is indicating a lack of participation on this rally, or distribution, similar to the failed rally in March. As well, while net new highs (bottom two panels) are trending up, the lack of net new highs is another sign of poor breadth. While OBV divergences and negative breadth are not immediate and actionable sell signals, they nevertheless are warning of an unsustainable advance.
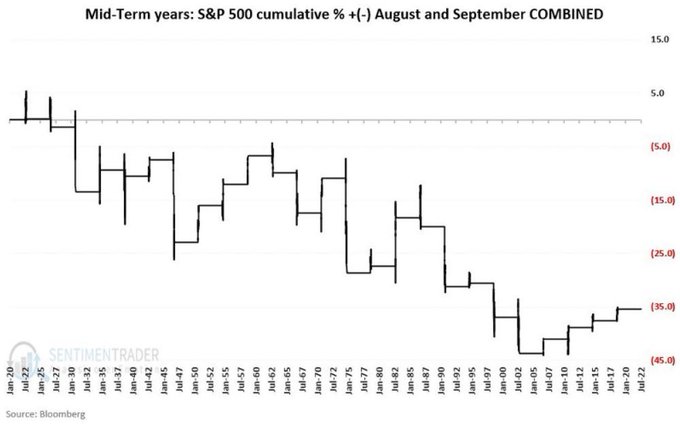
Market seasonality could also provide some headwinds for equity returns. Jay Kaeppel at SentimenTrader observed that the S&P 500 Index has registered a net loss for the months of August and September during midterm election years.
Tactically, Jeff Hirsch at
Almanac Trader pointed out that “the first eight or nine trading days [of August] have historically been weak with the major indexes shedding around 0.4% to 1.2%”, followed by some up-and-down volatility for the remainder of the month.
As well, House Speak Nancy Pelosi’s scheduled trip to Taiwan in early August has the potential to raise geopolitical tensions and spark an unwelcome risk-off event.
Clues from cross-asset analysis
Where does that leave us? This is an occasion where cross-asset, or inter-market, analysis can provide some clues. Here is what I am watching as indicators of risk appetite.
The 10-year and 30-year Treasury yields may be in the process of forming a head and shoulders pattern, but as good chartists know, such formations are incomplete until the neckline definitively breaks. If they both break in convincing manners, bond prices will rip.

As well, oil prices have also shown a strong long-term correlation to the 10-year Treasury yield. If bond yields break, look for confirmation from oil prices.
In the current environment of hyper-sensitivity over headline inflation, the S&P 500 has exhibited an inverse correlation to energy prices but they are currently exhibiting a minor negative divergence.
In conclusion, asset markets have gone risk-on in the wake of the FOMC meeting, but the market may be getting ahead of itself. The stock price advance has begun to take on a FOMO tone and could run further, but risk levels are rising. The Treasury and energy markets could be the guide to changes in risk appetite. If geopolitical tensions don’t fade and oil prices stay elevated, it will be difficult for stock prices to rise, bond yields to decline, and, by implication, for the Fed to pause or reverse its tight monetary policy.


Although medium term trends are important, the market is also cyclical and the importance thereof is underappreciated for the following reasons.
The McClellan Oscillator brings out the cyclicality nicely, but the classical implementation of 19d (and 39d) periods is too slow for our purposes. On the other hand the McClellan Oscillator of StockCharts corresponds to a 4d oscillator (why?) and is too fast for our purposes. I recommend a 9d (+19d) oscillator, which corresponds better with the !ITBMRASPX RSI14 depicted on Cam’s charts (e.g. 22-07-27), but is more direct. This chart should top out any day now.
Presumably Cam has a technical assistant, and can possibly provide an example of what I mean. Or is there perhaps a subscriber way of changing the timing parameters in StockCharts?
ITBM is a trading model and not an investing model. But you are correct, it’s overbought and it should be turning down soon.
I keep reflecting on how long the multitude of excesses took to build up, the massive amount of global stimulus and the degree of speculation and overvaluation reached across all asset classes. It seems that the unwinding of the everything bubble should be somewhat equal in scale. It doesn’t feel like we are far enough along yet, have gone through enough pain, reached the ‘despair’ phase of the cycle or ‘when it is time to buy you won’t want to’ point. Retail investors have not capitulated and Vix levels have been fairly subdued. We have yet to see a 45 plus handle. Still feels like we have a ways to go, either in time or price or both.
I agree, but that doesn’t mean the market cannot be irrational. So basically it all depends on where the money flows.
Don’t fight the Fed, but should the Fed fight reality?
So they raise rates and kick start a recession, so prices come down…for a while.
Everything comes down to energy. If energy is becoming scarcer, it will cost more, it will be more expensive to grow food, mine ores, build houses etc etc. If energy is scarcer prices will go up regardless of rates.
So while we may see people less on the road, less business travel etc and all of this cause decreased use of oil and hence prices go down, the oil shortage is a reality, especially as Asia grows. Higher oil prices are in our future unless we have a substitute.
So maybe at some point inflation drops because of a recession, but I think it will be back.
If they just left prices alone, high price of gas reduces consumption. How did the world survive before the Fed? It did though.
So my take is that unless this bear morphs into a monster, the big one is in the future when we just don’t have oil . I hope I’m wrong and higher prices get more shale oil, but what about CO2?
Keep in mind that hedge funds are extremely short and the BoA Global Fund Manager Survey shows that institutions are in despair. Only retail hasn’t capitualted.
So the smart money is short. I don’t blame the institutions, they have to get their 7% or whatever which was fine in hindsight with the SPX going up the way it did since 1982…they must be hurting in this environment.
The big advantage that we have is that we don’t have to do size.
Is there any data about the relative size of assets held by institutions and retail investors? Who carries more weight in the market?
well, from what they say, the institutions…they are huge, some require minimums of say 50 million $ a day of trading in a stock. Think Calpers, Manulife, they are huge. Anyways, they would have fed off us retail until we were smaller
The question that is left unanswered is: Is this a bear market rally or the beginning of the new bull phase?
Maybe it’s just chop and consolidation? There have been no trading signals for several weeks implying uncertainty and lack of conviction.
I am inclined to build a protective position over next several days.
https://mobile.twitter.com/carlquintanilla/status/1553873344038043649
FUNDSTRAT: The @ClevelandFed’s inflation forecast “now shows July CPI tracking to 0.27% .. This is .. 3.24% annualized .. the lowest rate since January 2021 .. a collapse from the 9%-12% annualized rates seen in all of 2022 ..” – @fundstrat
https://www.clevelandfed.org/our-research/indicators-and-data/inflation-nowcasting.aspx
The Cleveland Fed’s nowcast hasn’t been very reliable as an indicator.
Oh. Thanks, Cam. Had no clue.
Oil was down a lot in July maybe this played a role.
My thinking is a one month reading is too short, too many things can affect it.
Demographics are deflationary, but government spending has to debase the currency which is inflationary.
Sometimes it’s good to be old, I’ll be gone before the wheels totally come off the cart.
What would Marty Zweig be doing right now?
Closing TLT here in the premarket session ~117.8x. It’s also ex-dividend today so basically closing the trade flat. Back to 100% cash.
Way too soon!