The returns of my Trend Asset Allocation Model have been strong. Based on an “out of sample” record of signals from 2013 and a simulated portfolio that varies up to +/- 20% from a 60/40 benchmark, the model portfolio has managed to achieve equity-like returns with 60/40-like risk. Performance has also been consistently positive in the shorter time frames (to July 26, 2022).
- 1 year: Model portfolio -8.1% vs. 60/40 -9.8%
- 2 years: Model portfolio 7.1% vs. 60/40 4.2%
- 3 years: Model portfolio 10.2% vs. 60/40 7.1%
- 5 years: Model portfolio 10.9% vs. 60/40 7.8%
The Trend Model turned neutral from bullish in January 2022 and turned bearish in March. Amidst all the gloom about a global recession, it’s time to become more constructive on equities. The signal has been upgraded to neutral from bearish.
Here’s why.
A trip around the world
I turned more constructive on equities in late June based on conventional technical analysis techniques (see
Why last week may have been THE BOTTOM), but trend-following models are not designed to spot exact tops and bottoms, only trends. They will always be late to buy and late to sell. That’s a feature, not a bug.
My Trend Asset Allocation Model applies trend-following techniques to a variety of equity and commodity markets around the world to form a composite score to determine whether the global economy is reflating or deflating. A reflating economy is equity bullish and a deflating economy is bearish. With that preface in mind, let’s take a quick tour around to world to see how market perceptions have changed.
Starting with commodity prices, the energy-heavy Invesco-DB Commodity Index is holding between its 50 and 200 dma, which is a neutral signal, while the equal-weighted index is below both, a bearish signal. The cyclically sensitive copper/gold and base metal/gold ratios are in downtrends, which are deflationary signals. I interpret these conditions to be generally deflationary and negative for global growth. Commodities represent the weakest component of the Trend Model.
Over in the US equity markets, the S&P 500 has managed to regain its 50 dma while trading below its falling 200 dma. A falling moving average such as the 200 dma is usually interpreted as a bear trend, though the rally above the 50 dma is a constructive sign.
Across the Atlantic, the Euro STOXX 50 has regained its 50 dma but is trading below its 200 dma. The energy and resource-heavy FTSE 100 is above both its 50 and 200 dma, though the FTSE 250, which is more representative of the UK domestic outlook, is above its 50 dma but below its 200 dma. These are surprising results in light of the strains placed on Europe’s economy by skyrocketing energy prices as a result of the Russia-Ukraine war.
Asian equities are a bit of a mixed bag. None are in major downtrends, with some above their 50 dma and some below.
The relative underperformance of Asia can be attributed to the slump in Chinese growth, which can be also seen in the weakness in the commodity complex as Chinese infrastructure and property development has been the primary driver of commodity demand for the last two decades.
Neutral ≠ Buy
Before you become overly bullish, keep in mind that a neutral score isn’t a buy signal. This long-term monthly chart of the broadly based Wilshire 5000 has produced some useful buy and sell signals in the past. Buy signals are generated when the monthly MACD turns positive (bottom panel) and sell signals are shown by negative 14-month RSI divergences (top panel). The market is far from a buy signal on this model.
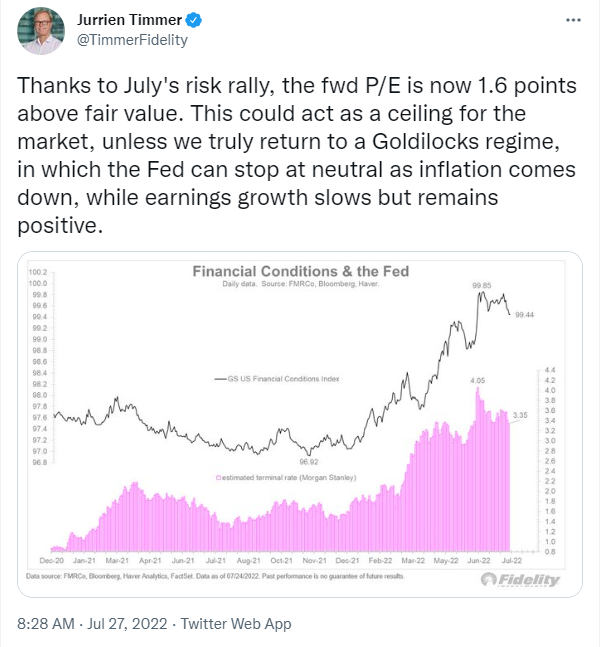
According to
Jurrien Timmer at Fidelity, the valuation case for a resumption of an equity bull depends on a macro Goldilocks scenario of a Fed halt at the neutral rate, falling inflation, and positive earnings growth.
As a reminder, former New York Fed President Bill Dudley wrote a
Bloomberg Op-Ed on April 6, 2022, which concluded that the Fed needs to hurt the stock and bond markets in order to bring inflation under control.
As [Jerome Powell] put it in his March press conference: “Policy works through financial conditions. That’s how it reaches the real economy.”
He’s right. In contrast to many other countries, the U.S. economy doesn’t respond directly to the level of short-term interest rates. Most home borrowers aren’t effected, because they have long-term, fixed-rate mortgages. And, again in contrast to many other countries, many U.S. households do hold a significant amount of their wealth in equities. As a result, they’re sensitive to financial conditions: Equity prices influence how wealthy they feel, and how willing they are to spend rather than save.
Dudley added:
Investors should pay closer attention to what Powell has said: Financial conditions need to tighten. If this doesn’t happen on its own (which seems unlikely), the Fed will have to shock markets to achieve the desired response. This would mean hiking the federal funds rate considerably higher than currently anticipated. One way or another, to get inflation under control, the Fed will need to push bond yields higher and stock prices lower.
If stock prices were to rise significantly, the Fed would view that as a loosening of financial conditions and it would have to respond with a tighter monetary policy. In other words, the Fed wants the stock market to fall. In addition, inflation expectations have begun to edge up. If it continues, it would be a disturbing sign for policy makers.
Key risks
For investors, a neutral ranking translates to upside potential is roughly balanced with downside risk. Since equities historically outperform bonds in the long run, it makes sense to hold a higher commitment to equities compared to bonds in a portfolio, all else being equal. But that doesn’t mean there are no downside risks.
There are two key risks to the equity outlook, namely China and Europe. Bloomberg reported that the mortgage boycott is significantly denting the banking system.
In the ongoing property crisis, people in cities from pottery-making hub Jingdezhen to Shanghai are withholding payments on mortgages for homes that developers, including Evergrande, have yet to finish. The amounts are huge. The wildcat boycott on loans is worth as much as 2 trillion yuan ($296 billion) to lenders, which have relied on mortgages as their safest source of revenue as Covid lockdowns stifle growth.
As a result, Chinese consumer confidence has plummeted.
As the Chinese financial system is largely closed, contagion risk should be relatively limited. However, the downturn in China is leaking globally through the trade channel. Both Korea and Germany have exhibited rare trade deficits as Chinese capital goods imports have tanked.
The other major risk to the global macro outlook is the effects of the Russia-Ukraine war on Europe. While progress is largely stalled on the battlefield, the battleground has shifted to hybrid war as Russia has weaponized energy and grains. Europeans are paying the equivalent of $400 oil as gas prices surged in Europe after Russia cut flows from the Nord Stream 1 pipeline to just 20% of normal capacity after flows resumed after scheduled maintenance. Soaring energy prices have stoked a cost of living crisis and boosted costs for industry, threatening to push the region into recession.
The
WSJ reported that the European Commission has estimated that a full cutoff of Russian gas during an average winter could reduce the EU’s GDP by 0.6-1% if no action is taken in advance to conserve energy. In a cold winter, a cutoff without preparation could lower GDP by an average of 0.9-1.5%. The
IMF also modeled the effects of a Russian gas cutoff. Its effects would depend on two assumptions: “An integrated-market approach that assumes gas can get where it is needed, and prices adjust…[or] a fragmented-market approach that is best used when the gas cannot go where needed no matter how much prices rise.” The magnitude of effects of the IMF model are broadly similar to the European Commission’s model.
The one wildcard is Chinese LNG demand. Chinese LNG importers have not been buying in the spot market for the winter in anticipation that Beijing’s zero-COVID policy will continue to cut demand. A rebound in Chinese LNG demand has the potential to devastate the global gas market.
Already, Asian LNG prices have surged as other regional buyers compete for scarce supply.
In conclusion, the balance of equity risk has begun to normalize. Signals from global commodity and equity markets showing that the upside potential and downside risk of owning equities have become more balanced. However, downside risks remain in the form of a China slowdown and further risks from the Russia-Ukraine war.
From a technical perspective, the S&P 500 staged an upside breakout through a falling channel, which is a constructive development. However, the market is likely to need a period of basing and consolidation. Expect some short-term choppiness before stock prices can recover to new highs.
Be patient.


Cam:
What has the fed done to tighten monetary conditions, other than raising the interest rate? My impression is that the Fed still has a lot of homework to do to fight inflation putting aside the interest rate. My dilemma is, are they really going to hurt the stock markets and the real economy or they will end up accepting a higher inflation as stated in the Blackrock analysis shared this week
Rates, QT, and guidance have all acted to tighten financial conditions. See yield spreads.
‘Basing and consolidation’ makes sense. If SPY 362 in mid-June was an interim low, then we’ve seen two retests to 377 and now the spike to 412. A retrace to let’s say 380-390 over the next few weeks would then form a reverse R shoulder that then launches a run back near old highs.
Going back to Hulbert’s Friday column – the above scenario is unlikely to engender the kind of ‘depression and acceptance’ needed to end the bear. So maybe another leg down in September/October to set the final low.
I think the Fed language of waiting for data to determine actions at FOMC meetings is being interpreted as hopeful for some kind of pivot..or it is being parlayed as such….we believe what we want to believe.
Even if they stopped raising rates, there is a lot of damage to the economy. Look at housing. What about those companies that have to roll over debt over the next few years? So I think the bear will return.
But it all depends on where the money goes…look at cryptos where the only value is the possibility it may go up in value.
Financial conditions have tightened, parts of the economy have slowed dramatically and some are slowing. Labor market is still tight but showing some signs of slowing.
Would employers go through deep cuts when they have had such difficulty recently in hiring? I think the layoffs may be much shallower this go around. If so, Labor markets may stay stronger and inflation persistent at a higher level. What would Fed do being data dependent? I think the pivot may come later when inflation is much lower. Market is likely to be disappointed.
Only price pays. Any other analyses and predictions are for reference only. Let’s focus on market behaviors which have the best record in predicting the economy forward.
Here are some developments:
1. SP500 components have 55%+ at new 20D highs, considered very important.
2. If the number of components above 50DMA can reach 85% , currently at 70%+, it would suggest very strong thrust.
3. US10Y has declined by 23.5%, while next four quarters earnings estimates have dropped by about 1%, but 2Q earnings estimates have been increased since reporting season started.
4. USD is down by about 3%.
5. Market internals have improved dramatically since June. For example $NYSI has been up to 156 from -862.
6. High yields have gone up by about 8%, and its CDS spread dropped by more than 15%.
7. xlk:spy is approaching 200DMA.
Going forward, overall, we should expect markets to make higher highs and higher lows. Now that Vix is below 200DMA, systematic mechanical flows should ramp up since the VaR parameters have improved. Watch for 20DMA and 50DMA golden cross and watch when SnP finally goes above 200DMA.