Mid-week market update: So much for the Cleveland Fed inflation nowcast which was calling for a tame CPI surprise. The market reacted to the hot CPI print this morning by adopting a risk-off tone, though it recovered later in the day.
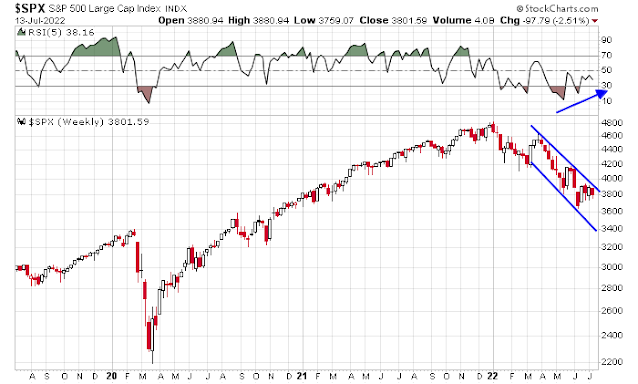
For equity investors, keep in mind that the intermediate-term structure of the S&P 500 is a falling channel within the context of a positive RSI divergence.


Here is how I interpret the stock market’s outlook.
A hot CPI report
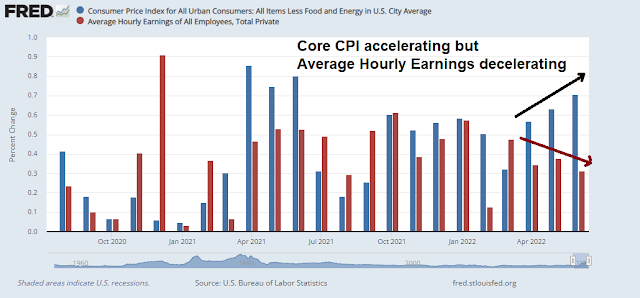
CPI came in higher than expected. The bad news is core CPI is accelerating upwards, which will keep the Fed on a hawkish path. The good news is average hourly earnings is decelerating, indicating the lack of a wage-price spiral.

Here is how Fed Funds futures reacted in the wake of the CPI report:
- The base case for the July FOMC meeting remains a 75 bps hike, though there is a significant probability that it will be 100 bps.
- The September rate hike increased from 50 bps to 75 bps.
- The terminal rate remains at 350-375 bps, and the market expects the Fed to pause in November instead of December.

Still constructive on equities
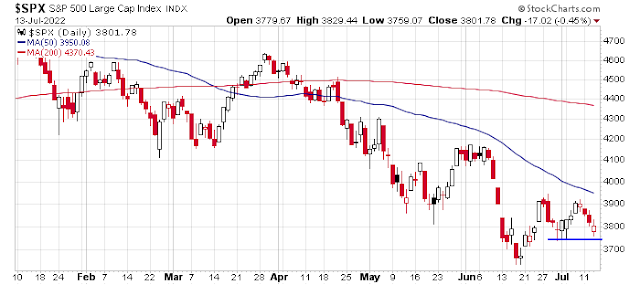
I remain constructive on the intermediate-term equity outlook. The S&P 500 is successfully testing a key support level in the face of bad news, which is a positive sign.

The relative performance of defensive sectors has been moving sideways, except for healthcare, during a period when the S&P 500 has been weak. This positive divergence is another reason why I am constructive on stocks.

Ed Clissold at NDR pointed out that the “Combination High-Low Logic Index” has moved into a zone when the S&P 500 has risen at a 21% pace per annum. Norm Fosback explained the Logic Index in this way:
Under normal conditions, either a substantial number of stocks establish new annual highs or a large number set new lows – bot not both. As the Logic index is the lesser of the two percentages, high readings are therefore difficult to achieve.

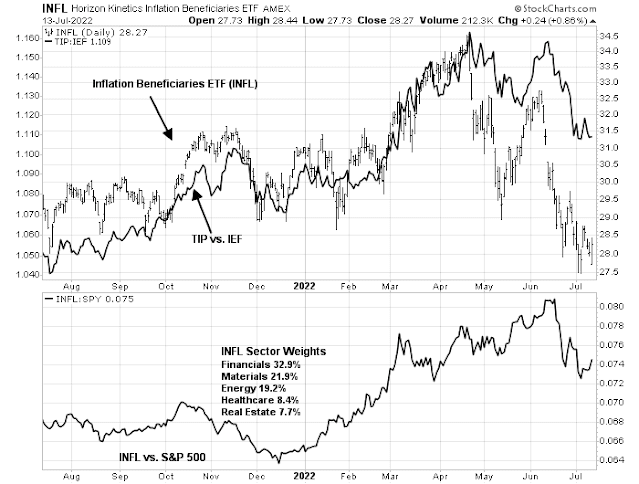
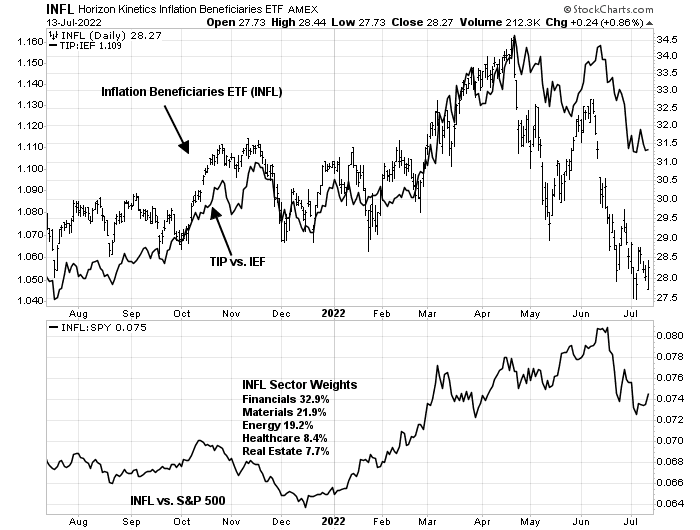
In spite of the excitement over inflation, the Inflation Beneficiaries ETF (INFL) hasn’t performed well, either on an absolute or relative basis.
Earnings seasons challenges
The next key test will be Q2 earnings season, which begins tomorrow as the banks report. Jurrien Timmer at Fidelity observed that global earnings growth is decelerating, though the US is decelerating the least.

Expect greater volatility in the coming weeks as we proceed through earnings season. I am inclined to buy the dips as the market doesn’t seem to be reacting very negatively to bad news. Earnings season will be the acid test for the markets.

The brutal sell off in the H1 already discounted a ton of bad news. The market expected a bad CPI report and expects declining earnings and downward guidance. Makes sense we are due due for a good rally here. The further along in a bear market the larger the counter trend rallies.
Looks like the market is now selling off in the overnight sessions and doing quite ok during „cash“ trading hours.
It seems like every trader and his brother are waiting to go long once the CPI (YOY change) turns lower and inflation is tamer, but we are really not close and Larry Summers has a paper to show why that is so. Ned Davis did a study where US inflation rate based on CPI data vs a 6 month moving average of the inflation rate can be used to trade the SPX with 70% of the trades profitable for ~60 years. The signal is often too early, but many traders seem to know about it. The strategy will go long once the US inflation rate cross down on its 6 month MA. The following link live chart and data is:
Live and Free SPX and US inflation data from this link or create your own free account.
https://www.tradingview.com/chart/iBqgb4AS/?symbol=SP%3ASPX
It is using data from FRED:CPIAUCSL
Look for the next few release dates and check – for example, we know if the July 2022 report due out on Aug 10 is ~8.29 (read that off of the linked chart) or below, there could be bullish fireworks – but traders should also realize that if they examine the trades over the 70 years history, the signal is often months early.
July 2022 Aug. 10, 2022 08:30 AM
August 2022 Sep. 13, 2022 08:30 AM
September 2022 Oct. 13, 2022 08:30 AM
October 2022 Nov. 10, 2022 08:30 AM
November 2022 Dec. 13, 2022 08:30 AM
“I haven’t seen any solid proof that inflation has reached its peak,” said Cleveland Federal Reserve President Loretta Mester said while speaking at the Bloomberg interview.. July 13th, 2022, 7:53 PM EDT
Didn’t see this until now. A student of the markets studying data going back to the 1920s could see that there were many instances where even a sharp drop in inflation did not cause the markets to rally right away. For example, by July of 1920, after the 1918-1919 influenza pandemic and its post pandemic market rallies, inflation was raging as inflation does after pandemics, at 23.7%. By that July, peak inflation finally broke with inflation rate breaking down through its 6 month smoothing average, nonetheless the markets kept dropping. It wasn’t until the inflation rate dropped to -15% 12 months later (yes, negative 15.8% and these were estimates not using modern methodology) that the markets rallied in earnest. The Dow bottomed in that 1920-1921 forgotten depression at 63.90 in August of 1921, although it did rally for a few months earlier after December of 1920 which did not hold.
https://www.ft.com/content/f8185c63-72c0-479d-80e9-e9c0bf8eb8c5
MOHAMED EL-ERIAN
Fortunately, inflation will come down over the next three months. That’s the good news. Less good is the continued broadening of price pressures that was evident in today’s detailed data.
As such, and especially if the Fed fails to get its act together quickly, it would be foolish to dismiss the chance of a third wave of inflationary pressures that would interrupt and reverse the downward movement of the next three months.
Professor Jeremy Siegel is concerned the Fed is going to tighten too much into a softening economy. The CPI report he said is very lagging. Other indicators like money supply growth plateauing supports his point of a slowing economy.
It seems the bearish thesis is more focused on black swans (e.g. Ukraine war escalation), indirect/secondary (e.g. effects of USD strength, deflationary bust, inflation resurfacing if pivoting too quick, etc.) or contagion/systemic like effects (e.g. real estate crash, EM dollar crisis, etc.) It’s harder in general to try to wrap our heads around.
While the bullish thesis is much easier. Earnings decline is priced in, CPI is a very lagging indicator, inflation is peaking, economy is weakening but consumer and corporate balance sheets are still healthy, inflation keeping nominal earnings up, many panic indicators have triggered, bad news now have more muted reactions, the Fed is also more agile and able to quickly pivot if needed, etc.
That last point on the Fed doing the right thing at the right time is one of the most important thing for the bullish camp. I wonder if Biden has any power or intention to pressure Powell to hike rates so that Democrats can fend off inflation-based Republican attacks.
https://twitter.com/michaelsantoli/status/1547637984085692416
“Still, #MysteryBroker adds that his “base case is that the Fed only raises 75 basis points in July and then either pauses or raises 25 basis points in September as the data clearly reveals lower future inflation rates.” Would mean more limited downside risk to equities.”
I think this scenario is more likely given the time gap between this month’s meeting and the next. The Fed should get some more data on softening inflation prior to their Sep meeting.
Cam
“I am inclined to buy the dips”
Inflation fighters seem to have pulled back. Would this complex make for a good buy?
Thanks.
Jim Bianco pointed out an interesting fact. Since April 1 – we have had 13 weeks of intense selling. That is 13 out of 15 weeks a statistic that happened only once -1929. Normally, this type of selling ends in a crescendo when the reason is finally known i.e a Lehman moment.
Increasing exposure this morning from 80% to 82.5%, and further capitulation into the close would probably prompt a move to 85%.
The SPX is off >-20% ytd. I’m off closer to -5%. Which gives me the confidence to place bets on a countertrend rally.
Wouldn’t surprise me to see a retest of the June lows. Nor would it be a surprise to see a green close.
Cam,
The USD is strong and may be topping. But would to see you do a deep dive on the impact of strong USD over the global financial plumbing?
What are the implications on the emerging markets and even Europe? Can some of it ricochet back on us?
A close at or near the highs today on high volume might spark the kind of FOMO needed for more than a one-day rally.
https://twitter.com/carlquintanilla/status/1547606502629732353
I think we’ve seen peak inflation. It’s now in the rear view mirror.
China indexes off -2% last night? I wouldn’t rule out a surprise announcement from China authorities over the weekend.
We got the nice close. Unfortunately, without the high volume.